

Abstract
Pioneering research established the concept of somatotopic organization of the primary motor and somatosensory cortex along the central sulcus as depicted in the widely known schematic illustration (the “homunculus”) by Penfield and colleagues. With the exception of the hand, however, a precise relationship between morphological features of the central sulcus and the representation of various parts of the body has not been addressed. To investigate whether such relations between anatomical features and functional body representations exist, we first examined central sulcus morphology in detail and then conducted a functional magnetic resonance imaging experiment to establish somatomotor representations. This study established that the central sulcus is composed of five distinct sulcal segments and demonstrated that each segment relates systematically to the sensorimotor representation of distinct parts of the body. Thus, local morphology predicts the localization of body representations with precision, raising fundamental questions regarding functional and morphological differentiation.
Keywords: central sulcus, fMRI, homunculus, neuroanatomy, sulcal morphology
Introduction
The general somatotopic organization of the sensorimotor cortex was established at the end of the 19th and early part of the 20th century in pioneering research using electrical stimulation in various animals, including humans (Fritsch and Hitzig 1870; Ferrier 1876; Vogt 1926; Foerster 1931; Taylor 1931). This research demonstrated that movement of different parts of the body can be produced by electrical stimulation of specific regions of the anterior part of the cortex and, in primates, the different parts of the body are represented along the central sulcus in an orderly dorsal to ventral arrangement (somatotopic representation).
In humans, the approximate location and relative size of these body representations was established by Penfield and colleagues by mapping the sensorimotor cortex of 126 patients undergoing brain surgery (Penfield and Boldrey 1937; Penfield and Rasmussen 1950). These results were depicted in a schematic diagram of the precentral gyrus known as the “homunculus” of Penfield (Fig. 1A). As can be seen in Figure 1B, based on these measurements, there was considerable variability in the location of the sensorimotor body representations across subjects. Thus, the homunculus reflects a relative dorsal-to-ventral location rather then an exact localization in relation to specific morphological features.
Figure 1.
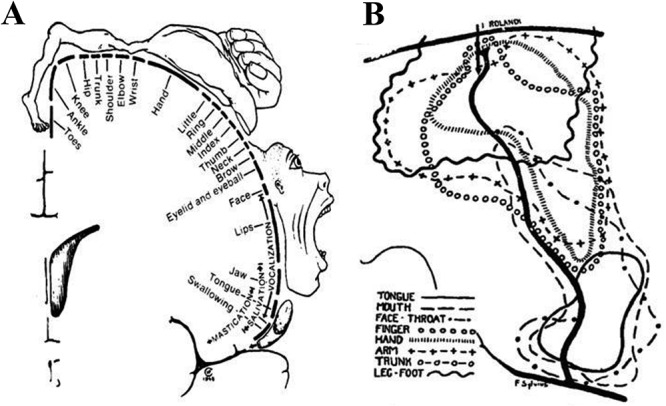
The homunculus of Penfield. (A) The dorsal to ventral sequence of body part representations along the central sulcus of the human brain. (B) This composite illustration shows the considerable interindividual variability and the sizeable extent of cortical area where a response in a specific body part could be elicited from electrical stimulation.
The central sulcus is a complex fold that originates from two distinct fetal grooves (Cunningham 1892; Ono and Kubik 1990). In the adult brain, it has a very characteristic winding appearance. It originates dorsomedially within the interhemispheric fissure and continues ventrally toward the Sylvian fissure. Then, it curves rostrally and extends for a short distance in a more or less horizontal direction before changing its course to run caudally again, continuing along the lateral surface of the brain in a vertical direction. These two curves created by this course were called the superior genu (knee) and the inferior genu by Broca (Broca 1889) who additionally described a submerged gyrus, the pli de passage moyen, situated between those two curves.
Previous studies have established a reliable relationship between the pli de passage moyen of Broca and the hand representation of the motor cortex (Yousry et al. 1997; Boling et al. 1999). Modern functional neuroimaging studies have repeatedly confirmed the general dorsal to ventral somatotopic organization (Grafton et al. 1993; Lotze et al. 2000; Fox et al. 2001; Alkadhi et al. 2002; Fesl 2003; Zeharia et al. 2012; Tal et al. 2017), and a recent study showed that at an individual level, the fine-grain somatotopic organization is stable over time (Kolasinski et al. 2016). Interestingly, another recent study using intraoperative cortical stimulation in human patients found that in addition to the dorsoventral organization, there is an intricate rostral-to-caudal somatotopy within for example the fingers (Roux et al. 2018). However, all studies found that there was substantial interindividual variability in the precise localization of somatomotor body representations that made it impossible to localize individual body representations without functional data in the absence of established landmarks. Sulcal landmarks have previously proven invaluable in localizing functional areas in individual brains (Tomaiuolo et al. 1999; Frey and Petrides 2000), and a recent study was able to relate the sulcal morphology of the postcentral sulcal complex with sensorimotor body representations (Tomaiuolo and Giordano 2016; Zlatkina et al. 2016).
To determine whether there are reliable relations between functional body representations and particular morphological features of the central sulcus, we undertook a detailed analysis of the morphology of this complex structure on anatomical magnetic resonance imaging (MRI) and mapped the sensorimotor body representations found along the course of the sulcal segments using functional magnetic resonance imaging (fMRI).
Materials and Methods
Morphology of the Central Sulcus
Subjects
Twenty normal healthy subjects who participated in the ICBM project were included in this study. All subjects had no history of neurological and/or psychiatric disorders and signed informed consent.
MRI Acquisition
T1-weighted anatomical scans were acquired on a Philips 1.5T Gyroscan (Best, Netherlands) scanner at the Montreal Neurological Institute (MNI) as part of the ICBM project (Mazziotta et al. 1995). Imaging parameters: spoiled gradient echo, sagittal acquisition, 140 slices, 1 mm thick, Repetition Time = 18 ms, Echo Time = 10 ms, flip angle 30°, Field Of View of 256 mm, isotropic 1 mm3 voxel.
Image Analysis
Using the Display feature in the MINC toolkit (http://bic-mni.github.io/), the fundi of the central sulci were examined in serial sections (1 mm steps) in order to identify discontinuities separating different segments of the sulcal complex and subsequently all voxels comprising the sulcal ribbon of each segment were marked. This procedure is necessary because discontinuities of sulci may not be detectable simply by inspecting the surface of the brain (Ono and Kubik 1990; Yousry et al. 1997; Boling et al. 1999). Only detailed inspection at each point, using different sections and viewing angles, allows the investigator to identify accurately the extent and depth of the morphology of a structure of interest. A second rater independently repeated this procedure to see if the sulcal landmarks can reliably be identified.
Sensorimotor Body Representations—fMRI
Subjects
Nine normal healthy subjects participated in this study. Two subjects were excluded from the subsequent analysis because of movement artifacts. Of the remaining seven subjects, three were female and the average age of the seven subjects was 25.4 years (standard deviation 4 years, range 21–32 years). All subjects gave written informed consent.
Motor Task
Subjects were placed in an fMRI scanner facing a screen monitor that presented the tasks and performed 14 different motor tasks in each run of scanning. Each task would start with the instructions presented for 3 s, followed by a blank screen for 2 s and the subject performing the task for 15 s. At the end, a blank screen was presented for 2 s and new instruction would appear in the monitor to initiate another motor task. The motor tasks were “wiggle your toes,” “flex your quadriceps,” “flex your abdominal muscles,” “move your little fingers,” “move your ring fingers,” “move your middle fingers,” “move your index fingers,” “move your thumbs,” “move your wrists,” “blink,” “move your tongue,” “purse your lips,” “swallow,” and “hum.” For a control condition, subjects remained completely motionless focusing on the center of the screen for 15 s. The total duration of each run of scanning was 5 min 30 s (22 s × 15 motor tasks).
fMRI Acquisition
The first subject was scanned on a 1.5-T Siemens Vision MRI scanner, the latter six subjects on a 3-T Siemens Trio MRI Scanner (Siemens AG, Erlangen, Germany). First, a high-resolution T1 anatomical scan with whole head 1 mm3 isotropic resolution was acquired followed by 4 or 5 (subjects 3 and 4) runs of 155 images (22 coronal T2* gradient echo planar EPI, 3 mm3 isotropic voxels, Field Of View 192 mm, Repetition Time = 2.2 s, Echo Time 45 ms) sensitive to the blood oxygen level–dependent signal. The slices were oriented parallel to the subject’s central sulcus in order to capture the pre- and postcentral gyri entirely (Fig. 2A).
Figure 2.
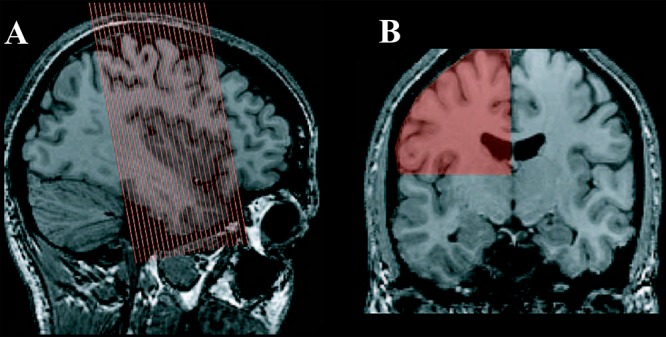
fMRI acquisition. (A) Scan area and orientation of the fMRI acquisition. (B) ROI (scan area per hemisphere above the sylvian fissure) used for statistical analysis.
Image Analysis
All brains were registered to the MNI 152 nonlinear brain using the automatic nonlinear image matching and anatomical labeling (ANIMAL) algorithm developed by Collins and colleagues (Collins et al. 1994, 1995). ANIMAL is an iterative algorithm that estimates a 3D deformation field matching a source volume to a target volume. The transformation estimation consists of two steps: first calculating a deformation at each node that will maximize the local similarity measure then smoothing to ensure that a continuous deformation field has been estimated. The manual identification on all segments on both hemispheres was used in the optimization of the nonlinear transformation using the method described by Collins and colleagues (Collins et al. 1998). The chamfer distance (Borgefors 1988) for each sulcal segment was estimated on both the left and right hemispheres for each subject and for the same segments identified on the MNI 152 nonlinear template. Each of these chamfer distance maps was then used as the sulcal constraints during the transformation estimation process. The transformation was estimated using a hierarchical estimation procedure, where large deformations were estimated first, and used as input in the next transformation where smaller deformations were then estimated. The final transformation is estimated on a grid of nodes with 2 mm spacing between nodes. Coregistration of all individual peaks onto the nonlinear 152 average brain was performed using anatomical constraints and the highest peak in t-value in our fMRI signal to estimate the central points of body representations.
Statistical Analysis
Because of the T1 saturation effect, the first frames of functional runs are not suited for analysis. Thus, the first three frames of each functional run were discarded and all images from each functional run were realigned using the fourth frame as reference. Each four-dimensional volume corresponding to an fMRI run was motion corrected using an algorithm that rigidly registers the volume acquired at each TR to the volume acquired at the fourth TR. The linear registration algorithm developed by Collins and colleagues (Collins et al. 1994) was used to estimate all transformations. The motion-corrected functional data were subsequently spatially convolved with a 6-mm Gaussian kernel and analyzed for fixed effects, as only single subject activations are considered in this study. The data were analyzed in its native space using the FMRISTAT software package developed by Worsley (Worsley et al. 2002). The statistical threshold was estimated using a region of interest (ROI) defined on a single hemisphere from each subject above the level of the sylvian fissure (Fig. 2B). A statistical summary was produced to estimate the P < 0.05 t-value threshold corrected for multiple comparisons (Worsley et al. 2002). Within the ROI, the significant threshold was estimated as t > 3.2. The threshold is the lower of the Gaussian random field theory or Bonferroni corrected estimates and depends on the number of voxels in the search area.
Results
The detailed analysis of the morphology of the central sulcus showed that it is not a single sulcus (i.e., it is not a continuous fold), but rather a sulcal complex comprising five separate sulcal segments. Each one of these five segments has an independent deep configuration (Fig. 3A,B). Their fundi are distinct in that they have clear starting and end points separated from one another by small gyral bridges, which connect the pre- and postcentral banks of the central sulcal complex. The characteristic winding appearance of the central sulcal complex is created by prominent bulges that are associated with the sulcal segments. When examined in detail in serial sections, the sulcal segments resemble the steps of a staircase: the lower segment placed laterally and rostrally (Fig. 3C). Reliable delineation of the five segments was possible on the basis of their characteristics in all 20 subjects (i.e., 40 hemispheres examined) and in the nonlinear MNI 152 average brain. This was confirmed by the second rater (Supplementary Fig. S1).
Figure 3.
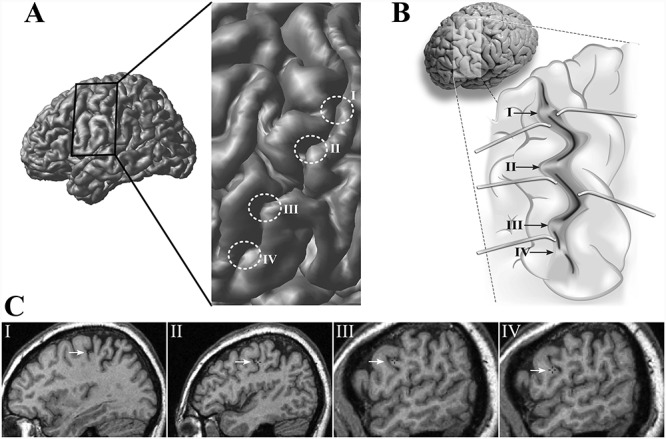
Morphological analysis of the central sulcus. (A) Lateral view of the left hemisphere of an individual brain with the central sulcus region enlarged to highlight the four distinct submerged gyri that can be identified along the course of the central sulcus. (B) An artist rendering of the opened left central sulcus (based on photographs of the opened sulcus) to help the reader appreciate the configuration of the sulcal depth and the submerged gyri that interrupt the course of the fundus of the central sulcus. (C) Sagittal sections showing the characteristic “step-like” appearance of those submerged gyri.
The five segments are numbered in a dorsal to ventral direction, segment 1 being the most dorsal. Segments 1 and 2 are found in the dorsal portion of the central sulcus, while segments 3, 4, and 5 are found along the ventral portion of the central sulcal complex running in a more or less vertical direction along the lateral surface (Fig. 4A). The first, second, and third segments of the central sulcal complex are deep folds, whereas the fourth and fifth segments are shallow (Fig. 4).
Figure 4.
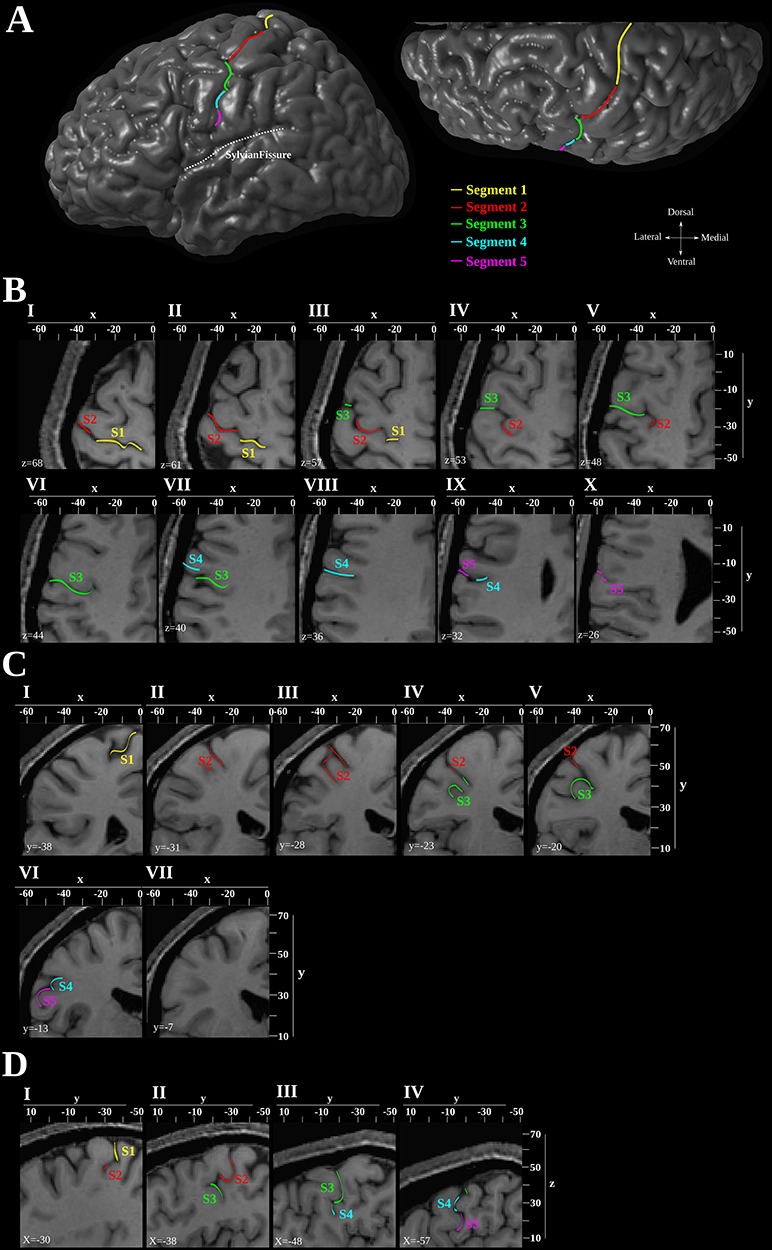
Morphological analysis of the central sulcus. (A) Lateral view of the three-dimensional reconstruction of the left hemisphere of subject 1 from the anatomical MRI. The five segments of the central sulcus are marked with different colors along the surface of the hemisphere. The sylvian fissure has been marked with a dashed white line. (B) Horizontal (C) Coronal (D) Sagittal MRI sections illustrating the five segments of the central sulcus. The dorsoventral (Z) level is indicated within each horizontal section and the mediolateral (X) and rostrocaudal (Y) coordinates are provided at the top and right sides of the sections.
Segment 1 is the most dorsal segment as it originates in close proximity to the interhemispheric fissure, which is separated from this segment by a narrow gyral passage, connecting the postcentral gyrus with the precentral gyrus. Segment 1 continues laterally along the dorsal surface of the brain, covering a distance corresponding to the width of the superior frontal gyrus. A submerged gyral passage just dorsal to the superior genu separates the first from the second segment (Fig. 4BI,II). Segment 2 curves in a ventrorostral direction forming the superior genu. The characteristic knob associated with the hand motor representation is formed by the curvature of this second segment. In the depth of the center of the inferior genu, a submerged gyral passage running from the postcentral to the precentral gyrus delineates the ventral end of this second segment (Fig. 4BI–V).
The third segment extends from the center of the inferior genu ventrally up to about the level of the inferior frontal sulcus where a submerged gyral passage forms its ventral limit (Fig. 4BIII–VII). The fourth segment is short and is oriented more or less vertically, and its ventral end is found at the upper level of the inferior frontal gyrus where a small submerged gyral bridge separates it from the fifth segment (Fig. 4BVII–IX). This gyral bridge is often prominent on the surface of the brain, forming a visible discontinuation of the central sulcal complex. The fifth segment is variable in both length and orientation. It is more or less vertically oriented in most cases, but a more horizontal orientation is occasionally observed. The central sulcal complex usually ends in close proximity to the sylvian fissure from which it is always separated by a gyral bridge (Fig. 4BIX–X).
After the morphological examination of the central sulcus in the 40 hemispheres had been completed, an fMRI study was carried out to investigate the potential relationship between the morphological features identified and the somatotopic organization of the sensorimotor cortex. In the fMRI experiment, during scanning, subjects performed 14 different motor tasks utilizing various parts of their body. Upon instruction, subjects performed each one of these movements bilaterally for 15 s while fixating on a cross in the center of the screen. In the control condition, subjects were focusing on the center of the screen for 15 s without making any movement.
The morphological characteristics established in the anatomical part of the study were identified in all the seven new subjects and the five segments of the central sulcus were labeled. These anatomical markings were used as constraints in a nonlinear registration of the individuals’ brains to the MNI 152 nonlinear average. This registration matches the anatomical landmarks identified in the individual hemispheres of all subjects, thus preserving the anatomical characteristics of the central sulcus and its five segments.
For each one of the 14 different motor tasks, the contrast “motor task minus control condition” was calculated and the left and right functional peaks within the central region were identified as the voxel with the highest t-value. All peaks of all subjects (14 contrasts × 2 hemispheres × 7 subjects = 196 peaks) were then projected nonlinearly onto the average MNI brain using the registration derived from the anatomical matching described above. This additional registration removes all variability related to variance in sulcal shape across subjects in order to determine whether specific functional areas related to particular parts of the body align with the central sulcus segments in a data-driven fashion.
A strong relationship between the location of the functional peaks and morphological features would indicate that the same body part of all seven subjects is situated at a comparable position relative to particular morphological features (i.e., it can be predicted from the morphology alone). The analysis of the localization of these peaks revealed such an intimate relationship: functional peaks of particular body parts do fall within narrow and orderly clusters found at specific locations relative to the morphological features of the central sulcal complex (Fig. 5). In fact, the four submerged gyri always separate distinct somatomotor peaks as localized by fMRI: the first submerged gyrus is separating “abs” from “wrist,” the second “thumb” from “blink,” the third “lips” from “tongue,” and the fourth “tongue” from “swallow” (Fig. 6).
Figure 5.
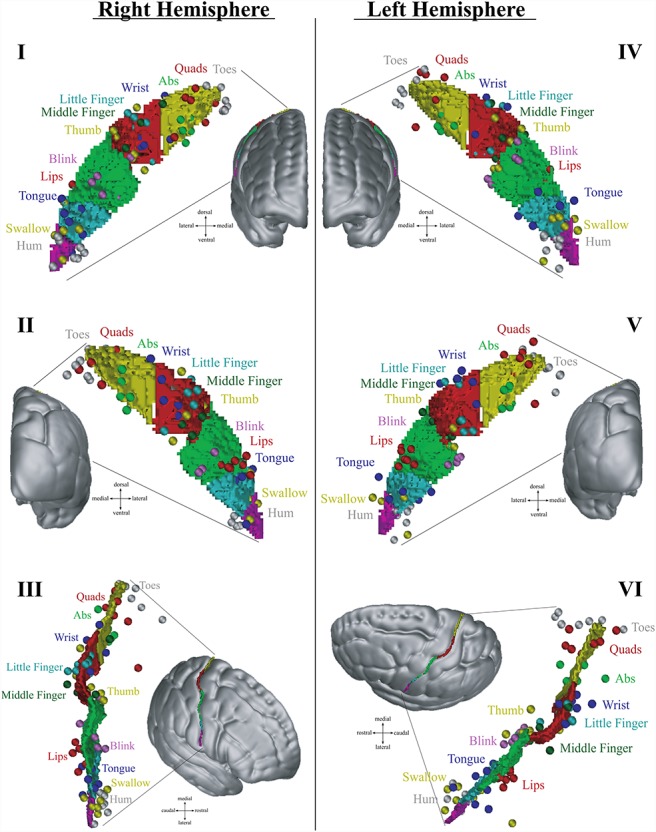
Location and distribution of all somatomotor peaks in relation to the central sulcus after registration using sulcal constraints. The fMRI activation peaks identified in all individual participants are represented as colored spheres. The five segments of the central sulcus are colored following the same color scheme used in Figure 4. Note that the remaining interindividual variance is minimal and somatomotor body representations of all individuals fall within small three-dimensional spheres around distinct locations of the central sulcus. In fact in some cases, they overlap thus fewer than 7 spheres might be found for one somatomotor body representation. I, II, and III right hemisphere; IV, V, and VI left hemisphere. I and IV frontal view; II and V posterior view; III and VI lateral oblique view.
Figure 6.
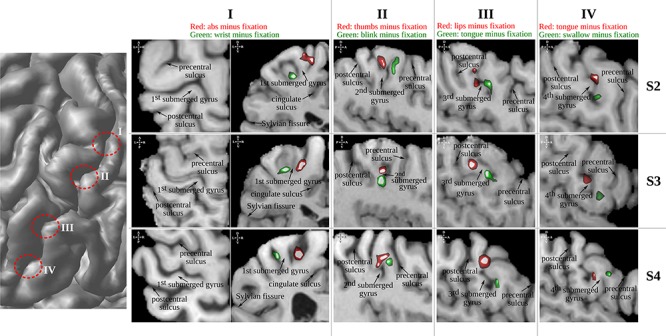
The four submerged gyri always separate distinct fMRI peaks associated with moving a particular body part in all subjects. The left hemisphere of subjects 2–4 (three rows) from the fMRI study are used for this illustration using coronal sections for the first and sagittal sections for the other three submerged gyri. Another horizontal section is shown for the first segment as the separation of segment one and two is difficult to discern in the coronal section alone. In all subjects, in both hemispheres, the first (from dorsal to ventral) submerged gyrus is separating “abs” from “wrist,” the second “thumb” from “blink,” the third “lips” from “tongue,” and the fourth “tongue” from “swallow.”
The intricate relationship local morphology and the location of the somatomotor body representations as identified by fMRI is illustrated in detail in Figure 7. First along the course of segment 1, moving laterally, is the representation of the quadriceps, followed by the abdominal muscle representation, and in the most medial part of this segment is the sensorimotor representation of the toes (Fig. 7). The wrist representation is located at the point of separation between segments 1 and 2. The sensorimotor representations of the five fingers are situated within segment 2 along a caudodorsal to rostroventral axis with the little finger at the caudodorsal end continuing all the way to the thumb with the most rostroventral representation (Fig. 7).
Figure 7.

Morphological analysis of the central sulcus. (A) Lateral and dorsal view of the three-dimensional reconstruction of the left hemisphere of subject 1 from the anatomical MRI. The five segments of the central sulcus are marked with different colors along the surface of the hemisphere. The sylvian fissure has been marked with a dashed white line. (B) Horizontal (C) Coronal (D) Sagittal sections illustrating the five segments of the cental sulcus and the location of the somatomotor peaks. The rostrocaudal level is indicated within each coronal section and the dorsoventral and mediolateral coordinates in MNI stereotaxic space are provided on the sections. Arrows point to the positions of the functional peaks associated with different body parts.
Along the path of segment 3, at about its midpoint, activity can be elicited by blinking. The activity associated with lip movements is found at the most ventral point of segment 3 (Fig. 7). The submerged gyrus delineating the third from the fourth segment also separates the sensorimotor representation of the tongue from that of the lip, the tongue being located at the most dorsal part of segment 4 (Fig. 7). Although the artistic illustration of the homunculus by Penfield and colleagues suggests that the sensorimotor representation of the chin is found between lips and tongue, other studies in both humans and monkeys localize the facial surface (including neck, chin, and forehead in inverted orientation) dorsal to the representation of the eyes (Foerster 1931; Fulton 1939; Woolsey et al. 1942; Kaas et al. 1979; Servos et al. 1999). The swallowing revealed two separate peaks: The tongue peak described above and one peak in the fifth segment. Activity related to humming was found within the length of the fifth segment (Fig. 7). Supplementary Figure S2 shows the five segments and the location of the main peak for each sensorimotor representation in another example subject in great detail.
These results demonstrate that there is a tight relationship between the morphological features of the central sulcus and the functional localization of various body representations in the sensorimotor cortex along the banks of the central sulcal complex. These results suggest that the great interindividual variability in the localization of sensorimotor body part representations observed by Penfield (Penfield and Boldrey 1937) can largely be explained by the interindividual variability in the spatial location of these segments and variance introduced by the particularities of the shape of the sulcus in different individuals. Once this variability is constrained on the basis of reliable morphological landmarks, the interindividual variability is reduced to a point where localization of the body part representations is possible on the basis of individual sulcal morphology alone (Fig. 5—compare variability to Fig. 1B). The average locations of the sulcal landmarks and peaks after linear registration to MNI space and the average t-values of the peaks are outlined and provided in Figure 8.
Figure 8.

Average location in MNI coordinates of the peaks associated with movements and the crests of the submerged gyri after linear transformation only.
This study has shown that the central sulcus is a complex structure comprising five separate sulcal segments with segments 1 and 2 in the dorsal portion and segments 3, 4, and 5 in the ventral portion. Also, the location of somatomotor body representations in the central sulcus could be reliably defined and a more precise and improved homunculus emerges (Fig. 9A). Figure 9B outlines the remaining interindividual variability from the results provided in Figure 5 (similar to Fig. 1B).
Figure 9.
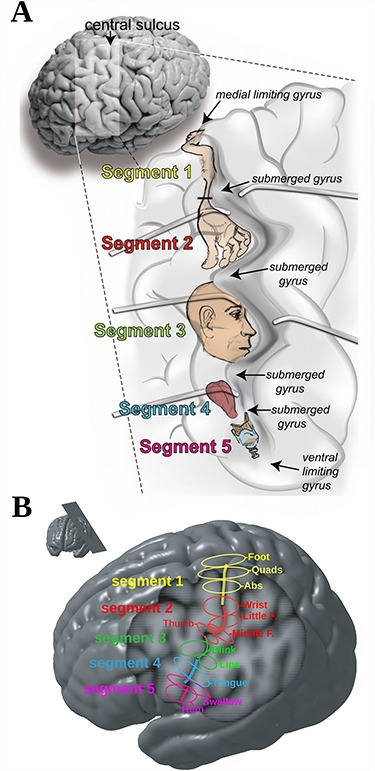
(A) Artist’s rendering of the opened left central sulcus to help appreciate the precise relation between morphology and functional representations. Most dorsally (close to the midline) and most ventrally (close to the Sylvian fissure), the central sulcus is delimited by small limiting gyri resulting in four submerged gyri that reliably divide the central sulcus into five distinct sulcal segments. Each one of these five segments is related to specific parts of the sensorimotor body representation: segment 1, the legs, trunk, and arms; segment 2, the hand representation; segment 3, the neck, head, and face; segment 4, the mouth; segment 5, the throat and larynx. (B) Location and distribution of all somatomotor peaks in relation to the central sulcus. (C) A section taken at an optimal angle (see inset) through the left hemisphere of the MNI 152 average brain showing the five segments of the central sulcus. The superimposed colored ellipses outline the location of the different body representations.
Discussion
The classic electrical stimulation studies and the recent fMRI studies established the approximate dorsal-to-ventral somatotopic arrangement of sensorimotor representations of the various parts of the body along the central sulcus (Grafton et al. 1993; Lotze et al. 2000; Fox et al. 2001; Alkadhi et al. 2002; Fesl 2003; Zeharia et al. 2012; Kolasinski et al. 2016; Tal et al. 2017), as depicted in the classic schematic homunculus of Penfield (Fig. 1A). With the exception of the hand representation (Yousry et al. 1997; Boling et al. 1999), no clear relations between functional body representations and morphological features had previously been established because (1) the details of the morphology of the central sulcal complex had not been examined and (2) the studies had not been explicitly designed to relate morphology to function.
The present study addressed both of these points and was able to establish that distinct morphological features can be reliably identified along the dorsoventral course of the central sulcal complex and that these landmarks are intimately linked to localization of the “central points” of distinct parts of the sensorimotor body representations in each individual. This intimate relationship between function and gross morphology reinforces the importance of individual anatomical analysis coupled with functional analysis (Fischl et al. 2008; Pantazis et al. 2009).
Given the methodological limitations, the remarkably clear functional separation between central points of body part representations when sulcal landmarks are used to coregister brains demonstrates a tight linkage between the location of somatomotor body representations and local sulcal/gyral morphology. Such a tight relationship implies, strongly, the presence of some underlying universal developmental guidance of sulcal morphology and functional specialization. This organizing principle must act, at a very detailed level, on both sulcal development and functional specialization within the cortex.
The theory of protomaps of prospective cytoarchitectonic areas by Rakic (1988) and the developmental theory of the transient subplate zone by Kostovic and Rakic (1990) could explain developmental processes that would lead to a highly organized arrangement of both sulcal morphology and functional differentiation. The influx of thalamocortical fibers—perhaps guided by the subplate zone or protomap—plays an important role in the formation and maintenance of cytoarchitectonic areal differentiation (Dehay et al. 2001; Pallas 2001; O’Leary and Nakagawa 2002; López-Bendito and Molnár 2003), and many theories of cortical folding point to an important role that fibers and axonal tension may play in the formation of sulci (Scannell 1997; Van Essen 1997; Hilgetag and Barbas 2006).
For example, disruption of afferent fibers leads to striking changes in gyrification (Goldman-Rakic 1980; Rakic 1988; Dehay et al. 2001). Furthermore, cortical development and functional differentiation are strongly guided by genetic influences (Piao et al. 2004; Rakic 2004), leading to high heritability of sulcal morphology as demonstrated by twin studies (Biondi et al. 1998; White et al. 2002). Thus, the close relationship between sulcal morphology, functional representation, and cytoarchitectonic differentiation appears to relate to genetic developmental factors, suspected since the early 20th century (Fritsch and Hitzig 1870; Ferrier 1876; Bolton 1900; Brodman 1908; Vogt 1926; Foerster 1931; Smith 1931; Taylor 1931; Penfield and Boldrey 1937; Penfield and Rasmussen 1950).
In conclusion, the present study demonstrates tight coupling between representations of particular body parts to the detailed local sulcal/gyral morphology of the central sulcal region beyond the approximate somatotopic dorsoventral sequence in the classic schematic Penfield homunculus (Fig. 9). Such precision was not possible in the era of Penfield and became possible only now as a result of major developments in structural and functional neuroimaging.
Our results suggest that the dorsal to ventral sequence of body representations follows a genetic blueprint, perhaps on the scale of body parts rather than the scale of muscles that may reflect the targeting of parts of the central cortical region by specific thalamocortical fiber groups during development. The demonstrated tight relationship between somatomotor function and local morphology besides its clinical value (i.e., predicting somatotopy from sulcal morphology) provides an opportunity to examine the genetic factors involved by providing the means of measuring differences and similarities in brain morphology across individuals.
Funding
This work was supported by Canadian Institutes of Health Research funding to M. Petrides.
Notes
We thank Jean-Paul Acco and Emily Rubin-Ferreira for the artistic work in Figures 3, 8, and 9. We thank Emily Lancaster for sulcal segmentation (Rater 2). Conflict of Interest: None declared.
Supplementary Material
References
- Alkadhi H, Crelier GR, Boendermaker SH, Golay X, Hepp-Reymond M-C, Kollias SS. 2002. Reproducibility of primary motor cortex somatotopy under controlled conditions. Am J Neuroradiol. 23:1524–1532. [PMC free article] [PubMed] [Google Scholar]
- Biondi A, Nogueira H, Dormont D, Duyme M, Hasboun D, Zouaoui A, Chantôme M, Marsault C. 1998. Are the brains of monozygotic twins similar? A three-dimensional MR study. Am J Neuroradiol. 19:1361–1367. [PMC free article] [PubMed] [Google Scholar]
- Boling W, Olivier A, Bittar RG, Reutens D. 1999. Localization of hand motor activation in Broca’s pli de passage moyen. Neurosurg Focus. 7:E1. [DOI] [PubMed] [Google Scholar]
- Bolton JS. 1900. The exact histological localisation of the visual area of the human cerebral cortex. Philos Trans R Soc Lond B Biol Sci. 193:165–222. [Google Scholar]
- Borgefors G. 1988. Hierarchical chamfer matching: a parametric edge matching algorithm. IEEE Trans Pattern Anal Mach Intell. 10:849–865. [Google Scholar]
- Broca P. 1889. Mémoires Sur le cerveau de L’homme et des primates. Rev Philos France Let. 27. [Google Scholar]
- Brodman K. 1908. Beiträge zur histologischen Lokalisation der Grosshirnrinde. VI. Die Cortexgliederung des Menschen. J Psychol Neurol. 10:231–246. [Google Scholar]
- Collins DL, Holmes CJ, Peters TM, Evans AC. 1995. Automatic 3-D model-based neuroanatomical segmentation. Hum Brain Mapp. 3:190–208. [Google Scholar]
- Collins DL, Le Goualher G, Evans AC. 1998. Non-linear cerebral registration with sulcal constraints In: Wells WM, Colchester A, Delp S, editors. Medical Image Computing and Computer-Assisted Intervention—MICCAI’98. Lecture Notes in Computer Science. Berlin, Heidelberg: Springer Berlin Heidelberg, pp. 974–984. [Google Scholar]
- Collins DL, Neelin P, Peters TM, Evans AC. 1994. Automatic 3D intersubject registration of MR volumetric data in standardized Talairach space. J Comput Assist Tomogr. 18:192–205. [PubMed] [Google Scholar]
- Cunningham DJ. 1892. Contribution to the surface anatomy of the cerebral hemispheres. Royal Irish Academy. 372. [Google Scholar]
- Dehay C, Savatier P, Cortay V, Kennedy H. 2001. Cell-cycle kinetics of neocortical precursors are influenced by embryonic thalamic axons. J Neurosci. 21:201–214. [DOI] [PMC free article] [PubMed] [Google Scholar]
- Ferrier D. 1876. The Functions of The Brain. London: Smith, Elder & Co. [Google Scholar]
- Fesl G. 2003. Inferior central sulcus: variations of anatomy and function on the example of the motor tongue area. Neuroimage. 20:601–610. [DOI] [PubMed] [Google Scholar]
- Fischl B, Rajendran N, Busa E, Augustinack J, Hinds O, Yeo BTT, Mohlberg H, Amunts K, Zilles K. 2008. Cortical folding patterns and predicting Cytoarchitecture. Cerebral Cortex. 18: 1973–1980. [DOI] [PMC free article] [PubMed] [Google Scholar]
- Foerster O. 1931. The cerebral cortex in man. Lancet. 221:309–312. [Google Scholar]
- Fox PT, Huang A, Parsons LM, Xiong JH, Zamarippa F, Rainey L, Lancaster JL. 2001. Location-probability profiles for the mouth region of human primary motor-sensory cortex: model and validation. Neuroimage. 13:196–209. [DOI] [PubMed] [Google Scholar]
- Frey S, Petrides M. 2000. Orbitofrontal cortex: a key prefrontal region for encoding information. Proc Natl Acad Sci USA. 97:8723–8727. [DOI] [PMC free article] [PubMed] [Google Scholar]
- Fritsch G, Hitzig E. 1870. Ueber die elektrische Erregbarkeit des Grosshirns. Arch Anat Physiolo Wiss Med. 300–332. [Google Scholar]
- Fulton JF. 1939. Physiology of the Nervous System. New York: Oxford University Press. [DOI] [PubMed] [Google Scholar]
- Goldman-Rakic PS. 1980. Morphological consequences of prenatal injury to the primate brain. Prog Brain Res. 53:1–19. [PubMed] [Google Scholar]
- Grafton S, Woods R, Mazziotta J. 1993. Within-arm somatotopy in human motor areas determined by positron emission tomography imaging of cerebral blood flow. Exp Brain Res. 95:172–176. [DOI] [PubMed] [Google Scholar]
- Hilgetag CC, Barbas H. 2006. Role of mechanical factors in the morphology of the primate cerebral cortex. PLoS Comput Biol. 2:146–159. [DOI] [PMC free article] [PubMed] [Google Scholar]
- Kaas JH, Nelson RJ, Sur M, Lin CS, Merzenich MM. 1979. Multiple representations of the body within the primary somatosensory cortex of primates. Science. 204:521–523. [DOI] [PubMed] [Google Scholar]
- Kolasinski J, Makin TR, Jbabdi S, Clare S, Stagg CJ, Johansen-Berg H. 2016. Investigating the stability of fine-grain digit somatotopy in individual human participants. Journal of Neuroscience. 36:1113–1127. [DOI] [PMC free article] [PubMed] [Google Scholar]
- Kostovic I, Rakic P. 1990. Developmental history of the transient subplate zone in the visual and somatosensory cortex of the macaque monkey and human brain. J Comp Neurol. 297:441–470. [DOI] [PubMed] [Google Scholar]
- López-Bendito G, Molnár Z. 2003. Thalamocortical development: how are we going to get there? Nat Rev Neurosci. 4:276–289. [DOI] [PubMed] [Google Scholar]
- Lotze M, Erb M, Flor H, Huelsmann E, Godde B, Grodd W. 2000. fMRI evaluation of somatotopic representation in human primary motor cortex. Neuroimage. 11:473–481. [DOI] [PubMed] [Google Scholar]
- Mazziotta JC, Toga AW, Evans A, Fox P, Lancaster J. 1995. A probabilistic atlas of the human brain: theory and rationale for its development. Neuroimage. (2):89–101. [DOI] [PubMed] [Google Scholar]
- O’Leary DDM, Nakagawa Y. 2002. Patterning centers, regulatory genes and extrinsic mechanisms controlling arealization of the neocortex. Curr Opin Neurobiol. 12:14–25. [DOI] [PubMed] [Google Scholar]
- Ono M, Kubik S, ACD . 1990. Atlas of the Cerebral Sulci. Stuttgart: G. Thieme. [Google Scholar]
- Pallas SL. 2001. Intrinsic and extrinsic factors that shape neocortical specification. Trends Neurosci. 24:417–423. [DOI] [PubMed] [Google Scholar]
- Pantazis D, Joshi A, Jintao J, Shattuck D, Bernstein LE, Damasio H, Leahy RM. 2009. Comparison of landmark-based and automatic methods for cortical surface registration. Neuroimage. 49: 2479–2493. [DOI] [PMC free article] [PubMed] [Google Scholar]
- Penfield W, Boldrey E. 1937. Somatic motor and sensory representation in the cerebral cortex of man as studied by electrical stimulation. Brain. 60:389–443. [Google Scholar]
- Penfield W, Rasmussen T. 1950. The Cerebral Cortex of Man: A Clinical Study of Localization of Function, Lane Medical Lectures. Oxford, England: Macmillan. [Google Scholar]
- Piao X, Hill RS, Bodell A, Chang BS, Basel-Vanagaite L, Straussberg R, Dobyns WB, Qasrawi B, Winter RM, Innes a M, et al. 2004. G protein-coupled receptor-dependent development of human frontal cortex. Science. 303:2033–2036. [DOI] [PubMed] [Google Scholar]
- Rakic P. 1988. Specification of cerebral cortical areas. Science. 241:170–176. [DOI] [PubMed] [Google Scholar]
- Rakic P. 2004. Neuroscience. Genetic control of cortical convolutions. Science. 303:1983–1984. [DOI] [PubMed] [Google Scholar]
- Roux F-E, Djidjeli I, Durand J-B. 2018. Functional architecture of the somatosensory homunculus detected by electrostimulation. J Physiol. 596:941–956. [DOI] [PMC free article] [PubMed] [Google Scholar]
- Scannell JW. 1997. Determining cortical landscapes. Nature. 386:452. [DOI] [PubMed] [Google Scholar]
- Servos P, Engel SA, Gati J, Menon R. 1999. fMRI evidence for an inverted face representation in human somatosensory cortex. Neuroreport. 10:1393–1395. [DOI] [PubMed] [Google Scholar]
- Smith GE. 1931. The central nervous system In: Robinson A, editor. Cunningham’s Textbook of Anatomy. Oxford: Oxford University Press. [Google Scholar]
- Tal Z, Geva R, Amedi A. 2017. Positive and negative somatotopic BOLD responses in contralateral versus ipsilateral Penfield homunculus. Cereb Cortex. 27:962–980. [DOI] [PMC free article] [PubMed] [Google Scholar]
- Taylor J, editor. 1931. The Selected Writings of John Hughlings Jackson. Vol. 1 On Epilepsy and Epileptiform Convulsions London: Hodder and Stoughton. [Google Scholar]
- Tomaiuolo F, Giordano F. 2016. Cerebal sulci and gyri are intrinsic landmarks for brain navigation in individual subjects: an instrument to assist neurosurgeons in preserving cognitive function in brain tumour surgery (Commentary on Zlatkina, et al.). Eur J Neurosci. 43(10):1266–1267. [DOI] [PubMed] [Google Scholar]
- Tomaiuolo F, MacDonald JD, Caramanos Z, Posner G, Chiavaras M, Evans AC, Petrides M. 1999. Morphology, morphometry and probability mapping of the pars opercularis of the inferior frontal gyrus: an in vivo MRI analysis. Eur J Neurosci. 11:3033–3046. [DOI] [PubMed] [Google Scholar]
- Van Essen DC. 1997. A tension-based theory of morphogenesis and compact wiring in the central nervous system. Nature. 385:313–318. [DOI] [PubMed] [Google Scholar]
- Vogt CVO. 1926. Die vergleichend-architektonische und die vergleichend-reizphysiologische Felderung der Großhirnrinde unter besonderer Berücksichtigung der menschlichen. Naturwissenschaften. 14:1190–1194. [Google Scholar]
- White T, Andreasen NC, Nopoulos P. 2002. Brain volumes and surface morphology in monozygotic twins. Cereb Cortex. 12:486–493. [DOI] [PubMed] [Google Scholar]
- Woolsey CN, Marshall WH, Bard P. 1942. Representation of cutaneous tactile sensibility in the cerebral cortex of the monkey as indicated by evoked potentials. Bull Johns Hopkins Hosp. 70:399–441. [Google Scholar]
- Worsley KJ, Liao CH, Aston J, Petre V, Duncan GH, Morales F, Evans a C. 2002. A general statistical analysis for fMRI data. Neuroimage. 15, 15(1). [DOI] [PubMed] [Google Scholar]
- Yousry TA, Schmid UD, Alkadhi H, Schmidt D, Peraud A, Buettner A, Winkler P. 1997. Localization of the motor hand area to a knob on the precentral gyrus. A new landmark. Brain. 120:141–157. [DOI] [PubMed] [Google Scholar]
- Zeharia N, Hertz U, Flash T, Amedi A. 2012. Negative blood oxygenation level dependent homunculus and somatotopic information in primary motor cortex and supplementary motor area. Proceedings of the National Academy of Sciences. 109:18565–18570. [DOI] [PMC free article] [PubMed] [Google Scholar]
- Zlatkina V, Amiez C, Petrides M. 2016. The postcentral sulcal complex and the transverse postcentral sulcus and their relation to sensorimotor functional organization. Eur J Neurosci. 43:1268–1283. [DOI] [PubMed] [Google Scholar]
Associated Data
This section collects any data citations, data availability statements, or supplementary materials included in this article.