

Abstract
Osteosarcoma (OS) is a highly aggressive cancer for which treatment has remained essentially unchanged for over 30 years. OS is characterized by widespread and recurrent somatic copy-number alterations (SCNAs) and structural rearrangements. In contrast, few recurrent point mutations in protein-coding genes have been identified, suggesting that genes within SCNAs are key oncogenic drivers in this disease. SCNAs and structural rearrangements are highly heterogeneous across OS cases, suggesting the need for a genome-informed approach to targeted therapy. To identify patient-specific candidate drivers, we used a simple heuristic based on degree and rank order of copy number amplification (identified by Whole Genome Sequencing) and changes in gene expression as identified by RNAseq. Using patient-derived tumor xenografts, we demonstrate that targeting of patient-specific somatic copy number alterations leads to significant decrease in tumor burden, providing a roadmap for genome-informed treatment of OS.
Keywords: Osteosarcoma, Somatic Copy-Number Alterations, Whole-Genome Sequencing, Targeted therapy, Patient Derived Tumor Xenograft
INTRODUCTION
Osteosarcoma (OS) is the most common form of bone cancer in children and young adults. For patients with metastatic disease at diagnosis or who relapse, the 5-year survival rate is below 30% 1–3. Established treatment regimens consisting of intensive multi-drug therapy and surgical resection have significant short and long-term toxicities and morbidities. A recent multi-national effort to improve outcome in OS by intensifying chemotherapy for high-risk groups failed to demonstrate improved survival 4, underscoring a critical need for new treatment strategies.
OS is characterized by significant somatic copy-number alteration (SCNA) and structural variation (SV) with few recurrent point mutations in protein-coding genes, with the exception of tumor suppressors RB1 and TP53 5–7. This genomic landscape suggests that copy-number amplified genes within SCNAs may be critical drivers of disease progression and maintenance. Indeed, recent analysis of pan-cancer sequencing data suggests that the distinction between “C-class” (copy number driven) vs. “M-class” (mutation driven) cancers may be due to fundamentally different mechanisms of oncogenesis 8. Despite the prevalence of SCNAs in many cancers, efforts to develop targeted therapies and companion biomarkers have focused primarily on point mutations in protein-coding cancer genes. Comparatively less attention has been placed on identifying key tumor-specific vulnerabilities contained within SCNAs as a strategy for genome-informed targeted cancer therapy.
Previous studies have analyzed copy number alterations in an attempt to identify candidate OS driver oncogenes or tumor suppressors 9–15. These studies have focused on the identification of recurrent changes. However, genome-wide sequencing studies highlight the complexity of OS genomes and underscore the likelihood that there are few common alterations across OS samples 5,6. Therefore, a strategy that seeks to identify key vulnerabilities in sub-classes of OS tumors may be more likely to succeed. Whether specific alterations present in SCNAs could harbor significant tumor-specific vulnerabilities is unknown, although prior work has established that copy number changes can identify key vulnerabilities in other cancers 16,17.
A major limitation in advancing genome-informed therapy for OS is the lack of adequate models. Patient-derived tumor xenografts (PDTX) are increasingly utilized as model systems to test novel therapeutic approaches18,19. PDTX models for adult and pediatric cancers have been shown to closely recapitulate the genomic alterations present in the tumor of origin 20,21. To nominate potential therapeutic opportunities for OS, targetable cancer genes with high levels of amplification were identified by analyzing whole-genome sequencing (WGS) data from primary patient tumor samples. For a subset of these samples, PDTX models were also established and a close correlation in SCNAs between the primary tumor and the corresponding PDTX was verified. The therapeutic efficacy of the subclass-specific targets was then tested in the PDTX models. Using this approach, significant responses were seen in all PDTX tested, providing proof-of-principle for a genome-informed strategy to target a cancer that currently lacks adequate therapeutic options.
RESULTS
Identification of Recurrent Copy Number Changes in Targetable Cancer Genes by Whole-Genome Sequencing of OS.
WGS was performed on 30 tumor samples and corresponding germline DNA obtained from 23 patients. Samples were obtained from pre-chemotherapy diagnostic biopsies of primary tumors (n=8), post-chemotherapy resections (n=8) or metastasis (n=14), therefore representing the full spectrum of disease progression (Supplementary Table S1). All samples sequenced were reviewed by a pathologist and confirmed to be osteosarcoma. Regions with >70% tumor were microdissected for DNA isolation and sequencing. Average sequencing depth was 65X for tumors and 34X for germline (Supplementary Table S2). This dataset was expanded by merging with a previously published non-overlapping WGS dataset of 33 samples from 31 patients (28 biopsies, 5 metastasis).6 Consistent with previous reports, these OS genomes where characterized by significant copy number change and multiple structural rearrangements (Fig. 1A). When comparing two samples from the same patient, whole genome copy number profiles were largely consistent (Fig. 1B–C). For all samples, structural variants (SV) and somatic copy-number alterations (SCNAs) were calculated. For samples with a matched germline sample, somatic nucleotide variants (SNVs) were also calculated. Tumor purity was estimated using read-depth density and used to correct copy-number measurements (Supplementary Fig. S1A–D). Purity adjusted copy number values were classified as >4, >8, or >12 copies. 252 genes annotated in public databases as druggable and clinically actionable were selected for further analysis (see methods and Supplementary Fig. S1E–F, and Supplementary Tables S3 and S4). Genes with at least 2 samples indicating SCNA of greater than 8 copies were selected (Fig. 1D and Supplementary Table S4). Among the most commonly amplified genes (by patient) were MYC (39%) and CCNE1 (33%). Recurrent amplifications were also common in RAD21 (38%), VEGFA (23%), AURKB (13%), and CDK4 (11%) and others. Some of these alterations are likely co-occurring as they are in adjacent genomic locations. All but two patients had an amplification in at least one of the actionable genes. Deletions and mutations in a subset of known tumor suppressors were also evaluated with recurrent deletions, SVs and SNVs found in TP53 (74%), RB1 (64%) and PTEN (56%) and others. A landscape of somatic gains and losses across the evaluated osteosarcoma genomes indicates wide spread alterations (Fig. 1E) but suggest that some of the most consistent SCNAs are those in actionable genes. Furthermore, while OS genomes are highly complex, these results suggest the possibility of classifying OS tumors based on the presence of specific SCNA in potential driver genes. Additionally, comparison of the SCNA profile of patients with multiple samples suggests that SCNAs are highly stable between samples from the same patient (Supplementary Fig. S2). While SCNAs were common, non-copy number variations were found less often resulting in low tumor mutational burden (Fig. 1D and Supplementary Table S1). Moderate or high impact SNVs and short indels were only found in 69 of the 252 druggable genes, of which only 20 were found recurrently altered. The most commonly altered genes were TP53 (12), ATRX (7), RB1 (6), and PRKDC (4), with the remaining alterations found in 3 or fewer patients. And while OS tumors show a great deal of structural variation, SVs were only found within 81 of the druggable genes (30 recurrently). The most common genes with a SV were TP53 (29), LRP1B (14), RB1 (8), and FHIT (8). No potentially in-frame gene fusions were detected in more than 2 patients. Taking these observations into account, we then sought to determine whether analysis of SCNAs could have therapeutic relevance.
Figure 1. Genomic analysis of OS and identification of recurrent SCNAs in primary tumors.

A, Circos plot for indicated sample. Copy number gain and losses (outer most circle, red and blue respectively), loss of heterozygosity (intermediate circle) and structural alterations (inner arcs) are shown. B-C, Genome-wide SCNA plot for diagnostic and resection samples from the same patient. D, Analysis of alterations across a cohort of 63 samples from 54 patients in actionable and druggable genes. Copy number (CN) gain was classified as >4 copies, >8 copies, or >12 copies. Actionable genes where at least two patients have gains of >8 copies were included in the upper panel. Selected genes of interest (AKT1 and FOXM1) were also included. Losses for selected tumor suppressor genes (TSG) were calculated and classified as <1.2 copies (minor) or <0.8 copies (major) and included in the lower panel. SV truncations, gene-fusions, and SNVs were calculated and included as indicated. Genes contained in segments with different CN states are annotated as a breakpoint (CNA). Upper bar plot summarizes the CN gain/loss per sample. Right bar plot summarizes the CN gain/loss for a gene. Each column represents a single sample. Numbers to the left indicate percentage of alteration across patients (samples derived from the same patient were aggregated). In the upper panel, only gains were included in the alteration percentages. For tumor suppressors, losses, SV and SNVs were included. Purity estimates for each sample were calculated and all CN gain/losses were adjusted accordingly. The genome-wide tumor mutation burden (TMB) was also calculated for each sample with a matched germline (number of variants across the genome per megabase). Samples collected from the same patient are labelled with the same letter in the “multi-sample” row. E, Combined genome-wide SCNA across all patients in the cohort (samples derived from multiple samples were combined). Percentages are of patients with gains and/or losses in 10kb bins tiled across the genome. Gain/loss calculated and annotated as above. The loci of selected genes of interest are shown.
Generation and Analysis of OS Patient-Derived Tumor Xenografts
The inter-tumor heterogeneity of OS suggests that no single model system will be effective to test the therapeutic potential of specific drugs across all OS. We therefore developed a panel of patient-derived tumor xenografts (PDTX) by directly grafting tumor samples into immunocompromised mice (NSG) with the goal of developing tumor models that reflect the diversity of the human disease. Fifteen PDTX models were established (6 from pre-treatment biopsies, 3 from post-neoadjuvant therapy surgical resections and 6 from metastatic sites (Supplementary Table S5). The histology of these PDTX models resembled the original tumor (Supplementary Fig. S3A). WGS analysis of each PDTX was performed (average 34X sequencing depth; Supplementary Table S6 and Supplementary Fig. S3B–C). 10 PDTX had matching WGS analysis from the corresponding primary tumor and one PDTX had matching WGS from a related primary tumor from the same patient. As with the patients with multiple samples, copy number changes in these PDTX models were highly correlated with those in the corresponding primary tumor and where available, these correlations extend across multiple PDTX passages (Fig. 2A–B, Supplementary Fig. S2 and Supplementary Tables S4 and S7). For the primary tumors and PDTX with available RNAseq data, we compared the expression levels for key amplified genes of interest to the corresponding copy number changes for the same genes using z-scores (Supplementary Tables S8, S9 and Supplementary Fig. S4A). We found a positive correlation in SCNAs and gene expression between the PDTX and their matched primary tumors, confirming that increased copy number for a gene generally results in increased levels of gene expression (Supplementary Fig. S4B). This effect was particularly evident when genes showed extreme gains in copy-number (>12). These results suggest that OS PDTX models reflect the genomic state of their primary tumor and could therefore be used to functionally test patient-specific targets.
Figure 2. Genomic analysis of OS PDTX models and comparison to primary tumors.

A, Scatter plots comparing SCNA changes in representative primary tumor vs. PDTX pairs. CN represented as the normalized log2 ratio between somatic and germline samples. All protein-coding genes shown with actionable and druggable genes in red. B, Correlation matrix of copy-number across primary tumor vs exact matched PDTX pairs (all protein-coding genes). For all samples, the PDTX sample correlated best with the matched primary tumor. C, Genomic alterations across all PDTX samples for recurrent genes shown in Fig. 1B and other gene targets tested in PDTX models. All samples annotated and alterations calculated as in Fig 1B. SCNAs targeted and tested in this study indicated with a white diamond. PDTXs derived from two separate samples from the same patient is indicated in the multi-sample row (letter matched with Fig. 1B). The relationship of the PDTX and the related primary tissue is shown. The companion primary tissue was from the exact tissue used for PDTX generation in all cases but one where a different stage primary tissue was used. In four instances, a comparable primary tissue was unavailable. D, CN for genes tested in this study for PDTX and exact matched primary samples. Additional primary and PDTX passages for selected samples also shown. PDTX samples indicated with (*), PDTX samples from additional passages indicated with (**). E, Schema for proposed treatment subclasses.
To identify potential therapeutic targets in the PDTX models, we focused on SCNAs found in the same list of actionable genes recurrently amplified in primary tumors (Fig. 2C and Supplementary Table S3). In addition to reflecting the SCNA profile of the primary tumors from a whole-genome perspective (Supplementary Fig. S2), PDTXs were also consistent from a locus-specific perspective where gene targets with SCNA present in the primary tumors were maintained in the PDTX (Fig. 2D, Supplementary Fig. S4A,C). The sole exception to this is OS128 where only a related tumor sample (metastasis) was available whereas the PDTX was derived from a resection sample. The PDTX for this patient was noted to have a CDK4 amplification. For any individual cancer, multiple cancer-related genes could show SCNA and are thus potential drivers. We hypothesized that the degree of amplification would be indicative of selective pressure, reflecting its importance for tumor development. By prioritizing gene targets based on the degree of amplification and increases in gene expression, we identified several potentially targetable candidate driver pathways (Fig. 2E) and tested them using the PDTX models. The six candidate driver pathways tested were: MYC gain, CDK4/FOXM1 gain, PTEN loss/AKT gain, AURKB gain, VEGFA gain and CCNE1 gain, covering 93% (14 of 15) PDTX models.
Genome-Informed Targeting of MYC
MYC was amplified in 39% of patients having at least >4 copies of MYC (Fig. 1D) and 3 patients having at least 12 copies of MYC. Two PDTX models with high levels of MYC amplification were identified (Fig. 3A). Both of these PDTX were derived from post-treatment metastatic tumor resections, thus representing aggressive forms of OS and both PDTXs exhibited increased levels of MYC protein compared to PDTX without MYC SCNA (Fig. 3B). Several approaches to targeting MYC driven cancers have been described 22. Two of the most well-studied are inhibition of BRD4 and inhibition of CDK923. While neither approach is entirely specific to MYC, both have been shown in at least some tumors to preferentially affect tumors carrying MYC amplifications 24,25. Treatment of both MYC-amplified PDTX with the CDK inhibitor AT7519 26 resulted in decreased tumor growth (Fig. 3C–H). AT7519 is a multi-CDK inhibitor which targets CDK1, 2, 4, 6 and 9 and has shown tolerability in phase I clinical trials 27,28. Notably, in one PDTX model single AT7519 treatment resulted in 3/8 tumors demonstrating greater than 30% tumor shrinkage (Fig. 3E). Similar results were obtained using two other multi-CDK inhibitors that also target CDK9 29 (Supplementary Fig. S5A).
Figure 3. MYC amplified patient xenografts respond to CDK inhibition.
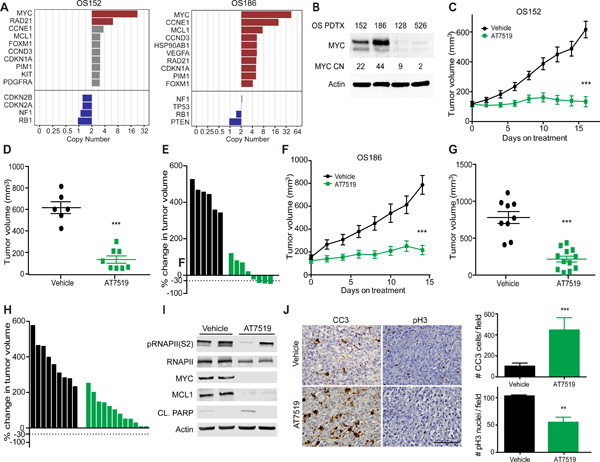
A, Rank ordered list of SCNA identified 2 PDTX with MYC amplification. B, Western blot across PDTX with varying copy number (CN) for MYC. C, Growth curve for MYC amplified PDTX (OS152) treated with AT7519 compared to vehicle control. D, individual tumor volume at last time point in C, p<0.0001. Error bars, SEM. E, Waterfall plot of individual tumors in C. F, MYC amplified PDTX (OS186) treated with AT7519 compared to vehicle control. G, Individual tumor volume at last time point in F, p<0.0001. Error bars, SEM. H, Waterfall plot of individual tumors in F. I, Western blot of short term treated tumors OS152 PDTX, 4 doses of drug and sacrifice 4 hrs. after last. J, Representative IHC and quantitation of OS152 (10X FOV) after short term treatment for CC3 as a measure of apoptosis, p=0.0006 and proliferation at end of study as measured by pH3 and quantitation, p=0.003. Statistics calculated by student’s t test. Error bars, SD. Scale bar represents 100uM.
To determine whether MYC was a potential target of AT7519 in OS, we analyzed protein expression in tumors after short-term treatment. Levels of MYC protein as well as the MYC target MCL1 were significantly reduced (Fig. 3I). AT7519 also decreased phosphorylation of RNAPII (S2), (Fig. 3I and Supplementary Fig. S5B) and increased levels of cleaved PARP (Fig. 3I). Histologic analysis also showed increased cleaved caspase 3 (CC3) staining after short term treatment, indicating that AT7519 induces apoptosis in some OS tumor cells (Fig. 3J). At the end of study, there was a significant reduction in proliferation as marked by pH3 staining in treated tumors (Fig. 3J). Overall, these results indicate that AT7519 results in decrease proliferation and increased apoptosis in MYC - amplified OS. Given prior literature on the mechanism of action of AT7519 and based on our own biochemical studies, we postulate that these results are most likely due to inhibition of MYC via CDK9, although we cannot exclude the possibility of a combined effect on several targets in addition to CDK9.
We then tested whether the BRD4 inhibitor JQ1, which has been shown previously to target some MYC-driven tumors30 would be similarly effective in OS tumors carrying MYC SCNAs. Surprisingly and in contrast to the effect of AT7519, JQ1 had only a marginal effect on tumor growth inhibition in a MYC amplified PDTX (Supplementary Fig. S5C). Furthermore, JQ1 treatment did not cause reductions in MYC or MCL1 levels at the transcript or protein level in vivo (Supplementary Fig. S5D–E). To further assess differences between BRD4 inhibition and CDK inhibition in MYC amplified OS, we used a cell line generated from a PDTX (OS186, see methods). We assessed viability after treatment with two different BRD4 inhibitors and compared this to three CDK inhibitors that have been shown to target CDK9. CDK inhibitors were more effective at decreasing viability compared to BRD4 inhibitors (Supplementary Fig. S5F). We also noted a decrease in pRNAPII (S2) with CDK inhibitor treatment but no decrease after JQ1 or iBET151 treatment. The decrease in pRNAPII (S2) was correlated with a decrease in MYC and canonical target MCL1 (Supplementary Fig. S5G). Notably, apoptosis was also increased after CDK inhibition but not after BRD4 inhibition (Supplementary Fig. S5H). These observations are consistent with previous reports that JQ1 acts independent of MYC inhibition in OS 31.
To assess whether other “non-matched” therapies (i.e., not matched to the SCNA in this PDTX) would also inhibit tumor growth, we treated a MYC amplified PDTX with drugs targeting other pathways and observed no significant reduction in tumor growth with any of these agents (Supplementary Fig. S5C) (see below for summary of all “matched” vs “non-matched” treatments). These results suggest that MYC SCNA analysis could be used to identify a subset of OS patients sensitive to MYC-directed therapy.
Genome-Informed Targeting of Cyclin E (CCNE1)
Cyclin E amplification is common in many cancers and is associated with poor prognosis and chemotherapy resistance 32,33,34. CCNE1 was amplified in 33% of OS patients assessed (Fig. 1D). Five PDTX models also carried CCNE1 amplification and four had overexpression of Cyclin E protein compared to PDTXs without CCNE1 SCNA (Supplementary Fig. S6A–B and Fig. 3A). CDK2 inhibitors have been proposed as targeted therapy for Cyclin E amplified tumors 35,36. The CDK inhibitor Dinaciclib (SCH 727965), which targets CDKs 1, 2, 5 and 9 29 was therefore used to determine the effect of CDK inhibition in the context of CCNE1 amplification in OS. Treatment of three different CCNE1 PDTX models resulted in significant inhibition of tumor growth (Supplementary Fig. S6C–L). This result was confirmed in one PDTX on a subsequent passage (Supplementary Fig. S6F). Analysis after short-term treatment confirmed a modest but statistically significant increase in apoptosis as marked by CC3 staining (Supplementary Fig. S6M). At the end of study, we observed a decrease in proliferation as measured by pH3 staining (Supplementary Fig. S6M). Treatment with two “non-matched” targeted agents (AZD1152 and Palbociclib) led to only limited effects on tumor growth (Supplementary Fig. S6N). Thus, OS tumors SCNAs with CCNE1 amplification may also be susceptible to therapy with multi-CDK inhibitors.
Genome-Informed Targeting of CDK4
CDK4 is a cyclin dependent kinase that regulates cell cycle progression during G1/S and is amplified in a variety of cancers including breast, head and neck and lung37. Palbociclib is a specific inhibitor of CDK4/6 and has been used successfully to treat breast and other cancers 38, 39. CDK4 amplification was observed in 11% of patients, with 5 patients having gains of >12 copies (Fig. 1D). Two PDTXs with CDK4 amplifications were identified by rank order analysis (Fig. 4A) and both demonstrated increased CDK4 gene and protein expression (Fig. 4B). When treated with Palbociclib, both PDTXs exhibited significant growth arrest (Fig. 4C-H). To determine the early effects of drug treatment, tumors were analyzed after short-term treatment and decreases in phospho-RB1, total RB1 and total FOXM1 were observed (Fig. 4I), consistent with on-target effects. Treatment with Palbociclib led to a modest but statistically significant increase in apoptosis after short term treatment as determined by CC3 staining (Fig. 4J). At end of study, pH3 was significantly decreased compared to vehicle, indicating a decrease in proliferation (Fig. 4J). These results suggest that CDK4 inhibitors could be effective as a targeted therapy in OS tumors with CDK4 amplification.
Figure 4. CDK4 and FOXM1 amplified PDTX respond to Palbociclib treatment.

A, Rank order of SCNA gains and losses in PDTX OS156 (left) and OS128 (right). B, Western blot of PDTX with various copy number (CN) for CDK4. C, CDK4 amplified PDTX (OS156) growth curve treated with Palbociclib compared to vehicle. D, Individual tumor volume at end of study in C, p<0.0001. Error bars, SEM. E, Waterfall plot of individual tumors in C. F, PDTX (OS128) growth curve treated with Palbociclib compared to vehicle. G, Individual tumor volume at end of study in F, p=0.0035. Error bars, SEM. H, Waterfall plots of individual tumors in F. I, Western blot of short term treated tumors from OS156 with Palbociclib for 3 days. J, IHC of PDTX OS156 short term treated tumors for CC3 and quantitation (per 10X FOV), p=0.02, and at end of study for pH3 and quantitation (per 10X FOV), p=0.002. Error bars, SD. Scale bar represents 100uM. K, Rank ordered gene list of SCNA gains and losses for PDTX OS107. L, Western blot of PDTX with various copy number (CN) for FOXM1. M, OS107 PDTX growth curve treated with Palbociclib, tumor volume at treatment day 14 p<0.0001. N, Tumor volume at day 14 of treatment in m, p<0.0001. Error bars, SEM. O, Waterfall plot at 14 and 28 days of treatment from M. P, Western blot of PDTX OS107 short term treated tumors with Palbociclib compared to vehicle.
In reviewing the SCNA data, we identified a PDTX with FOXM1 amplification (Fig. 4K). Three primary tumors also had amplification of FOXM1 (Fig. 1D). Forkhead box protein M1 (FOXM1) is involved in cell cycle control and is amplified and overexpressed in several tumor types including basal-type breast cancer and diffuse large B-cell lymphoma40. Additionally, FOXM1 overexpression predicts poor outcome in a variety of cancers41. FOXM1 is phosphorylated by CDK4/6 and this phosphorylation is required for FOXM1 activity and stabilization42. Thus, CDK4/6 inhibitors could be predicted to inhibit FOXM1-amplified tumors in addition to tumors with CDK4 amplification. We confirmed overexpression of FOXM1 in the PDTX with FOXM1 amplification compared to other PDTX by western blot (Fig. 4L). Treatment with Palbociclib resulted in a decrease in tumor volume compared to initiation of drug treatment (Fig. 4M–O). Short term Palbociclib treatment led to decreased levels of pFOXM1 (Thr600), total FOXM1, pRb (807/811) and total Rb (Fig. 4P). Palbociclib caused tumor shrinkage compared to slowed tumor growth or stasis as observed with CDK4 amplified PDTX. We assessed the effect of AT7519 (also targets CDK4/6) and Dinaciclib (low specificity for CDK4/6). Only AT7519 had a similar effect on tumor growth as Palbociclib (Supplementary Fig. S7A), suggesting the importance of specifically targeting CDK4 in these PDTXs. To directly assess the consequence of FOXM1 loss in our PDTX model, we used two shRNAs directed towards FOXM1 (Supplementary Fig. S7B) and implanted spin-infected cells to determine tumor growth in vivo. We observed a significant delay in tumor formation and growth with both shRNAs compared to control (Supplementary Fig. S7C). At end of study, tumors were excised and real-time analysis was preformed, FOXM1 transcript levels were higher at the end of study compared to cells used at the beginning to implant, suggesting that loss of FOXM1 repression by shRNA is required for tumors to grow and indicating an important role of FOXM1 expression in these tumors (Supplementary Fig. S7D).
CDK4 monophosphorylates RB and this interaction is critical for the mechanism of action of CDK4 inhibitors, such that tumors with loss of RB are generally insensitive to CDK4 inhibitors. However, FOXM1 is also directly phosphorylated by CDK442 and thus the effect of CDK4 inhibitors on FOXM1 amplified tumors may be independent of RB status. To test this hypothesis, we knocked-down expression of RB in a FOXM1 amplified PDTX (see methods and Supplementary Fig. S7E–F). As expected, RB knock-down led to an increase tumor growth. (Supplementary Fig. S7G). Palbociclib treatment decreased tumor growth in both shRB and shGFP tumors, suggesting that in the context of FOXM1 amplification, Palbociclib is effective even in the absence of RB, (Supplementary Fig. S7G). In contrast, knock-down of RB in a CDK4 amplified PDTX cell line lead to reduced effect of Palbociclib treatment (Supplementary Fig. S7H–I). These data suggest that the mechanism of Palbociclib response in CDK4 amplified OS PDTX is through the canonical RB inhibition whereas in the context of FOXM1 amplification, wild-type RB1 may not be required for response.
Genome-Informed Targeting of AURKB
Aurora kinase B (AURKB) is part of the chromosomal passenger complex (CPC) and is a key regulator of mitosis43. Prior studies have shown that some OS tumors contain SCNAs involving AURKB 44 or overexpress Aurora kinase B and that treatment with inhibitors can lead to hyperploidy and apoptosis in vitro 45. Of the OS samples in the cohort described above, 13% had a gain of AURKB (Fig. 1D). We observed higher protein levels of AURKB in an amplified PDTX by western and IHC (Fig. 4K and Supplementary Fig. S8A–B). To test whether inhibition of AURKB would be effective for this subclass of OS, we used AZD1152, an Aurora kinase B specific inhibitor 46. Treatment of these PDTX resulted in a significant decrease in growth rate compared to vehicle (Supplementary Fig. S8C–E). Short term AZD1152 treatment was associated with a decrease in phospho-H3 staining, and an increase in apoptosis as measured by CC3 (Supplementary Fig. S8F). Notably, 3 other PDTXs that did not contain SCNAs for AURKB and thus would be “non-matched” to this drug exhibited no difference in growth rate compared to vehicle (Supplementary Figs. S5C, S6N, S8G). These results suggest that AURKB inhibition may be specifically effective in OS tumors with AURKB amplification.
Genome-Informed Targeting of PI3K-AKT-mTOR
Alteration of the PI3K-AKT-mTOR signaling pathway has also been reported in a subset of OS 47. Loss of PTEN was seen in 56% of patients assessed by WGS. AKT1 amplification (>4 copies) was seen in 3 patients (Fig. 1D) and a single >12 copy gain of AKT2 was seen in one patient (data not shown). Taken together PTEN loss or AKT1/2 may represent another targetable subclass of OS. We identified two PDTX models with alterations in this pathway, one with biallelic PTEN loss and one with amplified AKT1 (Fig. 5A). PTEN protein levels were low in one PDTX with PTEN loss and AKT1 protein was high in the PDTX with amplification of AKT1. In addition, western blot analysis indicated high levels of phosphorylation of ribosomal protein S6 in both of these samples, consistent with increased signaling downstream of AKT (Fig. 5B). To target this pathway, we used MK2206, a pan-AKT inhibitor 48. Significant reduction in tumor growth was seen with treatment in both PDTX compared to control vehicle (Fig. 5C–H). Similar results were seen in a subsequent passage of one of these PDTX (Supplementary Fig. S9A–C). Short term treatment with MK2206 revealed a near complete inhibition of pAKT1 (S473) and a decrease in the downstream target pS6RP (Fig. 5I). These early changes were not a result of a decrease in proliferation as levels of PCNA remained similar between treatment and control groups (Fig. 5I). At this time point we observed an increase in apoptosis as marked by CC3 staining (Fig. 5J) while at the end of study, a decrease in proliferation as indicated by pH3 staining (Fig. 5J) was observed. We also tested one PDTX with the mTOR inhibitor Rapamycin and observed a similar decrease in tumor growth compared to vehicle as with MK2206 treatment suggesting that either AKT or mTOR inhibition may be sufficient to target this pathway. (Supplementary Fig. S9D–F).
Figure 5. AKT/PTEN pathway alterations responds to MK2206.

A, Rank ordered SCNA of gains and losses for OS525 (left) and OS052 (right). B, Western blot for PTDX with altered copy number (CN) for PTEN and AKT. C, PTEN loss PDTX (OS052) treated with MK2206. D, Individual tumor volume at last time point in C, p=0.005. Error bars, SEM. E, Waterfall plot of individual tumors in C. F, AKT1 gain PDTX (OS525) treated with MK2206. G, Individual tumor volume at end of study in F, p=0.004. Error bars, SEM. H, Waterfall plots of individual tumors in F. I, Western blot of PDTX OS525 (AKT gain PDTX) short term treatment of MK2206, 2 doses (M,W) and sac 12 hrs after last dose. J, IHC of CC3 short term treatment and quantitation of OS525, (per 10X FOV) p=0.015 and pH3 at end of study and quantitation (10X FOV) p=0.023. Error bars, SD. Scale bar represent 100uM.
To assess whether other targeted agents not directed to AKT or mTOR and therefore not matched to the genome of these tumors would have an effect, we treated one PDTX with either Palbociclib (CDK4/6 inhibitor) or AZD1152 (AURKB inhibitor) and observed no statistically significant decrease in growth compared to vehicle (Supplementary Fig. S8G). These results suggest that SCNA can be used to identify a subset of OS samples susceptible to treatment with AKT or mTOR inhibition.
Genome-Informed Targeting of the VEGF Pathway.
Alterations in VEGFA copy number and possible therapeutic implications in OS have been previously reported49. We observed VEGFA amplifications in 23% of patients (Fig. 1D). However, VEGFA protein across several PDTX with varying copy numbers at this gene were similar. Nevertheless, a striking increase in VEGFR2 protein (also referred to as KDR), which is the main receptor for VEGFA, was observed in one VEGFA amplified PDTX (Supplementary Figs. S6A and S10A). We hypothesize the VEGFR2 may be a better biomarker of VEGFA activation for VEGFA amplified tumors given the secreted nature of the latter and its autocrine signaling mechanism of action 50. Sorafenib is a multikinase inhibitor active against several receptors including VEGFR2, Raf-1 and b-Raf which has been tested in several pediatric malignancies including OS 51–53. We treated VEGFA amplified PDTX with Sorafenib and observed a significant decrease in tumor volume compared to vehicle (Supplementary Fig. S10B–D). This study was repeated on a subsequent passage of the same PDTX and a similar result was confirmed (Supplementary Fig. S10E–G). IHC at the end of study revealed a decrease in VEGFA protein and pERK, an established downstream target of VEGFR2 signaling in OS 54. A significant decrease in proliferation as measured by pH3 was also observed (Supplementary Fig. S10H). Next, we sought to determine the specificity of Sorafenib for VEGFA-amplified PDTX by testing in “non-matched” PDTX. We treated OS128 with Sorafenib and observed no difference in growth between treatment and vehicle (Supplementary Fig. S10I). Together, this data suggests that inhibition of the VEGFA-VEGFR2 pathway could be used as a targeted agent for the subset of OS tumors with VEGFA amplification.
Specificity of Targeted Therapies Based on SCNA
In this study, multiple PDTX models were treated with both “matched” and “non-matched” therapy. Therefore, we sought to develop a general statistical framework to compare the efficacy of therapy targeted specifically to the genomic alterations in individual tumor samples. First, the % tumor growth inhibition index (TGI) was calculated for matched genome informed therapy for each of the 10 PDTX models used and 12 matched therapies tested, taking into account that multiple genome-matched therapies could be indicated and were tested in a single PDTX (Fig. 6A, Supplementary Table S10). For example, CDK inhibitors can target multiple CDKs and thus would be considered matches for several PDTXs. Overall, CDK inhibition for MYC amplified tumors was the most effective therapy with TGIs of 86% to 97% for two different PDTX using three different “matched” drugs. CDK4 inhibition in CDK4 or FOXM1 amplified PDTX was the second most effective targeted therapy with TGIs ranging from 61–111%. We observed a 79% TGI using Sorafenib in one PDTX with VEGFA amplification and a 57% TGI with AZD1152 targeting an AURKB amplification. CDK inhibition by Dinaciclib for CCNE1 amplified PDTX had TGIs from 54% to 94%. Inhibition of AKT-PTEN pathway by AKT inhibitor MK2206 was 61–67% for either PDTX tested (Fig. 6A).
Figure 6. Specificity of targeted therapies based on SCNA.
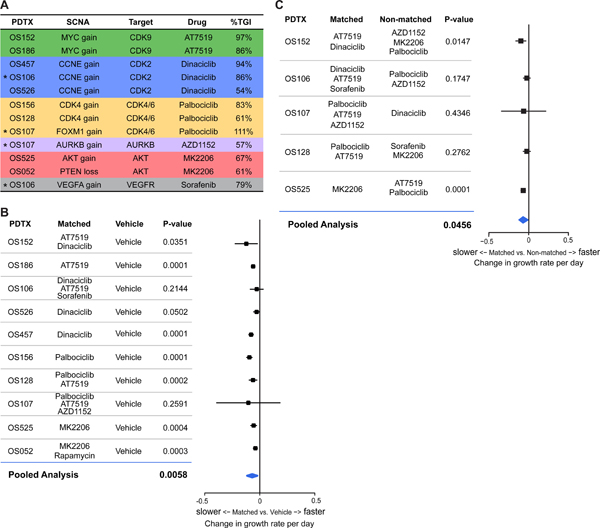
A, Calculations of Tumor Growth Inhibition (%TGI) per PDTX and genome matched targeted therapy tested for 10 PDTX and 12 targeted therapies. *indicate PTDX that have multiple “matched” targeted therapies tested. B, Forest plot of mixed effects model and pooled analysis calculation of growth rate of matched v. vehicle (p=0.0058) of 10 PDTX tested. C, Forest plot of mixed effects model and pooled analysis calculation of growth rate of matched v. non-matched (p=0.0456) of 5 PDTX.
To more rigorously compare the effectiveness of “matched” therapies, we used a meta-analytic framework to compare all the matched therapies across the PDTXs to “non-matched” therapies. As tumors grew approximately linearly over time within each mouse on the log transformed scale, we used a mixed effects model and approximated the per mouse linear tumor growth trajectories allowing different rates of growth per mouse, per drug and per PDTX, pooling the combination of multiple PDTX studies carried out over varying time periods (see Methods). Importantly, the mixed effects model accommodates varying degrees of drug effect comparisons across PDTX, including the possibility that the comparison may be significant in some PDTX models but not in others. First, we analyzed the growth effect of all matched therapies tested compared to vehicle control. Tumors from mice treated with matched drugs, on average grew by 1.052 fold per day (corresponding to rate of growth of 0.0509 per day log scale), whereas tumors grew significantly faster in vehicle treated mice by 1.127 fold per day (corresponding to rate of growth of 0.1194 per day log scale) (p=0.0058) (Fig. 6B and Supplementary Table S11). To evaluate the validity of our SCNA targeted therapies, a similar meta-analysis comparing “matched” vs “non-matched” therapies in the 5 PDTX models that were treated with both was performed. Overall, mice treated with non-matched drugs grew by 1.1144 per day (corresponding to rate of growth of 0.1083 per day log scale), where mice that were treated with matched drugs grew significantly slower at a rate of 1.052 fold per day (corresponding to rate of growth of 0.0514 per day log scale) (p=0.0456). (Fig. 6C and Supplementary Table S11). This daily change corresponds to a decrease in tumor size of 38.09% for the matched group over the course of one week and a decrease of 61.67% over two weeks. Moreover, the growth observed for the non-matched drugs was not significantly slower compared to the vehicle treatment (p=0.6884), underscoring the value of matched targeted therapy in these models.
Taken together, these results indicate that while OS is highly heterogeneous, SCNAs represent a potentially novel avenue to define targeted, patient-specific therapies for this disease. Importantly, no single drug was universally beneficial to all samples, highlighting the importance for matched targeted therapies based on SCNA in the treatment of OS.
DISCUSSION
The last major advance in the treatment of OS was made over 30 years ago with the demonstration of clinical efficacy of a combined regimen including doxorubin, cisplatin and methotrexate 55. Despite intensive efforts, no new therapeutic regimens have been found to improve survival for metastatic patients. In addition, no biomarkers to stratify patients to distinct therapeutic options currently exist. The complex genomic landscape of OS suggests the need to address the heterogeneity of this disease in the design of future clinical trials. We analyzed genomic alterations in copy number across a large cohort of OS samples, combining previously unpublished WGS with a published cohort. By focusing on potentially actionable genes, we were able to reduce the complexity of the genomic landscape of OS to identify alterations most likely to be of direct clinical relevance. Notably, this analysis also highlighted the extreme diversity among OS patients, as most genes were amplified in a subset of cases. Very few patients had no significant SCNA gains in druggable, clinically actionable genes, even though they exhibit the characteristic OS pattern of genome-wide SCNA. However, each patient showed various degrees of loss of at least one canonical tumor suppressor with TP53 being the most commonly altered (74%). Thus, it is likely that several distinct oncogenic drivers are responsible for the aggressive nature of this disease in individual patients and a patient-specific approach to treating OS is therefore likely to be warranted.
To develop models to assess the role of specific drivers within subsets of OS, we assembled a collection of PDTX models and characterized them using WGS and RNAseq. Genomic alterations were found to be relatively stable between primary tumors and their corresponding PDTX, with only small variations between primary tumors and their established PDTXs. The genomic alterations were also found to be highly consistent across multiple passages in the PDTXs and derived cell lines. Together, these results suggest that these PDTX models may serve as faithful pre-clinical models to evaluate patient-specific therapies in OS. However, a much larger collection of PDTX models will be needed to fully capture the full heterogeneity of OS seen in the human disease, justifying continued efforts to generate such models. In one instance where a PDTX had a different SCNA in a targetable gene (CDK4 in OS128), the PDTX was derived from a different tissue (resection) than what was analyzed with WGS (metastasis). This suggests that while in most cases, SCNAs present in the primary tumor are sustained in the PDTX, amplification of different drivers can occur during cancer progression. Using these PDTX models, we tested the potential effectiveness of genome informed “matched” targeted therapies directed at putative driver genes with SCNAs. Taken together, these studies indicate a strong predictive value for presence of an SCNA in a PDTX model and drug response. Indeed, all of the “genome-matched” drugs had greater than or near 60% tumor growth inhibition in vivo, suggesting the potential for a positive effect in patients 56.
The ability to rapidly and inexpensively sequence tumor genomes has raised the possibility of “personalized” approaches for cancer therapy. The primary focus of most efforts has been on targeting of point mutations in key oncogenes. However, many cancers and in particular many pediatric cancers, have a low frequency of recurrent mutations in protein-coding genes 57,58. OS in particular is characterized by significant structural variations but few recurrent point mutations. Thus, we hypothesized that copy number alterations rather than point-mutations may be the dominant oncogenic mechanism. As copy number changes are likely to select for amplicons highly supportive of oncogenesis, we reasoned that ranking copy number changes across the genome would help identify key driver genes in individual samples and prioritize their therapeutic potential. Additionally, using the rank-order of gene targets helps to avoid issues of tumor purity, ploidy, and sub-clonality by selecting the targets most likely to be drivers.
In our studies, we used only single drugs rather than combinations as we wished to identify the target-specific effect of each drug in each PDTX. Nonetheless, it is well established that single agent treatment most often leads to rapid development of resistance and is thus not an effective approach in most cancers. We expect that the next stage to advance genome-informed therapy in OS will be the rational design of combination therapies, potentially with multiple targeted agents or a single targeted agent in concert with cytotoxic chemotherapy. For example, in some of the PDTX used in this study, the same PDTX exhibited amplification of more than one of the targets tested. Combination therapies would therefore be expected to lead to increased response provided this was tolerable in the pre-clinical models and ultimately in patients.
Many preclinical studies have evaluated the role of targeted therapies in OS with variable results. In the majority of cases, these studies have been carried out in established cell lines or cell line xenografts without specific attention to the genomic characteristics of the cell lines being used. While PDTX models of OS have been described 59–62, to our knowledge none have carried out a comprehensive analysis of PDTX models to test genome informed therapy for this disease. A recent report described using a genomic approach similar to that proposed here to identify targeted therapies in OS 63. In two patients evaluated, targeting of genes identified as altered using a DNA panel failed to lead to a clinical response. One difference between the integrative genomic analysis utilized here and this prior study is that we used whole-genome sequencing and matched RNAseq to identify SCNAs containing the most highly amplified genes, thereby potentially selecting the most likely drivers for that tumor. We propose that such a comprehensive approach may be particularly important for genomically complex diseases, such as OS, and may help identify the most significant vulnerabilities for a given patient.
In summary, we report a comprehensive analysis of copy number alterations and their therapeutic relevance for osteosarcoma, the most common bone malignancy in children and young adults and a disease for which traditional approaches to advance therapeutic discovery have been mostly unfruitful in the last 30 years. Our approach provides a blueprint for studies directed at genome-informed therapy and underscores the potential utility of basket trials for this disease.
METHODS
Sample Preparation and Sequencing
Samples.
Written informed consent was obtained from each patient (or from a parent in the case of patients <18 years of age) with recognized guidelines (Belmont Report) and institutional review board approval at each participating institution. All samples analyzed were reviewed by a pathologist at diagnosis and confirmed to be osteosarcoma. Samples were received fresh and a representative sample was reserved for PDTX generation with remaining samples snap frozen for DNA/RNA extraction.
Extraction of nucleic acids.
Snap frozen samples were sectioned and embedded in OCT. Frozen section slides were cut on a cryostat with a section depth of 5um, stained with hematoxylin and eosin. Diagnosis was confirmed and all samples were reevaluated for cellular content and quality by a pathologist (F.K.H. or S.J.C). After visual inspection, samples with > 70% tumor were macrodissected from the OCT block at a depth of up to 5mm for library preparation. Samples were disrupted with a mortar and pestle under liquid nitrogen and homogenized with a QIAshredder (QIAgen, 79654). DNA and RNA were extracted using the AllPrep kit (QIAgen, 80204). Germline DNA (peripheral blood) was extracted using DNeasy Blood and Tissue kit (Qiagen, 69504) according to manufacturer’s instructions. DNA was quantified using the Nanodrop 2000c (Thermo Fisher) and the QuBit High Sensitivity dsDNA assay (Thermo Fisher, Q32851). DNA integrity was quantified using the Genomic DNA Analysis ScreenTape (Agilent, 5067–5365) on the TapeStation 4200 (Agilent). RNA was quantified using Nanodrop 200c (Thermo Fisher) and QuBit High Sensitivity RNA assay (Thermo Fisher, Q32852). RNA was quantified using High Sensitivity RNA ScreenTape (Agilent, 5067–5579) on a TapeStation 4200 (Agilent).
Whole Genome Sequencing.
Libraries were made using the TruSeq Nano kit (Illumina, FC-121–4001) with a 350bp insert per manufacturer’s instructions. Libraries were made using 200ng of input genomic DNA and sequenced to a depth of 30X (germline/PDTX) or an input of 400ng DNA for sequencing depth of 60X (somatic). The majority of samples were sequenced on an Illumina HiSeq system with paired-end 2×150bp reads by Macrogen, Inc. (Rockville MD, USA). A subset of samples were sequenced to a depth of 50X (germline and tumor) on an Illumina HiSeq system with paired-end 2×100bp reads by Illumina, Inc. (San Diego, CA, USA).
Raw DNA FASTQ data were pre-processed using NGSUtils 64 and aligned to the sex-specific GRCh38 reference genomes using bwa-mem 65. PDTX FASTQ data were aligned to both GRCh38 and GRCm38 human and mouse reference genomes separately using the same process. Reads were then classified as either human or mouse based upon the MAPQ and AS alignment scores using NGSUtils. Ambiguous reads with the same score for both organisms were discarded. Post-processing of the alignment data included marking-duplicate reads, in-del realignment and base-quality score recalibration using Picard (http://broadinstitute.github.io/picard) and GATK 66. For samples with a matched germline, somatic variants were called using MuTect2 67. Structural variations were determined using Delly(V0.7.8) 68. SNV and SVs were annotated using VEP 69 and NGSUtils. Only SNVs rated as “moderate” or “high” impact by VEP were used for further analysis.
Purity estimation.
The purity of samples was estimated by examining the density of the log2 ratios across bins. Purity adjusted copy number was then calculated for the range of 20%−100% purity. Each purity level was evaluated to determine the difference between the purity-adjusted copy-number density peaks. The highest purity percentage resulting in a minimal distance between the density peaks to integer values was chosen as the best estimate. Ploidy and sub-clonality were not evaluated.
Copy Number Analysis.
The number of reads aligned to the genome across 10kb bins was determined for somatic and germline samples was determined using NGSUtils and a normalized log2 ratio calculated. For samples without a matched germline, a surrogate sex-matched germline sample was used instead. Bins where the germline counts were outliers (Tukey method) were excluded. Using the log2 ratio, bins were assembled into segments using DNACopy 70. The number of reads within segments was then re-counted and a log2 ratio calculated for each segment. For genes that were not contained in a segment, the read counts across the whole gene region was determined and used. A purity-adjusted copy number was then calculated as: ; where Pref is the reference ploidy, Pexp is the expected ploidy, v is the (normalized) log2 somatic/germline ratio, and p is the estimated purity. Purity adjusted copy number (CN) gain was classified as >4 copies, >8 copies, or >12 copies. Losses for selected tumor suppressor genes (TSG) were calculated and classified as <1.2 copies (minor) or <0.8 copies (major).
Clinically Actionable Genes.
A list of clinically actionable genes was determined by combining the gene lists from different cancer-related gene panels: FoundationOne and FoundationOne Heme (combined, Foundation Medicine, list accessed May 31, 2017), MSK-IMPACT 71, Mi-oncoseq 72, and UCSF 500 cancer gene panel (http://cancer.ucsf.edu/research/molecular-oncology/ucsf500). Genes present in more than one of these panels were included in the “actionable” gene list. Actionable genes that also had a drug interaction listed in the DGIdb database 73 (accessed: June 13, 2018) were included in the actionable/druggable gene list and this gene list was used to identify recurrent SCNA.
RNA Sequencing.
RNAseq libraries were made using the TruSeq Stranded mRNA kit (Illumina, RS-122–2101) with an input of 200ng in accordance with manufacturer’s instructions. All manufacturer controls were used in preparation of the libraries. Libraries were quantified using the High Sensitivity DNA kit (Agilent, 5067–4626) on the BioAnalyzer 2100 (Agilent). Sequencing was performed on an Illumina HiSeq system using chemistry for 2×75bp reads at the Stanford Functional Genomics Facility.
RNAseq FASTQ data were pre-processed using NGSUtils and aligned to the same sex-specific GRCh38 reference genomes as above using STAR 74. As above, PDTX RNAseq data were aligned separately to human and mouse reference genomes and assigned to an organism based on alignment scores. Gene-level counts were obtained using the GENCODE v24 gene annotations 75 and NGSUtils. Gene expression was calculated as log2(CPM+1).
Generation of Patient-Derived Tumor Xenografts
All animal studies were done in accordance with the IACUC Animal care and use program at Stanford University or the University of California San Francisco. Fresh patient samples were cut into 1 X 1mm fragments and either implanted fresh or frozen in 90% FBS, 10% DMSO for later use. Prior to implantation tumor fragments were dipped in matrigel (Corning Matrigel #356234) and implanted in the subrenal capsule of NSG mice (Jackson Laboratory Strain #005557). Tumor growth was monitored for up to one year post-implantation. Successfully implanted tumors were harvested at ~1–2 cm. A fragment was kept for histology and the remainder was digested with collagenase and filtered through 70uM filter. For RNA/DNA isolation, cells were depleted of mouse stroma (Ter119, CD45, CD31, Mouse MHC class I) on a MACS column (Miltyni Biotech), followed by positive selection using Human HLA A,B,C (eBioscience) and sorting on a FACS Aria II. For subsequent passages and drug studies, cells were implanted subQ in flanks of NSG mice (5 X 10^5 cells per flank) in 30ul alpha MEM and 20uL matrigel (Corning).
Generation of Patient-Derived Tumor Xenografts Cell lines
After successful generation of PDTX we generated a single cell suspension and removed mouse stroma as above by depletion on a MACS column. We plated cells using standard DMEM media supplemented with 10% FBS and 1% PSG. Cells were allowed to expand and sorted for human HLA positive to enrich for human OS tumor cells, this was performed twice to generate a pure population. Cell lines were submitted for karyotyping to confirm they were derived from OS. We submitted OS PDTX cell lines for low pass WGS to confirm that the cell lines were derived from the patient and corresponding PDTX as listed.
Treatment of Mice with Targeted Compounds
When tumor cohorts of mice reached an average size of 100mm3 per tumor, mice were stratified into treatment arms based on average tumor size per group. Mice were then dosed with drug or vehicle for two to three weeks. Mice were weighed at the beginning of study and periodically throughout drug treatment. Tumor volume was measured with digital calipers 3–4 times per week using the formula (length x width x width)/2 in mm2. Statistical significance at the end of study was calculated using a two-tailed, unpaired t-test using Prism 6 software. MK2206 (Selleckchem) 120mg/kg MWF, PO in 30% captisol, Rapamycin (Selleckchem) 4 mg/kg daily IP, Palbociclib (Pfizer CTP) 100mg/kg daily PO in 50mM sodium lactate buffer, AT7519 (Selleckchem) 15mg/kg daily IP, Flavopiridol (Sellekchem) 7.5 mg daily IP, AZD1152 (Sellekchem) 25mg/kg 4 consecutive days per week IP, Dinaciclib (Sellekchem) 30mg/kg daily IP, JQ1 (gift of Dr. James Bradner) 50mg/kg daily IP, Sorafenib (Selleckchem) 60mg/kg 6 days per week OP. All drugs delivered IP were dissolved in DMSO and dosed with 10% B-hydroxycyclodextran (Sigma) unless otherwise stated.
Knock-down Studies in PDTX
pLKO shRNA constructs were purchased from Thermo. Lentivirus for each construct was generated by transfecting 293 cells (Invitrogen) with Lipofectamine (Invitrogen), viral supernatants were collect on day 2 and 3 after transfection, pooled and stored at −80C until use. Viral supernatants were then thawed and filtered through 0.45uM PES filters and concentrated by ultracentrifugation for 2 hrs. at 24000 rpm at 4C. Viral pellets were re-suspended on a platform rocker for 2 hrs with ~500uL fresh media. Cells were dissociated into a single cell suspension using Collagenase digestion buffer and filtered through a 70uM filter and depleted for lineage (as above) on a MACS column. The resulting cell suspension was then plated at approximately 5 million cells per well of a 6-well plate and spin infected with polybrene and virus in media at 1500 rpm at room temperature for 30 min (Sorvall XRT centrifuge) and placed in the incubator. Media was changed the following day and 48 hrs after infection, puromycin (Invitrogen) was added (2ug/mL) for 48 hrs. After selection, the cells were gently trypsinized, filtered and counted for viable cells. Cells were then implanted (as above) keeping the cell numbers consistent between study groups. Remaining cells were kept for confirmation of gene knockdown.
Western Blotting and Immunohistochemistry
Xenograft tumor fragments were stored at −80C until use for western or fixed in formalin and embedded in paraffin for histology. Frozen tumors were thawed and mechanically disrupted using a 1.5mL tube plastic homogenizer on ice and RIPA buffer. Protein quantitation was determined by BCA assay (ThermoFisher) and run on Biorad 4–15% gradient gels transferred to PVDF. Westerns were preformed using Licor Odessey system and Licor blocking buffer or Biorad Chemi Doc touch using Licor blocking for primary antibodies and 5%NFMP for secondaries in TBST. Primary antibodies for westerns and IHC: FOXM1, total RB, pRB (807/811), PTEN, total AKT, pAKT(S473), Cleaved PARP, Cyclin E, CC3 and pH3 (Cell signaling techonology), cMyc, MCL1, AURKB (Abcam). RNAPII and RNAPII (S2) (Bethyl Labs). PCNA (SCBT and Cell Signaling). B-actin (Sigma). For both western and IHC analysis, short term drug treatment consisted of 3–4 days of treatment, mice were sacrificed 4 hrs after last dose. MK2206 mice were treated M/W, sacrificed 12 hrs after last dose. Western quantitation was determined using Licor secondary antibodies and Image J quantitation software. For long term drug treatment for pH3 staining, mice were sacrificed 24 to 48 hrs after last dose. CC3 and pH3 IHC staining were performed on two tumor specimens per PDTX treatment condition. Representative 10X field of view (FOV) were imaged, avoiding areas of necrosis and low cellularity. 5–8 FOV were analyzed per condition. Data are displayed as mean per 10X FOV, error bars are S.D. All quantitation was done in a blinded fashion.
Statistical Analysis of PDTX Cohorts
With linear growth trajectories well approximating within mouse tumor growth on the log-transformed scale, we log-transformed the tumor volume data and used a linear mixed effects model to compare rates of growth of different treatment drugs. The per PDTX analysis included random intercepts and random slopes to account for the within mouse correlation among the longitudinal tumor volume measurements and differential rates of growth per mouse respectively. In contrast to the per PDTX analysis where different drug effects within each PDTX were included as fixed slope effects, the pooled mixed effects analysis included random per drug, per PDTX slopes to accommodate varying degrees of drug effects within PDTXs and differential rates of growth per PDTX. The additionally included random slopes allowed the possibility that the comparison of “matched” vs “non-matched” drugs may be significant in some PDTX models but not in others. All computation was conducted using SAS 9.3.
Supplementary Material
SIGNIFICANCE.
Osteosarcoma is treated with a chemotherapy regimen established 30 years ago. While genomically complex, we hypothesized that tumor-specific dependencies could be identified within somatic copy number alterations. Using patient-derived tumor xenografts we found a high degree of response for “genome matched” therapies, demonstrating the utility of a targeted genome-informed approach.
Acknowledgments
This work was funded in part with funds provided by the the Lucile Packard Children’s Hospital (LPCH) of Stanford University. We wish to especially thank the leadership of LPCH (Chris Dawes) and the Department of Pediatrics (Hugh O’Brodovich) for their generous support of the Stanford Pediatric Cancer Genomics Initiative. Further support for this effort was provided by generous funds provided by the Helen Diller Comprehensive Cancer Center and Dr. Alan Ashworth. We thank all members of the Sweet-Cordero lab for helpful discussion. We thank also Dr. Julien Sage (Stanford University) and Dr. Erin Breese (Cincinnati Children’s Hospital Department of Pediatrics) for thoughtful discussion regarding experimental and study design. We thank also the Stanford Tissue Bank and UCSF tissue bank for help in collecting patient samples. Most importantly, we would like to express the deepest appreciation to all the patients and their families who generously donated tissue for this research.
Grant Support
This work used resources from the Stanford Genetics Bioinformatics Service Center and the Stanford Functional Genomics Facility including support from an NIH S10 Shared Instrumentation Grant (S10OD018220). E. A. S. C was supported by a Morgridge Scholar Grant and by the Children’s Health Research Institute (Stanford). Funding was also provided to E.A.S.C by the Hyundai Hope on Wheels Foundation, the St. Baldrick’s Team Clarkie Award, the CureSearch Foundation and the Sarcoma Foundation of America. This study was funded in part by HDFCCC Laboratory for Cell Analysis Shared Resource Facility through a grant from NIH (P30CA082103). A.L.K. was funded by training grant 2T32OD011121-11 from the National Institute of Health. K.S. was funded by training award R25 CA180993-02 from the National Institutes of Health (Cancer Systems Biology Scholars Program, Stanford University).
Footnotes
The authors declare no potential conflicts of interest.
Accession Codes
Whole genome and RNA sequence data that support the findings of this study have been deposited in European Genome-phenome Archive (EGA) (EGAS00001003201 - Whole genome and RNAseq analysis of pediatric osteosarcoma). Previously published whole genome sequences that support the findings in this study are available from the EGA (EGAD00001000159, EGAD00001001053, doi:10.1016/j.celrep.2014.03.003).
REFERENCES
- 1.Mirabello L, Troisi RJ & Savage SA International osteosarcoma incidence patterns in children and adolescents, middle ages and elderly persons. Int J Cancer 125, 229–234, doi: 10.1002/ijc.24320 (2009). [DOI] [PMC free article] [PubMed] [Google Scholar]
- 2.Meyers PA et al. Osteogenic sarcoma with clinically detectable metastasis at initial presentation. J Clin Oncol 11, 449–453, doi: 10.1200/JCO.1993.11.3.449 (1993). [DOI] [PubMed] [Google Scholar]
- 3.Kager L. et al. Primary metastatic osteosarcoma: presentation and outcome of patients treated on neoadjuvant Cooperative Osteosarcoma Study Group protocols. J Clin Oncol 21, 2011–2018, doi: 10.1200/JCO.2003.08.132 (2003). [DOI] [PubMed] [Google Scholar]
- 4.Marina NM et al. Comparison of MAPIE versus MAP in patients with a poor response to preoperative chemotherapy for newly diagnosed high-grade osteosarcoma (EURAMOS-1): an open-label, international, randomised controlled trial. Lancet Oncol 17, 1396–1408, doi: 10.1016/S1470-2045(16)30214-5 (2016). [DOI] [PMC free article] [PubMed] [Google Scholar]
- 5.Behjati S. et al. Recurrent mutation of IGF signalling genes and distinct patterns of genomic rearrangement in osteosarcoma. Nat Commun 8, 15936, doi: 10.1038/ncomms15936 (2017). [DOI] [PMC free article] [PubMed] [Google Scholar]
- 6.Chen X. et al. Recurrent somatic structural variations contribute to tumorigenesis in pediatric osteosarcoma. Cell reports 7, 104–112, doi: 10.1016/j.celrep.2014.03.003 (2014). [DOI] [PMC free article] [PubMed] [Google Scholar]
- 7.Perry JA et al. Complementary genomic approaches highlight the PI3K/mTOR pathway as a common vulnerability in osteosarcoma. Proc Natl Acad Sci U S A 111, E5564–5573, doi: 10.1073/pnas.1419260111 (2014). [DOI] [PMC free article] [PubMed] [Google Scholar]
- 8.Ciriello G. et al. Emerging landscape of oncogenic signatures across human cancers. Nature genetics 45, 1127–1133, doi: 10.1038/ng.2762 (2013). [DOI] [PMC free article] [PubMed] [Google Scholar]
- 9.Yen CC et al. Identification of chromosomal aberrations associated with disease progression and a novel 3q13.31 deletion involving LSAMP gene in osteosarcoma. Int J Oncol 35, 775–788 (2009). [DOI] [PubMed] [Google Scholar]
- 10.Tarkkanen M. et al. DNA sequence copy number increase at 8q: a potential new prognostic marker in high-grade osteosarcoma. Int J Cancer 84, 114–121 (1999). [DOI] [PubMed] [Google Scholar]
- 11.Pasic I. et al. Recurrent focal copy-number changes and loss of heterozygosity implicate two noncoding RNAs and one tumor suppressor gene at chromosome 3q13.31 in osteosarcoma. Cancer Res 70, 160–171, doi: 10.1158/0008-5472.CAN-09-1902 (2010). [DOI] [PubMed] [Google Scholar]
- 12.Kuijjer ML et al. Identification of osteosarcoma driver genes by integrative analysis of copy number and gene expression data. Genes Chromosomes Cancer 51, 696–706, doi: 10.1002/gcc.21956 (2012). [DOI] [PubMed] [Google Scholar]
- 13.Freeman SS et al. Copy number gains in EGFR and copy number losses in PTEN are common events in osteosarcoma tumors. Cancer 113, 1453–1461, doi: 10.1002/cncr.23782 (2008). [DOI] [PMC free article] [PubMed] [Google Scholar]
- 14.Du X, Yang J, Yang D, Tian W. & Zhu Z. The genetic basis for inactivation of Wnt pathway in human osteosarcoma. BMC Cancer 14, 450, doi: 10.1186/1471-2407-14-450 (2014). [DOI] [PMC free article] [PubMed] [Google Scholar]
- 15.Both J. et al. Focal chromosomal copy number aberrations identify CMTM8 and GPR177 as new candidate driver genes in osteosarcoma. PLoS ONE 9, e115835, doi: 10.1371/journal.pone.0115835 (2014). [DOI] [PMC free article] [PubMed] [Google Scholar]
- 16.Guagnano V. et al. FGFR genetic alterations predict for sensitivity to NVP-BGJ398, a selective pan-FGFR inhibitor. Cancer Discov 2, 1118–1133, doi: 10.1158/2159-8290.CD-12-0210 (2012). [DOI] [PubMed] [Google Scholar]
- 17.Jorge SE et al. Responses to the multitargeted MET/ALK/ROS1 inhibitor crizotinib and co-occurring mutations in lung adenocarcinomas with MET amplification or MET exon 14 skipping mutation. Lung Cancer 90, 369–374, doi: 10.1016/j.lungcan.2015.10.028 (2015). [DOI] [PMC free article] [PubMed] [Google Scholar]
- 18.Siolas D. & Hannon GJ Patient-derived tumor xenografts: transforming clinical samples into mouse models. Cancer Res 73, 5315–5319, doi: 10.1158/0008-5472.CAN-13-1069 (2013). [DOI] [PMC free article] [PubMed] [Google Scholar]
- 19.Bertotti A. et al. A molecularly annotated platform of patient-derived xenografts (“xenopatients”) identifies HER2 as an effective therapeutic target in cetuximab-resistant colorectal cancer. Cancer Discov 1, 508–523, doi: 10.1158/2159-8290.CD-11-0109 (2011). [DOI] [PubMed] [Google Scholar]
- 20.Bruna A. et al. A Biobank of Breast Cancer Explants with Preserved Intra-tumor Heterogeneity to Screen Anticancer Compounds. Cell, doi: 10.1016/j.cell.2016.08.041 (2016). [DOI] [PMC free article] [PubMed] [Google Scholar]
- 21.Stewart E. et al. Orthotopic patient-derived xenografts of paediatric solid tumours. Nature, doi: 10.1038/nature23647 (2017). [DOI] [PMC free article] [PubMed] [Google Scholar]
- 22.Posternak V. & Cole MD Strategically targeting MYC in cancer. F1000Res 5, doi: 10.12688/f1000research.7879.1 (2016). [DOI] [PMC free article] [PubMed] [Google Scholar]
- 23.Filippakopoulos P. et al. Selective inhibition of BET bromodomains. Nature 468, 1067–1073, doi: 10.1038/nature09504 (2010). [DOI] [PMC free article] [PubMed] [Google Scholar]
- 24.Rahl PB et al. c-Myc regulates transcriptional pause release. Cell 141, 432–445, doi: 10.1016/j.cell.2010.03.030 (2010). [DOI] [PMC free article] [PubMed] [Google Scholar]
- 25.Huang CH et al. CDK9-mediated transcription elongation is required for MYC addiction in hepatocellular carcinoma. Genes Dev 28, 1800–1814, doi: 10.1101/gad.244368.114 (2014). [DOI] [PMC free article] [PubMed] [Google Scholar]
- 26.Santo L. et al. AT7519, A novel small molecule multi-cyclin-dependent kinase inhibitor, induces apoptosis in multiple myeloma via GSK-3beta activation and RNA polymerase II inhibition. Oncogene 29, 2325–2336, doi: 10.1038/onc.2009.510 (2010). [DOI] [PMC free article] [PubMed] [Google Scholar]
- 27.Chen EX et al. A Phase I study of cyclin-dependent kinase inhibitor, AT7519, in patients with advanced cancer: NCIC Clinical Trials Group IND 177. Br J Cancer 111, 2262–2267, doi: 10.1038/bjc.2014.565 (2014). [DOI] [PMC free article] [PubMed] [Google Scholar]
- 28.Dolman ME et al. Cyclin-Dependent Kinase Inhibitor AT7519 as a Potential Drug for MYCN-Dependent Neuroblastoma. Clin Cancer Res 21, 5100–5109, doi: 10.1158/1078-0432.CCR-15-0313 (2015). [DOI] [PMC free article] [PubMed] [Google Scholar]
- 29.Fu W. et al. The cyclin-dependent kinase inhibitor SCH 727965 (dinacliclib) induces the apoptosis of osteosarcoma cells. Mol Cancer Ther 10, 1018–1027, doi: 10.1158/1535-7163.MCT-11-0167 (2011). [DOI] [PMC free article] [PubMed] [Google Scholar]
- 30.Fowler T. et al. Regulation of MYC expression and differential JQ1 sensitivity in cancer cells. PLoS One 9, e87003, doi: 10.1371/journal.pone.0087003 (2014). [DOI] [PMC free article] [PubMed] [Google Scholar]
- 31.Baker EK et al. BET inhibitors induce apoptosis through a MYC independent mechanism and synergise with CDK inhibitors to kill osteosarcoma cells. Sci Rep 5, 10120, doi: 10.1038/srep10120 (2015). [DOI] [PMC free article] [PubMed] [Google Scholar]
- 32.Patch AM et al. Whole-genome characterization of chemoresistant ovarian cancer. Nature 521, 489–494, doi: 10.1038/nature14410 (2015). [DOI] [PubMed] [Google Scholar]
- 33.Scaltriti M. et al. Cyclin E amplification/overexpression is a mechanism of trastuzumab resistance in HER2+ breast cancer patients. Proc Natl Acad Sci U S A 108, 3761–3766, doi: 10.1073/pnas.1014835108 (2011). [DOI] [PMC free article] [PubMed] [Google Scholar]
- 34.Lockwood WW et al. Cyclin E1 is amplified and overexpressed in osteosarcoma. J Mol Diagn 13, 289–296, doi: 10.1016/j.jmoldx.2010.11.020 (2011). [DOI] [PMC free article] [PubMed] [Google Scholar]
- 35.Yang L. et al. Cyclin-dependent kinase 2 is an ideal target for ovary tumors with elevated cyclin E1 expression. Oncotarget 6, 20801–20812, doi: 10.18632/oncotarget.4600 (2015). [DOI] [PMC free article] [PubMed] [Google Scholar]
- 36.Au-Yeung G. et al. Selective Targeting of Cyclin E1-Amplified High-Grade Serous Ovarian Cancer by Cyclin-Dependent Kinase 2 and AKT Inhibition. Clin Cancer Res 23, 1862–1874, doi: 10.1158/1078-0432.CCR-16-0620 (2017). [DOI] [PMC free article] [PubMed] [Google Scholar]
- 37.Hamilton E. & Infante JR Targeting CDK4/6 in patients with cancer. Cancer Treat Rev 45, 129–138, doi: 10.1016/j.ctrv.2016.03.002 (2016). [DOI] [PubMed] [Google Scholar]
- 38.DeMichele A. et al. CDK 4/6 Inhibitor Palbociclib (PD0332991) in Rb+ Advanced Breast Cancer: Phase II Activity, Safety and Predictive Biomarker Assessment. Clinical cancer research : an official journal of the American Association for Cancer Research, doi: 10.1158/1078-0432.CCR-14-2258 (2014). [DOI] [PubMed] [Google Scholar]
- 39.Dickson MA et al. Progression-Free Survival Among Patients With Well-Differentiated or Dedifferentiated Liposarcoma Treated With CDK4 Inhibitor Palbociclib: A Phase 2 Clinical Trial. JAMA Oncol 2, 937–940, doi: 10.1001/jamaoncol.2016.0264 (2016). [DOI] [PMC free article] [PubMed] [Google Scholar]
- 40.Katoh M, Igarashi M, Fukuda H, Nakagama H. & Katoh M. Cancer genetics and genomics of human FOX family genes. Cancer letters 328, 198–206, doi: 10.1016/j.canlet.2012.09.017 (2013). [DOI] [PubMed] [Google Scholar]
- 41.Zhao F. et al. Overexpression of forkhead box protein M1 (FOXM1) in ovarian cancer correlates with poor patient survival and contributes to paclitaxel resistance. PLoS ONE 9, e113478, doi: 10.1371/journal.pone.0113478 (2014). [DOI] [PMC free article] [PubMed] [Google Scholar]
- 42.Anders L. et al. A systematic screen for CDK4/6 substrates links FOXM1 phosphorylation to senescence suppression in cancer cells. Cancer Cell 20, 620–634, doi: 10.1016/j.ccr.2011.10.001 (2011). [DOI] [PMC free article] [PubMed] [Google Scholar]
- 43.Carmena M, Wheelock M, Funabiki H. & Earnshaw WC The chromosomal passenger complex (CPC): from easy rider to the godfather of mitosis. Nat Rev Mol Cell Biol 13, 789–803, doi: 10.1038/nrm3474 (2012). [DOI] [PMC free article] [PubMed] [Google Scholar]
- 44.Bayani J. et al. Spectral karyotyping identifies recurrent complex rearrangements of chromosomes 8, 17, and 20 in osteosarcomas. Genes Chromosomes Cancer 36, 7–16, doi: 10.1002/gcc.10132 (2003). [DOI] [PubMed] [Google Scholar]
- 45.Tavanti E. et al. Preclinical validation of Aurora kinases-targeting drugs in osteosarcoma. Br J Cancer 109, 2607–2618, doi: 10.1038/bjc.2013.643 (2013). [DOI] [PMC free article] [PubMed] [Google Scholar]
- 46.Wilkinson RW et al. AZD1152, a selective inhibitor of Aurora B kinase, inhibits human tumor xenograft growth by inducing apoptosis. Clin Cancer Res 13, 3682–3688, doi: 10.1158/1078-0432.CCR-06-2979 (2007). [DOI] [PubMed] [Google Scholar]
- 47.Bishop MW & Janeway KA Emerging concepts for PI3K/mTOR inhibition as a potential treatment for osteosarcoma. F1000Res 5, doi: 10.12688/f1000research.8228.1 (2016). [DOI] [PMC free article] [PubMed] [Google Scholar]
- 48.Hirai H. et al. MK-2206, an allosteric Akt inhibitor, enhances antitumor efficacy by standard chemotherapeutic agents or molecular targeted drugs in vitro and in vivo. Mol Cancer Ther 9, 1956–1967, doi: 10.1158/1535-7163.MCT-09-1012 (2010). [DOI] [PubMed] [Google Scholar]
- 49.Yang J. et al. Genetic amplification of the vascular endothelial growth factor (VEGF) pathway genes, including VEGFA, in human osteosarcoma. Cancer 117, 4925–4938, doi: 10.1002/cncr.26116 (2011). [DOI] [PMC free article] [PubMed] [Google Scholar]
- 50.Goel HL & Mercurio AM VEGF targets the tumour cell. Nat Rev Cancer 13, 871–882, doi: 10.1038/nrc3627 (2013). [DOI] [PMC free article] [PubMed] [Google Scholar]
- 51.Coventon J. A review of the mechanism of action and clinical applications of sorafenib in advanced osteosarcoma. J Bone Oncol 8, 4–7, doi: 10.1016/j.jbo.2017.07.001 (2017). [DOI] [PMC free article] [PubMed] [Google Scholar]
- 52.Kim A. et al. Phase 2 trial of sorafenib in children and young adults with refractory solid tumors: A report from the Children’s Oncology Group. Pediatr Blood Cancer 62, 1562–1566, doi: 10.1002/pbc.25548 (2015). [DOI] [PMC free article] [PubMed] [Google Scholar]
- 53.Reed DR et al. Pediatric phase I trial of oral sorafenib and topotecan in refractory or recurrent pediatric solid malignancies. Cancer Med 5, 294–303, doi: 10.1002/cam4.598 (2016). [DOI] [PMC free article] [PubMed] [Google Scholar]
- 54.Pignochino Y. et al. Sorafenib blocks tumour growth, angiogenesis and metastatic potential in preclinical models of osteosarcoma through a mechanism potentially involving the inhibition of ERK1/2, MCL-1 and ezrin pathways. Mol Cancer 8, 118, doi: 10.1186/1476-4598-8-118 (2009). [DOI] [PMC free article] [PubMed] [Google Scholar]
- 55.Link MP et al. The effect of adjuvant chemotherapy on relapse-free survival in patients with osteosarcoma of the extremity. N Engl J Med 314, 1600–1606, doi: 10.1056/NEJM198606193142502 (1986). [DOI] [PubMed] [Google Scholar]
- 56.Wong H. et al. Antitumor activity of targeted and cytotoxic agents in murine subcutaneous tumor models correlates with clinical response. Clin Cancer Res 18, 3846–3855, doi: 10.1158/1078-0432.CCR-12-0738 (2012). [DOI] [PubMed] [Google Scholar]
- 57.Grobner SN et al. The landscape of genomic alterations across childhood cancers. Nature 555, 321–327, doi: 10.1038/nature25480 (2018). [DOI] [PubMed] [Google Scholar]
- 58.Ma X. et al. Pan-cancer genome and transcriptome analyses of 1,699 paediatric leukaemias and solid tumours. Nature 555, 371–376, doi: 10.1038/nature25795 (2018). [DOI] [PMC free article] [PubMed] [Google Scholar]
- 59.Goldstein SD, Hayashi M, Albert CM, Jackson KW & Loeb DM An orthotopic xenograft model with survival hindlimb amputation allows investigation of the effect of tumor microenvironment on sarcoma metastasis. Clin Exp Metastasis 32, 703–715, doi: 10.1007/s10585-015-9738-x (2015). [DOI] [PubMed] [Google Scholar]
- 60.Blattmann C. et al. Establishment of a patient-derived orthotopic osteosarcoma mouse model. Journal of translational medicine 13, 136, doi: 10.1186/s12967-015-0497-x (2015). [DOI] [PMC free article] [PubMed] [Google Scholar]
- 61.Stebbing J. et al. Patient-derived xenografts for individualized care in advanced sarcoma. Cancer 120, 2006–2015, doi: 10.1002/cncr.28696 (2014). [DOI] [PMC free article] [PubMed] [Google Scholar]
- 62.Guilhamon P. et al. Assessment of patient-derived tumour xenografts (PDXs) as a discovery tool for cancer epigenomics. Genome Med 6, 116, doi: 10.1186/s13073-014-0116-0 (2014). [DOI] [PMC free article] [PubMed] [Google Scholar]
- 63.Subbiah V. et al. Personalized comprehensive molecular profiling of high risk osteosarcoma: Implications and limitations for precision medicine. Oncotarget 6, 40642–40654, doi: 10.18632/oncotarget.5841 (2015). [DOI] [PMC free article] [PubMed] [Google Scholar]
- 64.Breese MR & Liu Y. NGSUtils: a software suite for analyzing and manipulating next-generation sequencing datasets. Bioinformatics (Oxford, England) 29, 494–496, doi: 10.1093/bioinformatics/bts731 (2013). [DOI] [PMC free article] [PubMed] [Google Scholar]
- 65.Li H. Aligning sequence reads, clone sequences and assembly contigs with BWA-MEM. arXiv:1303.3997 [q-bio] (2013). [Google Scholar]
- 66.McKenna A. et al. The Genome Analysis Toolkit: A MapReduce framework for analyzing next-generation DNA sequencing data. Genome Research 20, 1297–1303, doi: 10.1101/gr.107524.110 (2010). [DOI] [PMC free article] [PubMed] [Google Scholar]
- 67.Cibulskis K. et al. Sensitive detection of somatic point mutations in impure and heterogeneous cancer samples. Nature Biotechnology 31, 213–219, doi: 10.1038/nbt.2514 (2013). [DOI] [PMC free article] [PubMed] [Google Scholar]
- 68.Rausch T. et al. DELLY: structural variant discovery by integrated paired-end and split-read analysis. Bioinformatics 28, i333–i339, doi: 10.1093/bioinformatics/bts378 (2012). [DOI] [PMC free article] [PubMed] [Google Scholar]
- 69.McLaren W. et al. The Ensembl Variant Effect Predictor. Genome Biol 17, 122, doi: 10.1186/s13059-016-0974-4 (2016). [DOI] [PMC free article] [PubMed] [Google Scholar]
- 70.Olshen AB et al. Parent-specific copy number in paired tumor-normal studies using circular binary segmentation. Bioinformatics 27, 2038–2046, doi: 10.1093/bioinformatics/btr329 (2011). [DOI] [PMC free article] [PubMed] [Google Scholar]
- 71.Cheng DT et al. Memorial Sloan Kettering-Integrated Mutation Profiling of Actionable Cancer Targets (MSK-IMPACT). The Journal of Molecular Diagnostics 17, 251–264, doi: 10.1016/j.jmoldx.2014.12.006 (2015). [DOI] [PMC free article] [PubMed] [Google Scholar]
- 72.Mody RJ et al. Integrative Clinical Sequencing in the Management of Refractory or Relapsed Cancer in Youth. JAMA 314, 913–925, doi: 10.1001/jama.2015.10080 (2015). [DOI] [PMC free article] [PubMed] [Google Scholar]
- 73.Wagner AH et al. DGIdb 2.0: mining clinically relevant drug–gene interactions. Nucleic Acids Research 44, D1036–D1044, doi: 10.1093/nar/gkv1165 (2016). [DOI] [PMC free article] [PubMed] [Google Scholar]
- 74.Dobin A. et al. STAR: ultrafast universal RNA-seq aligner. Bioinformatics (Oxford, England) 29, 15–21, doi: 10.1093/bioinformatics/bts635 (2013). [DOI] [PMC free article] [PubMed] [Google Scholar]
- 75.Djebali S. et al. Landscape of transcription in human cells. Nature 489, 101–108, doi: 10.1038/nature11233 (2012). [DOI] [PMC free article] [PubMed] [Google Scholar]
Associated Data
This section collects any data citations, data availability statements, or supplementary materials included in this article.