

Abstract
Serum adiponectin concentrations are higher in women than men. The sexual dimorphism for adiponectin has been attributed to the direct effects of testosterone on adipose tissue adiponectin secretion. However, serum testosterone and adiponectin concentrations are generally lower in obese men than lean men, suggesting that sex steroids may not be the only factor that contributes to sex differences in serum adiponectin. The primary objective of this study was to examine the influence of sex, body composition, and nonesterified fatty acids (NEFAs) on serum adiponectin concentrations. Women and men between the ages of 18 and 35 years were consecutively accrued into the study. Sixty-one participants were partitioned into normal-weight (15 female and 16 male) or obese (14 female and 16 male) groups. Blood samples were obtained after a 12-hour fast. Differences between groups were determined by analysis of variance with Tukey-Kramer post hoc testing. Serum adiponectin was 26% higher in women compared with men. Body mass index was associated with total serum adiponectin in men (r = −0.63, P < .05) but not women. Adiponectin was correlated with the homeostasis model assessment index in women (r = −0.56, P < .05) and men (r = −0.58, P < .05) and with NEFAs (r = −0.68, P < .05) in men only. After partitioning men and women into normal weight and obese groups, serum adiponectin was lower and NEFAs were higher in obese men only. Homeostasis model assessment was similar between obese women and men despite higher NEFAs in the obese men. Leptin and plasminogen activator inhibitor–1 were higher in obese participants but were not associated with serum NEFAs. These results suggest that serum NEFAs may reduce adiponectin concentrations independent of their effects on insulin sensitivity in obese young men.
1. Introduction
Obesity is characterized by the expansion of adipose tissue and is generally defined as a body mass index (BMI) of at least 30 kg/m2. The prevalence of obesity has dramatically increased over the past 25 years, resulting in record health care expenditures [1]. Although reductions in physical activity [2] and an increase in the availability and consumption of energy-dense foods [3] appear to be responsible for the rapid rise in obesity, our understanding of the health-related risks associated with obesity remains complicated by sexual dimorphisms and the disparities between obese metabolic phenotypes.
Over the past decade, it has become clear that the role of adipose tissue extends beyond that of an energy storage organ. Indeed, the discoveries of adiponectin and leptin in the mid-1990s redefined adipose tissue as an endocrine organ capable of modulating energy metabolism and food intake [4,5]. Although their physiologic function has been extensively studied, limited information is available regarding the regulation and secretion of adiponectin and other adipose tissue–derived proteins. Adiponectin is a 30-kd protein produced by the adipocyte most-abundant gene. After posttranslational modifications, adiponectin is secreted as a trimer (90 kd), a low–molecular weight (LMW) hexamer (180 kd), and a high–molecular weight (HMW) multimer (360–540 kd) [4]. The HMW multimer has the highest biological activity and possesses insulin-sensitizing, anti-inflammatory, and antiatherogenic properties [6].
A number of studies published to date suggest that serum total and HMW adiponectin concentrations are higher in women than men even after controlling for differences in BMI [7–16]. The sex dimorphism for adiponectin has been primarily attributed to the direct effects of testosterone on adiponectin secretion. Indeed, serum total and HMW adiponectin concentrations were high in castrated rodents and hypogonadal men and decreased after testosterone therapy [17,18]. In contrast, Combs et al [19] found that castration of mice in neonatal life but not adult life resulted in increased plasma adiponectin concentrations compared with adult females, suggesting that other factors besides gonadal steroids may be responsible for sex differences in serum adiponectin concentrations [20].
Increased adipose tissue lipolysis has also been shown to reduce adiponectin gene expression and serum adiponectin concentrations. Furthermore, β-adrenergic stimulation of lipolysis and exposure to nonesterified fatty acids (NEFAs) decrease adiponectin secretion in adipocytes [21,22]. Although elevated NEFAs have been primarily attributed to the insulin resistance observed in obesity and type 2 diabetes mellitus [23], little is known about sex differences in the contribution of NEFAs to the regulation of adiponectin secretion.
Therefore, the primary purpose of the current investigation was to further explore the relationship of adiponectin with serum biomarkers of metabolic and cardiovascular disease (CVD), body composition, and sex. Our results indicate that serum adiponectin concentrations were lower and NEFAs were higher in obese men after partitioning men and women into normal-weight and obese groups. Adiponectin was correlated with insulin sensitivity in the entire cohort but with serum NEFAs in men only. Nonesterified fatty acids were inversely correlated with serum adiponectin concentrations in obese men only, suggesting that NEFAs may influence serum adiponectin concentrations.
2. Materials and methods
2.1. Participants
All volunteers were recruited by local advertisements in the Montgomery and Auburn, AL, communities. Volunteers were allowed to participate in the study if they were between the ages of 18 and 35 years, were previously sedentary (defined as no regular leisure time physical activity or vocational activity for the past 6 months), and presented with no known history of metabolic or CVD. Volunteers who took any medications known to influence blood lipid or glucose metabolism were excluded. Only premenopausal women who were eumenorrheic (normal menstrual cycle for the past 6 months) and who were not currently pregnant or taking contraceptives were considered for participation in the study. Women and men consecutively joined the study. The study was approved by the Auburn University–Montgomery and Auburn University Institutional Review Boards. All participants were fully informed of the study, and written informed consent was obtained before beginning the study.
2.2. Experimental procedures
Body mass was measured to the nearest 0.1 kg, whereas height was measured to the nearest 0.5 cm using a stadiometer. Body mass index was calculated as body mass (in kilograms) divided by the square of height (in meters). Waist circumference was measured at the narrowest portion of the torso (above the umbilicus and below the xiphoid process). Body density was estimated by skinfold measurements using a 7-site regression equation and was used to calculate percentage body fat and lean body mass (LBM) [24]. Participants were asked to avoid physical activity or changes in dietary consumption for 72 hours before blood sampling. Blood samples from female participants were obtained in the early follicular stage of the menstrual cycle 2 to 6 days after menstruation. All blood samples were obtained after a 10- to 12-hour fast from an antecubital vein into prechilled Vacutainer tubes. Samples were allowed to clot for approximately 30 minutes on ice and were centrifuged at 1500g for 10 minutes. Serum was then isolated and stored at −80°C for subsequent analyses.
2.3. Analytical procedures
Serum adiponectin, leptin, resistin, and insulin concentrations were measured by enzyme-linked immunosorbent assay (ELISA) (Millipore, Billerica, MA). Serum C-reactive Protein (CRP) concentrations (assay sensitivity of 0.35 ng/ mL) were determined by a sandwich ELISA (United Biotech, Mountain View, CA).
Nonesterified fatty acid concentrations were determined using a colorimetric kit from Wako (Columbia, MD). Glucose, total cholesterol, high-density lipoprotein cholesterol (HDL-C), and triglycerides were measured with kits from Raichem (Richmond, VA). Low-density lipoprotein cholesterol (LDL-C) was calculated as total cholesterol − HDL-C − (triglyceride/5) [25]. Homeostasis model assessment (HOMA) was calculated as [fasting insulin (in microunits per milliliter) * fasting glucose (in millimoles per liter)]/22.5 [26]. Serum free testosterone was measured using a commercially available ELISA kit (Diagnostic Systems Laboratories, Webster, TX). Intraassay and interassay coefficients of variation were 2.3% and 2.7% for adiponectin, 3.2% and 2.9% for leptin, 4.1% and 3.8% for resistin, and 4.2% and 4.5% for CRP. Interassay and interassay coefficients of variation for testosterone were 5.2% and 6.5%.
2.4. Statistical analysis
Differences in dependent variables between women and men were determined using an independent t test. Differences between sex and BMI-partitioned groups were determined using a 1 × 4 analysis of variance. Tukey-Kramer post hoc testing was used to explore significant differences determined by analysis of variance. Tests for normality confirmed that all dependent variables were normally distributed. Relationships between dependent variables were determined using Pearson product-moment correlation coefficients. Because a number of dependent variables were correlated with adiponectin, stepwise multiple regression was used to determine the most appropriate predictor variables for serum adiponectin concentrations. Values are presented as means ± SEM. Data were analyzed using the Statistical Analysis System (SAS for Windows, Version 9.1; SAS Institute, Cary, NC). The comparison-wise error rate was set at P <.05.
3. Results
A total of 83 volunteers responded to the study, with 30 women and 31 men meeting all criteria. Of the 61 participants who entered the study, 43 were white, 10 were African American, 4 were Asian, and 4 were Hispanic. There were no differences in the distribution of race between groups. As observed in Table 1, body weight, BMI, and waist circumference were similar between women and men, whereas LBM was higher in men than women. Total cholesterol, LDL-C, and triglycerides were lower and HDL-C was higher in women than men. Serum adiponectin, leptin, and CRP concentrations were higher in women compared with men, whereas resistin and plasminogen activator inhibitor–1 (PAI-1) were similar between men and women. Nonesterified fatty acids were inversely associated with serum adiponectin concentrations in men but not in women. Serum adiponectin was positively associated with HDL-C and inversely associated with triglycerides and insulin in men and women (Tables 2 and 3). Leptin and PAI-1 were positively associated with body weight, BMI, waist circumference, and percentage body fat.
Table 1.
Physiologic characteristics by sex
| Female | Range | Male | Range | |
|---|---|---|---|---|
| Age, y | 28 ± 1 | 21–35 | 31 ± 2 | 22–34 |
| Weight, kg | 84.8 ± 7.0 | 44.5–136.0 | 87.3 ± 4.8 | 72.7–146.6 |
| Height, m | 1.63 ± 0.2 | 1.52–1.75 | 1.74 ± 0.2 | 1.60–1.96 |
| BMI, kg/m2 | 31.5 ± 2.2 | 19.1–46.9 | 30.1 ± 1.3 | 20.2–45.2 |
| Waist, cm | 91.7 ± 4.8 | 61.0–132.1 | 90.9 ± 3.6 | 64.3–131.9 |
| Hip, cm | 113.4 ± 4.8 | 85.1–157.5 | 103.4 ± 2.0* | 94.5–132.1 |
| WHR, cm | 0.80 ± 0.01 | 0.72–0.87 | 0.88 ± 0.02* | 0.75–1.04 |
| % Fat | 31 ± 2 | 16–45 | 23 ± 2* | 10–43 |
| LBM, kg | 56.5 ± 3.1 | 36.1–80.9 | 66.1 ± 2.2 | 50.6–83.6 |
| FM, kg | 28.5 ± 4.0 | 9.4–55.1 | 21.2 ± 3.3 | 7.0–63.1 |
| SBP, mm Hg | 130 ± 4 | 103–180 | 119 ± 3* | 100–154 |
| DBP, mm Hg | 81 ± 2 | 62–104 | 80 ± 2 | 60–102 |
| TC, mg/dL | 173 ± 10 | 129–204 | 201 ± 27* | 1.9–17.1 |
| HDL-C, mg/dL | 59 ±5 | 32–81 | 46 ± 6* | 21–63 |
| TG, mg/dL | 107 ± 16 | 57–158 | 159 ± 32* | 79–198 |
| LDL-C, mg/dL | 95 ± 11 | 71–136 | 113 ± 17* | 78–183 |
| Insulin, μU/mL | 10.4 ± 1.1 | 3.1–48.4 | 10.1 ± 0.7 | 2.4–60.4 |
| HOMA | 1.24 ± 0.13 | 0.87–4.50 | 1.34 ± 0.19 | 1.45–5.11 |
| Glucose, mg/dL | 78 ± 3 | 65–115 | 84 ± 2 | 69–101 |
| NEFA, mmol/L | 0.41 ± 0.03 | 0.23–0.67 | 0.47 ± 0.05 | 0.14–0.76 |
| APN, μg/mL | ||||
| Total | 8.2 ± 0.9 | 3.6–16.0 | 6.1 ± 0.9* | 1.9–17.1 |
| HMW | 4.5 ± 0.4 | 1.9–10.5 | 3.7 ± 0.5* | 1.8–9.4 |
| LMW | 3.7 ± 0.6 | 1.4–8.1 | 2.4 ± 0.5* | 1.1–8.5 |
| Leptin, ng/mL | 29.7 ± 5.0 | 2.9–86.5 | 20.0 ± 5.4* | 1.4–68.5 |
| Resistin, ng/mL | 7.9 ± 1.2 | 1.9–15.2 | 7.4 ± 1.5 | 1.2–13.5 |
| PAI-1, ng/mL | 25.9 ± 1.6 | 6.7–48.1 | 29.1 ± 2.1 | 7.9–47.2 |
| CRP, mg/L | 3.6 ± 0.9 | 0.7–10.3 | 2.9 ± 0.8* | 0.3–11.2 |
| Fibrinogen, mg/dL | 278 ± 19 | 225–433 | 287 ± 23 | 201–401 |
| WBC, × 1000/μL | 5.1 ± 0.2 | 1.3–10.1 | 5.4 ± 0.3 | 1.1–11.9 |
Values are means ± SEM and range. WHR indicates waist-to-hip ratio; FM, fat mass; SBP, resting systolic blood pressure; DBP, resting systolic blood pressure; TC, total cholesterol; TG, triglyceride; APN, total adiponectin; WBC, white blood cell count.
Significant difference between female and male. P b .05.
Table 2.
Correlation between serum adipokines and traditional metabolic and CVD risk markers in women
| APN | HMW | LMW | Leptin | Resistin | PAI-1 | |
|---|---|---|---|---|---|---|
| Age | 0.49* | 0.45* | 0.48* | 0.25 | 0.22 | 0.32 |
| Weight | −0.09 | −0.06 | −0.14 | 0.78* | 0.35 | 0.89* |
| BMI | −0.06 | −0.01 | −0.15 | 0.84* | 0.33 | 0.86* |
| Waist | −0.11 | −0.07 | −0.16 | 0.82* | 0.29 | 0.81* |
| % Fat | −0.16 | −0.08 | −0.26 | 0.69* | 0.32 | 0.78* |
| LBM | −0.06 | −0.03 | −0.09 | −0.54* | 0.12 | 0.39 |
| FM | −0.23 | −0.29 | −0.32 | 0.77* | 0.23 | 0.66* |
| SBP | −0.17 | −0.13 | −0.19 | 0.39 | 0.35 | 0.29 |
| DBP | −0.18 | −0.16 | −0.20 | 0.33 | 0.19 | 0.24 |
| TC | −0.37 | −0.32 | −0.38 | 0.34 | 0.36 | 0.19 |
| HDL-C | 0.66* | 0.69* | 0.67* | −0.52* | −0.34 | −0.33 |
| TG | −0.74* | −0.76* | −0.69* | 0.39 | 0.42 | 0.27 |
| LDL-C | −0.24 | −0.23 | −0.24 | 0.29 | 0.23 | 0.36 |
| Insulin | −0.64* | −0.69* | −0.59* | 0.48* | 0.33 | 0.52* |
| Glucose | −0.09 | −0.12 | −0.04 | 0.31 | 0.19 | 0.23 |
| HOMA | −0.75* | −0.76* | −0.58* | 0.52* | 0.32 | 0.55* |
| NEFA | 0.01 | 0.13 | −0.18 | 0.23 | 0.31 | 0.19 |
| CRP | −0.36 | −0.33 | −0.36 | 0.33 | 0.24 | 0.31 |
| Fibrinogen | 0.23 | 0.32 | 0.15 | 0.19 | 0.18 | 0.34 |
| WBC | 0.19 | 0.14 | 0.17 | 0.14 | 0.22 | 0.05 |
All values represent Pearson proquct-moment correlation coefficients.
P < .05.
Table 3.
Correlation between serum adipokines and traditional metabolic and CVD risk markers in men
| APN | HMW | LMW | Leptin | Resistin | PAI-1 | |
|---|---|---|---|---|---|---|
| Age | −0.47* | −0.48* | −0.36 | 0.32 | 0.26 | 0.15 |
| Weight | −0.54* | −0.42* | −0.63* | 0.81* | 0.25 | 0.78* |
| BMI | −0.63* | −0.54* | −0.68* | 0.88* | 0.22 | 0.75* |
| Waist | −0.68* | −0.60* | −0.72 | 0.65* | 0.34 | 0.84* |
| % Fat | −0.72* | −0.69* | −0.71* | 0.54* | 0.41 | 0.57* |
| LBM | −0.17 | −0.03 | −0.31 | −0.25 | 0.15 | 0.22 |
| FM | −0.65* | −0.57* | −0.70* | 0.69* | 0.33 | 0.65* |
| SBP | −0.48* | −0.46* | −0.40 | 0.39 | 0.21 | 0.28 |
| DBP | −0.45* | −0.47* | −0.35 | 0.25 | 0.22 | 0.10 |
| TC | −0.31 | −0.22 | −0.14 | 0.11 | 0.14 | 0.05 |
| HDL-C | 0.74* | 0.78* | 0.54* | −0.48* | −0.36 | −0.11 |
| TG | −0.64* | −0.59* | −0.58* | 0.24 | 0.11 | 0.17 |
| LDL-C | −0.19 | −0.34 | −0.36 | 0.35 | 0.26 | 0.19 |
| Insulin | −0.56* | −0.54* | −0.48* | 0.54* | 0.41 | 0.62* |
| Glucose | 0.10 | 0.06 | 0.14 | 0.29 | 0.14 | 0.22 |
| HOMA | −0.55* | −0.54* | −0.47* | 0.65* | 0.14 | 0.57* |
| NEFA | −0.48* | −0.52* | −0.37 | 0.24 | 0.36 | 0.24 |
| CRP | −0.46* | −0.47* | −0.38 | 0.29 | 0.11 | 0.17 |
| Fibrinogen | −0.21 | −0.16 | −0.25 | 0.15 | 0.19 | 0.14 |
| WBC | 0.08 | 0.07 | 0.08 | 0.11 | 0.11 | 0.19 |
All values represent Pearson product-moment correlation coefficients.
P < .05 for all.
To further explore the relationship of adiponectin between sexes, we partitioned women and men into normal-weight (BMI < 25 kg/m2) or obese (BMI ≥30 kg/m2) groups. Of the sixty-one participants who met these criteria, 31 (15 female and 16 male) had a BMI less than 25 kg/m2; and 30 (14 female and 16 male) had a BMI of at least 30 kg/m2 (Table 4). As observed in Fig. 1, lean and obese women and lean men had similar serum adiponectin concentrations. In contrast, serum adiponectin concentrations were lower in obese but not lean men. Serum free testosterone concentrations were similar between lean and obese men (168 ± 58 vs 159 ± 60, P > .05), indicating that differences in serum testosterone concentrations were not responsible for the observed sex differences in adiponectin concentrations. Serum NEFAs were, on average, 55% higher in obese men compared with each of the other groups (Fig. 2) and correlated strongly with total (r = −0.83, P < .05) and HMW (r = −0.78, P < .05) adiponectin concentrations in men only (Fig. 3). Furthermore, stepwise multiple regression revealed that serum NEFAs were the best predictor of serum total and HMW adiponectin in men and accounted for 69% of the variation in total adiponectin and 71% in HMW adiponectin. These findings indicate that serum NEFAs are elevated in obese men but not obese women and may be responsible at least partially for the dysregulation of adiponectin secretion independent of its effects on insulin sensitivity. In contrast, serum leptin was higher in obese participants compared with their lean counterparts (Fig. 4).
Table 4.
Physiologic characteristics by sex and BMI
| LF | OF | LM | OM | |
|---|---|---|---|---|
| Age, y | 28 ± 2 | 28 ± 2 | 30 ± 2 | 31 ± 2 |
| Weight, kg | 59.2 ± 3.1 | 107.5 ± 6.1* | 74.1 ± 24† | 103.8 ± 6.7* |
| Height, m | 1.60 ± 0.2 | 1.66 ± 0.2 | 1.74 ± 0.3 | 1.74 ± 0.3 |
| BMI, kg/m2 | 23.0 ± 0.8 | 39.0 ± 1.8* | 24.5 ± 0.6 | 34.1 ± 1.1† |
| Waist, cm | 73.7 ± 2.5 | 107.7 ± 3.6* | 79.5 ± 2.3 | 104.9 ± 3.1* |
| Hip, cm | 96.3 ± 4.8 | 128.8 ± 2.0* | 98.6 ± 1.3 | 109.5 ± 3.6† |
| WHR | 0.76 ± 0.01 | 0.84 ± 0.01 | 0.81 ± 0.01 | 0.96 ± 0.01 |
| % Fat | 23 ± 2 | 38 ± 1* | 16 ± 2† | 32 ± 2‡ |
| LBM | 100.7 ± 3.8 | 145.0 ± 6.6* | 138.1 ± 5.2* | 154.6 ± 7.8* |
| FM | 30.2 ± 3.5 | 91.5 ± 7.2* | 25.0 ± 2.2† | 73.7 ± 9.9‡ |
| SBP, mm Hg | 121 ± 4 | 138 ± 6* | 117 ± 4 | 122 ± 5 |
| DBP, mm Hg | 77 ± 3 | 84 ± 3 | 76 ± 3 | 85 ± 3 |
| TC, mg/dL | 157 ± 10 | 189 ± 9* | 171 ± 30† | 230 ± 25‡ |
| HDL-C, mg/dL | 65 ± 4 | 52 ± 6* | 50 ± 5† | 42 ± 7‡ |
| TG, mg/dL | 79 ± 15 | 135 ± 17* | 103 ± 25† | 209 ± 39‡ |
| LDL-C, mg/dL | 76 ± 14 | 116 ± 10* | 79 ± 19 | 146 ± 14† |
| Insulin, μU/mL | 6.2 ± 1.1 | 14.1 ± 2.6* | 6.8 ± 1.2 | 13.6 ± 2.1* |
| Glucose, mg/dL | 74 ± 1.9 | 82 ± 5 | 86 ± 3 | 82 ± 3 |
| HOMA | 1.13 ± 0.10 | 2.85 ± 0.26* | 1.44 ± 0.15 | 2.75 ± 0.19* |
| NEFA, mmol/L | 0.38 ± 0.05 | 0.41 ± 0.04 | 0.32 ± 0.05 | 0.63 ± 0.07* |
| APN, μg/mL | ||||
| Total | 8.2 ± 1.1 | 8.2 ± 1.5 | 8.1 ± 1.3 | 3.5 ± 0.4* |
| HMW | 4.7 ± 0.5 | 4.4 ± 0.6 | 4.7 ± 0.6 | 2.4 ± 0.3* |
| LMW | 3.5 ± 0.8 | 3.8 ± 0.9 | 3.4 ± 0.7 | 1.2 ± 0.2* |
| Leptin, ng/mL | 10.2 ± 3.1 | 48.2 ± 6.1* | 3.8 ± 4.3† | 26.8 ± 6.2‡ |
| Resistin, ng/mL | 6.9 ± 1.1 | 7.5 ± 1.8 | 6.5 ± 1.3 | 7.1 ± 1.4 |
| PAI-1, ng/mL | 17.5 ± 1.8 | 35.9 ± 1.7* | 18.9 ± 2.4* | 38.3 ± 4.2* |
| CRP, mg/L | 1.1 ± 0.4 | 5.9 ± 1.2* | 0.73 ± 0.25 | 4.0 ± 1.2* |
| Fibrinogen, mg/dL | 269 ± 23.4 | 295 ± 22.1 | 290.5 ± 27.7 | 269.3 ± 16.8 |
| WBC, ×1000/μL | 5.1 ± 0.1 | 6.8 ± 0.2* | 5.2 ± 0.3 | 6.5 ± 0.8* |
Values are means ± SEM and range. Groups with different symbols are significantly different. P <.05. LF indicates lean female; OF, obese female; LM, lean male; OM, obese male.
Fig. 1.
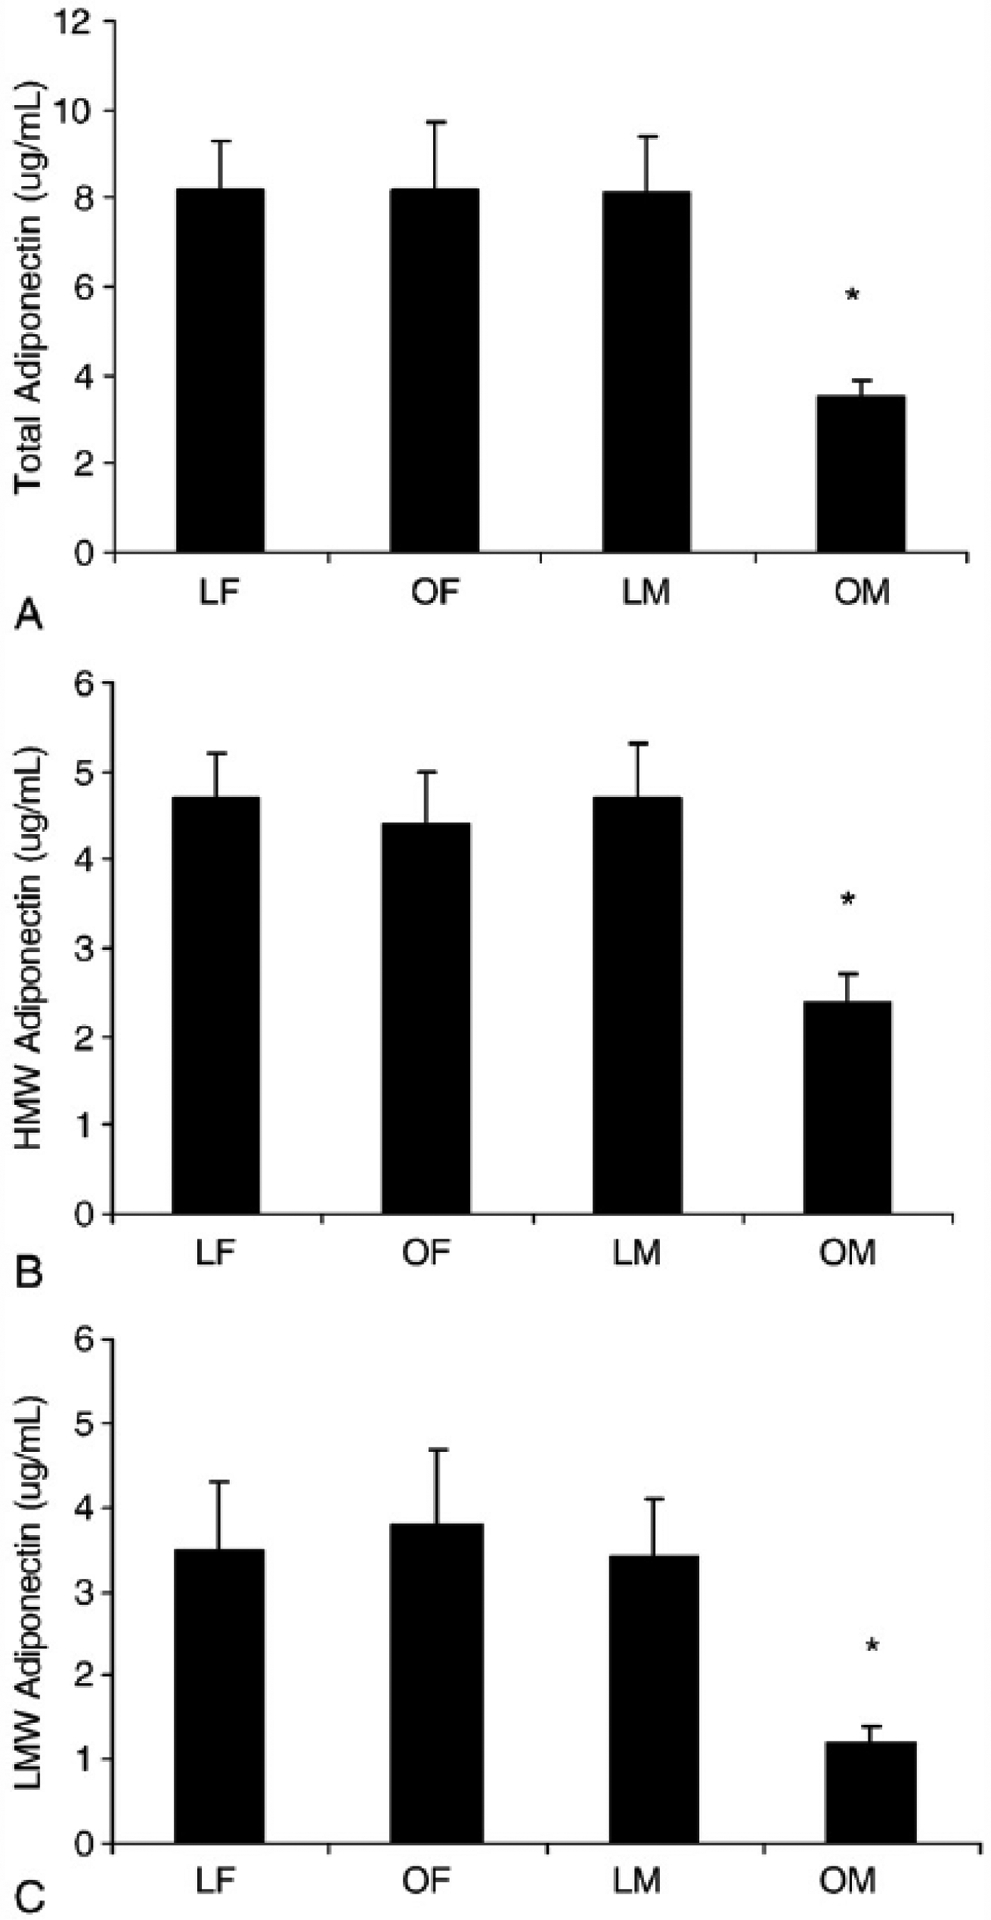
Serum total (A), HMW (B), and LMW (C) adiponectin concentrations are low in obese men. Values are means ± SEM. *Significant difference. P <.05. LF indicates lean female (BMI <25 mg/kg2); OF, obese female (BMI ≥30 kg/m2); LM, lean male (BMI <25 mg/kg2); OM, obese male (BMI ≥30 kg/m2).
Fig. 2.
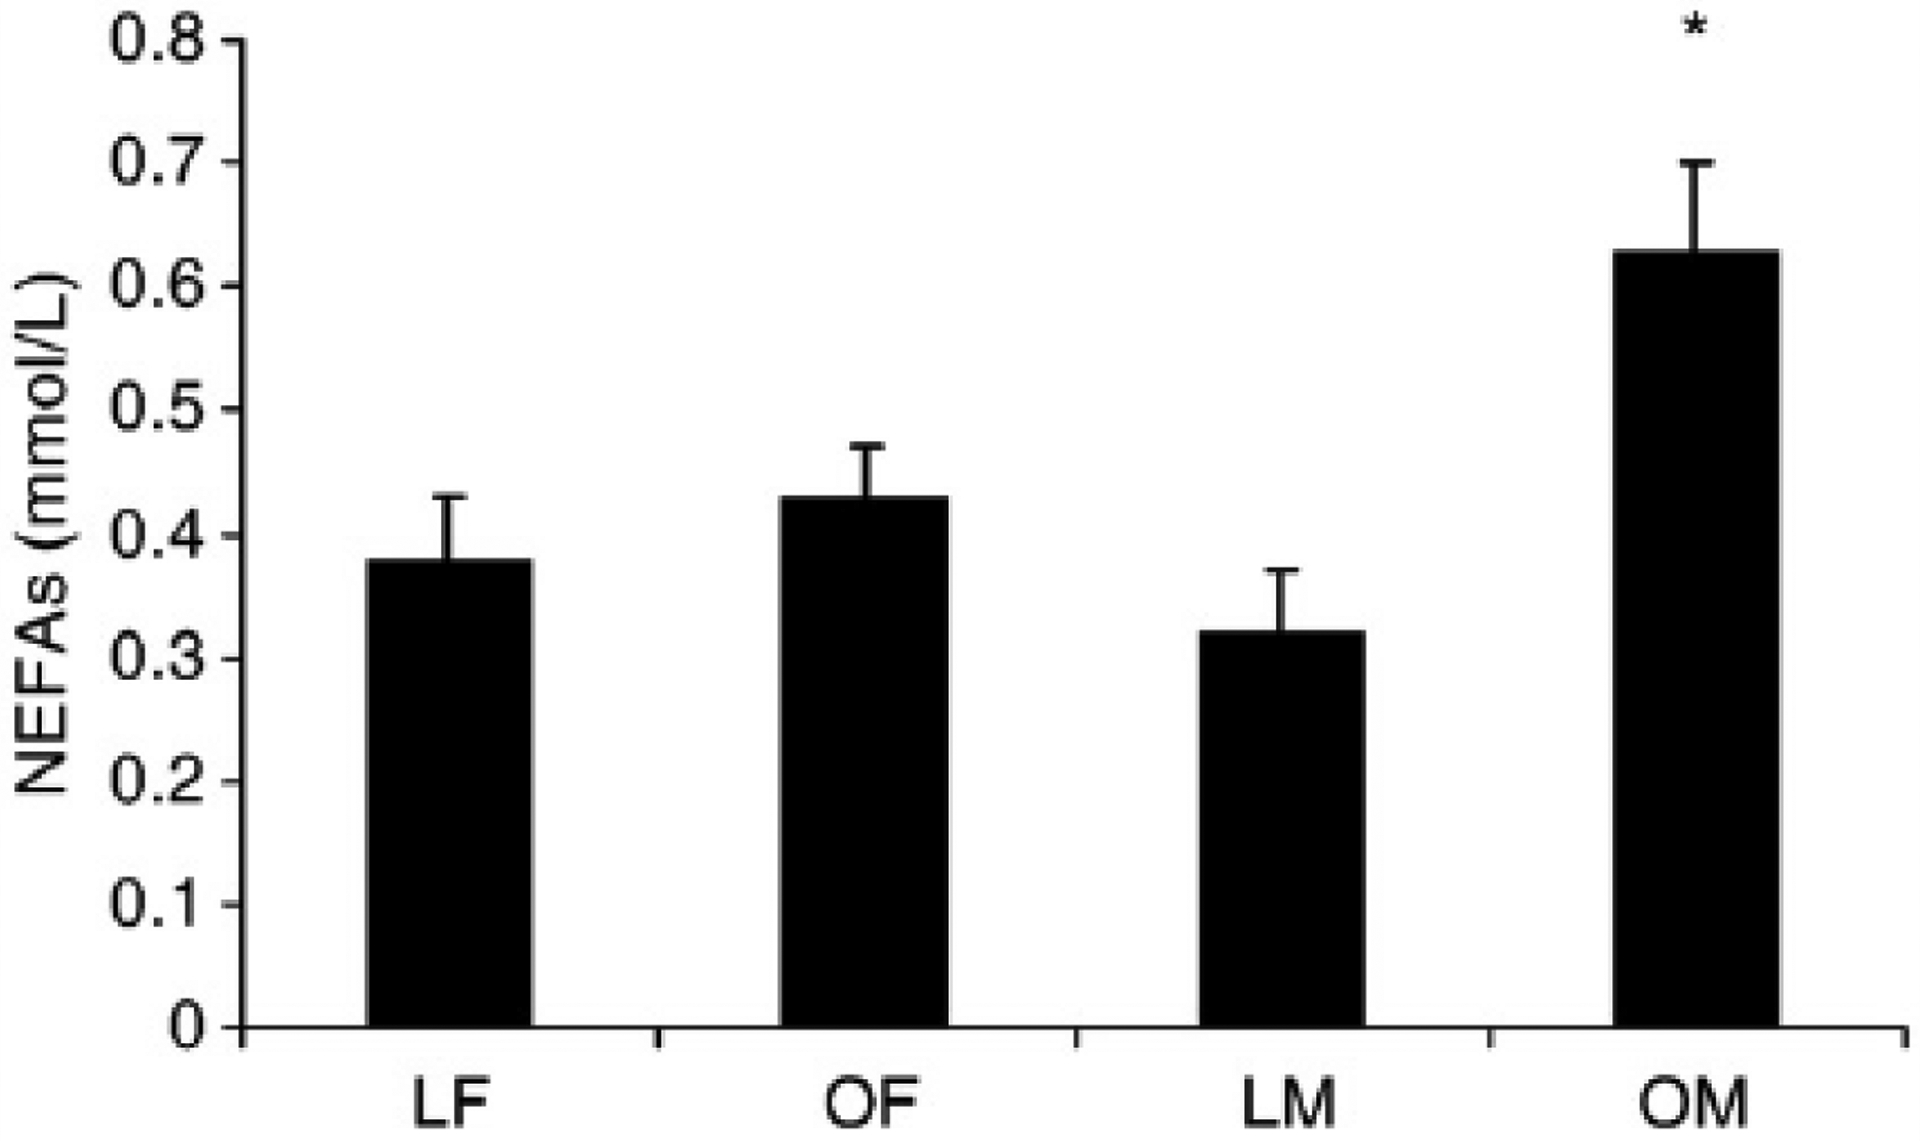
Serum NEFA concentrations are elevated in obese men. Values are means ± SEM. *Significant difference. P < .05.
Fig. 3.

Scrum total adiponectin concentrations are inversely associated with NEFAs in men (B) but not women (A).
Fig. 4.
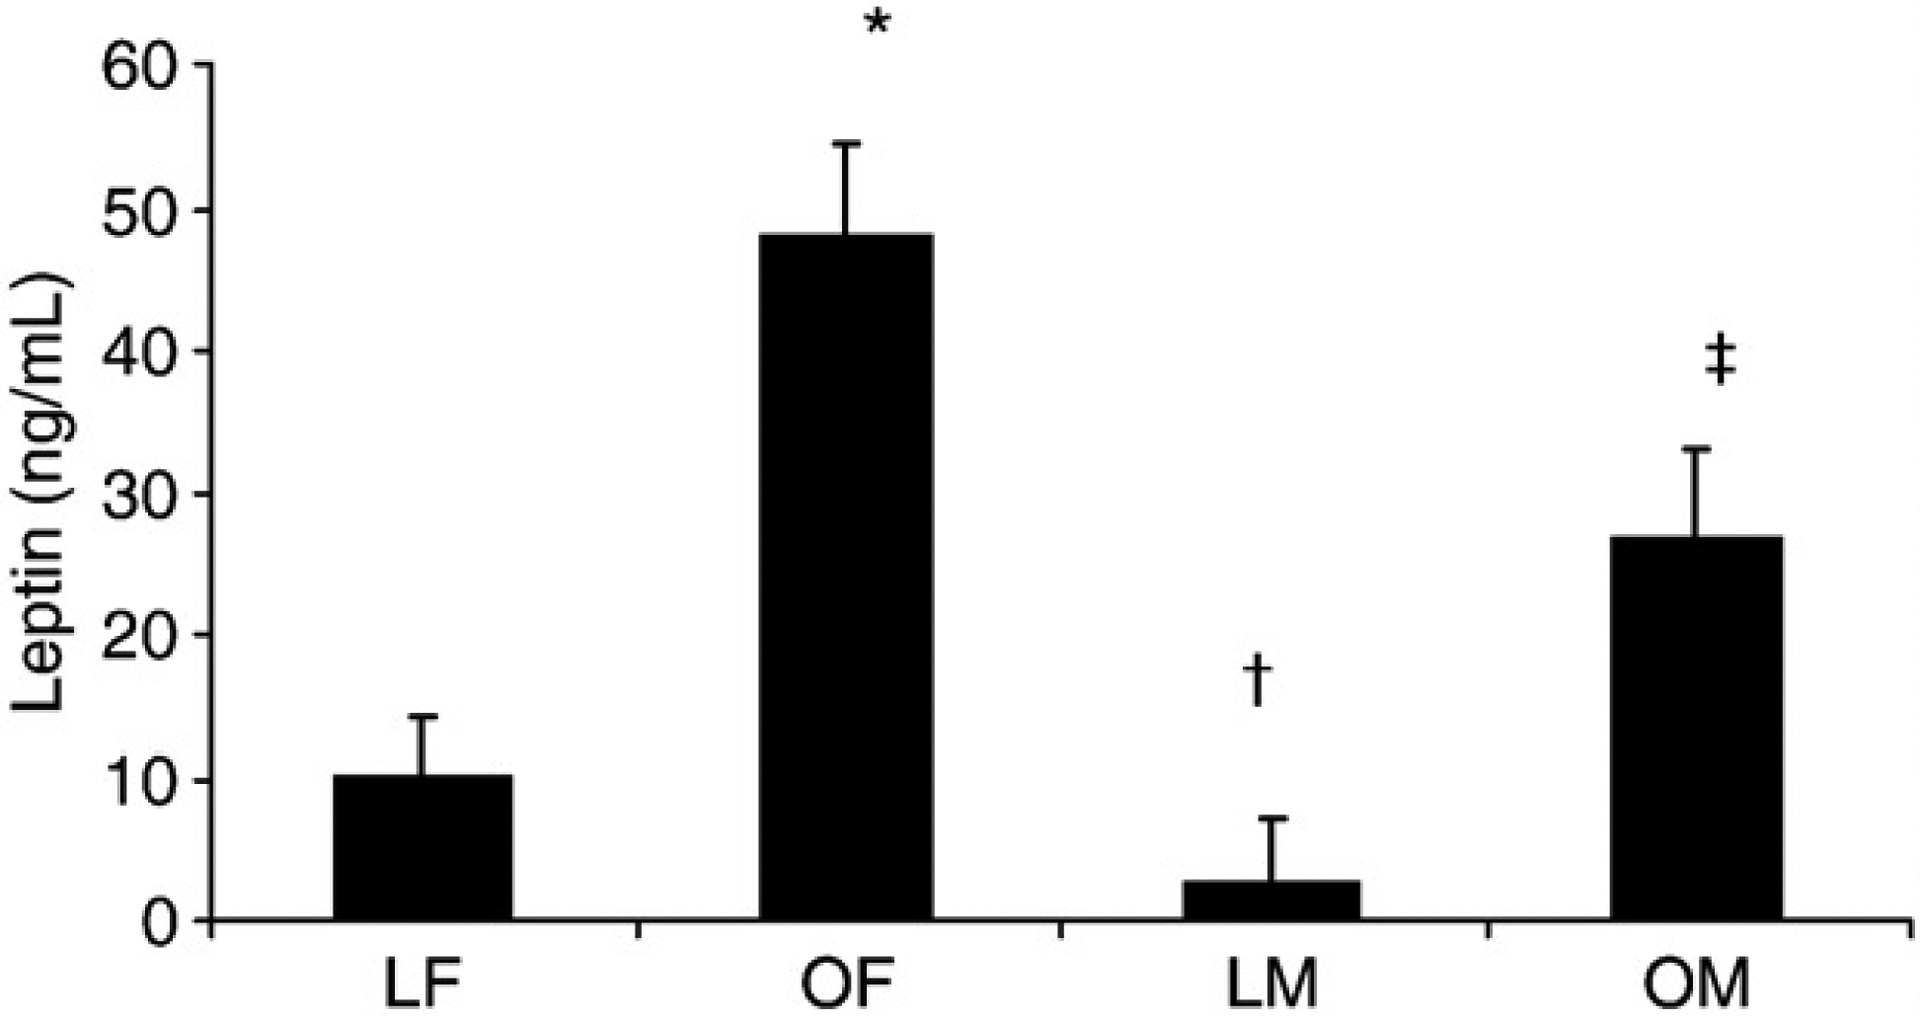
Serum leptin concentrations are higher in women and men and the obese groups compared with lean groups. Values are means ± SEM. *Significant difference from LF. †Significant difference from LF and OF. ‡Significant difference from LF, OR and LM. P< .05.
4. Discussion
A sexual dimorphism for adiponectin has been reported in a number of investigations even after controlling for differences in body composition [7–9]. However, upon closer examination of the literature, serum adiponectin concentrations may be more closely linked to other factors such as serum lipids or insulin sensitivity [11,27]. In the current investigation, serum adiponectin concentrations were higher in women and men of similar age, BMI, and waist circumference. Adiponectin was correlated with insulin sensitivity in the entire cohort and with serum NEFAs in men but not women. After partitioning men and women into lean and obese groups, serum adiponectin concentrations were lower and NEFAs were higher in obese men compared with the other groups and were not different between lean and obese women and lean men. Nonesterified fatty acids were inversely correlated with serum adiponectin concentrations in obese men only, suggesting that serum NEFAs may directly influence adiponectin secretion independent of their effects on insulin sensitivity.
Testosterone has been proposed as the primary factor responsible for sex differences in serum adipokine concentrations. In fact, insulin sensitivity of male androgen-receptor knockout mice remained intact despite obesity, with enhanced adiponectin secretion and a reduction in lipolysis [28]. Furthermore, castration increased serum total and HMW adiponectin concentrations, whereas testosterone replacement lowered total and HMW adiponectin [17,18]. Serum HMW adiponectin concentrations were modestly decreased after 12 weeks of testosterone replacement therapy in hypogonadal men [17]. In the current investigation, serum adiponectin concentrations were higher in lean men compared with obese men despite similar testosterone concentrations, supporting the concept that other factors besides gonadal steroids must be required to explain the sex differences in serum total and HMW adiponectin concentrations.
A number of recent investigations suggest that serum lipids and insulin sensitivity may be better predictors of serum adiponectin concentrations than obesity or sex steroids per se [11,29]. Low adiponectin concentrations did not predict obesity in a human prospective trial but did predict the development of type 2 diabetes mellitus [29]. Peroxisome proliferator–activated γ agonist administration increased insulin sensitivity and adiponectin concentrations approximately 2-fold despite an increase in body weight. Furthermore, Winzer and colleagues [30] found that low plasma adiponectin concentrations characterize women with previous gestational diabetes mellitus independently of the degree of obesity. Cross-sectional and interventional studies indicate that plasma adiponectin concentrations correlate with serum lipids (total cholesterol, HDL-C, HDL-C, and triglycerides) independently of adiposity, whereas leptin was correlated with BMI [11]. Furthermore, the relationship between serum adiponectin was independent of weight loss in an interventional study of 95 obese subjects. Heliovaara et al [27] found similar results in that adiponectin was causally related not with insulin sensitivity in healthy participants but instead with triglyceride and HDL-C. Body mass index and serum adiponectin were also not correlated in obese women with polycystic ovarian syndrome [31]. These studies are in agreement with our findings that lean women have similar adiponectin concentrations to obese women and that lean men have similar adiponectin concentrations to lean and obese women.
Previous investigations suggest that diets high in fatty acids or an increase in β-adrenergic–stimulated lipolysis decreases adiponectin gene expression and secretion. Four weeks of a diet supplemented with 0.5% conjugated linoleic acid decreased serum adiponectin and increased serum tumor necrosis factor–α in obese mice [32]. Furthermore, a mixture of fatty acids reduced adiponectin gene expression [33] and secretion in 3T3-L1 adipocytes [22]. Although these studies suggest that an increase in lipolysis and/or NEFAs decreases adiponectin secretion, there is little information regarding the possibility of a sexually dimorphic coordinated dysregulation of adipose tissue lipolysis and adiponectin secretion. Our results indicate that serum NEFA and adiponectin concentrations are inversely associated in obese men but not obese women and appear to be independent of the effects of NEFAs on insulin sensitivity. Alternatively, it is possible that low adiponectin concentrations in the obese men may result in higher NEFA concentrations compared with lean men and women.
The results of the current investigation suggest that the relationship between serum NEFAs is specific to adiponectin. Indeed, we found that leptin and PAI-1 were higher in the obese groups than the lean groups but were not associated with sex or serum NEFAs. Furthermore, resistin concentrations were similar between sexes and BMI status. These findings are in agreement with a number of investigations [20,34–36] and suggest that leptin, resistin, and PAI-1 are not determined by sex differences in adipose tissue lipolysis or serum NEFAs.
Although elevated NEFAs in the obese men would seemingly be explained by the well-known differences in visceral adiposity or insulin resistance, waist circumference (a validated marker of visceral adiposity) and insulin sensitivity were similar between obese women and men, suggesting that these factors were not responsible for the differences in serum adiponectin concentrations. Because we did not measure β-adrenergic receptor density or sensitivity to catecholamines in visceral or subcutaneous adipose tissue, it is possible that the regulation of adiponectin in visceral adipose tissue of men is more sensitive to catecholamines. A greater sensitivity to catecholamine-stimulated lipolysis might explain the higher serum NEFAs and lower adiponectin concentrations in men. Furthermore, it is possible that visceral fat is not an ideal predictor of serum adiponectin concentrations. Indeed, intrahepatic and intramuscular lipids were better predictors of insulin sensitivity than visceral fat estimated by magnetic resonance tomography or waist circumference [37]. Taken together, these results suggest that traditional anthropometric measurements used to determine body composition may not adequately predict insulin sensitivity or serum adiponectin concentrations. In addition, it is also possible that the relatively small cohort and age range used (18–35 years) may have limited the association between adiponectin and other dependent variables.
The results of this study indicate that serum NEFAs are elevated in young obese men and are associated with low serum total, HMW, and LMW adiponectin concentrations. We also found that BMI and waist circumference were inversely associated with serum total and HMW adiponectin concentrations in men but not in women. Furthermore, leptin and PAI-1 concentrations were positively associated with BMI and insulin sensitivity in both men and women but were not influenced by serum NEFAs. These findings indicate that adiponectin may be specifically regulated via adipose tissue lipolysis and/or serum NEFAs in obese men. Additional studies will be required to further examine the coordinated relationship between lipolysis and adiponectin synthesis and secretion between sexes.
Acknowledgment
This work was supported by the Medical Technology Program at Auburn University-Montgomery and the TigerFit Program and Boshell Diabetes and Metabolic Diseases Research Program at Auburn University.
References
- [1].Wee CC, Phillips RS, Legedza AT, et al. Health care expenditures associated with overweight and obesity among US adults: importance of age and race. Am J Public Health 2005;95:159–65. [DOI] [PMC free article] [PubMed] [Google Scholar]
- [2].Ross R, Janssen I. Physical activity, total and regional obesity: dose–response considerations. Med Sci Sports Exer 2001;33:S521–7. [DOI] [PubMed] [Google Scholar]
- [3].Drewnowski A, Darmon N. The economics of obesity: dietary energy density and energy cost. Am J Clin Nutr 2005;82:265S–73S. [DOI] [PubMed] [Google Scholar]
- [4].Scherer PE, Williams S, Fogliano M, et al. A novel serum protein similar to C1q, produced exclusively in adipocytes. J Biol Chem 1995; 270:26746–9. [DOI] [PubMed] [Google Scholar]
- [5].Halaas JL, Gajiwala KS, Maffei M, et al. Weight–reducing effects of the plasma protein encoded by the obese gene. Science 1995;269: 543–6. [DOI] [PubMed] [Google Scholar]
- [6].Berg AH, Combs TP, Scherer PE. ACRP30/adiponectin: an adipokine regulating glucose and lipid metabolism. Trends Endocrinol Metab 2002;13:84–9. [DOI] [PubMed] [Google Scholar]
- [7].Laughlin GA, Barrett–Connor E, May S. Sex–specific association of the androgen to oestrogen ratio with adipocytokine levels in older adults: the Rancho Bernardo Study. Clin Endocrinol 2006;65:506–13. [DOI] [PubMed] [Google Scholar]
- [8].Peake PW, Kriketos AD, Campbell LV, et al. The metabolism of isoforms of human adiponectin: studies in human subjects and in experimental animals. Eur J Endocrin 2005;153:409–17. [DOI] [PubMed] [Google Scholar]
- [9].Dullaart RP, de Vries R, van Tol A, et al. Lower plasma adiponectin is a marker of increased intima–media thickness associated with type 2 diabetesmellitus andwithmale gender. Eur J Endocrin 2007;156:387–94. [DOI] [PubMed] [Google Scholar]
- [10].Shand BI, Scott RS, Elder PA, et al. Plasma adiponectin in overweight, nondiabetic individuals with or without insulin resistance. Diabetes Obes Metab 2003;5:349–53. [DOI] [PubMed] [Google Scholar]
- [11].Baratta R, Amato S, Degano C, et al. Adiponectin relationship with lipid metabolism is independent of body fat mass: evidence from both cross–sectional and intervention studies. J Clin Endocrinol Metab 2004;89:2665–71. [DOI] [PubMed] [Google Scholar]
- [12].Matsubara M, Maruoka S, Katayose S. Inverse relationship between plasma adiponectin and leptin concentrations in normal–weight and obese women. Eur J Endocrinol 2002;147:173–80. [DOI] [PubMed] [Google Scholar]
- [13].Kwon K, Jung SH, Choi C, et al. Reciprocal association between visceral obesity and adiponectin: in healthy premenopausal women. Int J Cardiol 2005;101:385–90. [DOI] [PubMed] [Google Scholar]
- [14].Cnop M, Havel PJ, Utzschneider KM, et al. Relationship of adiponectin to body fat distribution, insulin sensitivity and plasma lipoproteins: evidence for independent roles of age and sex. Diabetologia 2003;46:459–69. [DOI] [PubMed] [Google Scholar]
- [15].Yang WS, Lee WJ, Funahashi T, et al. Weight reduction increases plasma levels of an adipose–derived anti–inflammatory protein, adiponectin. J Clin Endocrinol Metab 2001;86:3815–9. [DOI] [PubMed] [Google Scholar]
- [16].Arawaka N, Daimon M, Oizumi T, et al. Correlation between change in body weight rather than current body weight and change in serum adiponectin levels in a Japanese population—the Funagata study. Metabolism 2006;55:324–30. [DOI] [PubMed] [Google Scholar]
- [17].Xu A, Chan KW, Hoo RL, et al. Testosterone selectively reduces the high molecular weight form of adiponectin by inhibiting its secretion from adipocytes. J Biol Chem 2005;280:18073–80. [DOI] [PubMed] [Google Scholar]
- [18].Nishizawa H, Shimomura I, Kishida K, et al. Androgens decrease plasma adiponectin, an insulin–sensitizing adipocyte–derived protein. Diabetes 2002;51:2734–41. [DOI] [PubMed] [Google Scholar]
- [19].Combs TP, Berg AH, Rajala MW, et al. Sexual differentiation, pregnancy, calorie restriction, and aging affect the adipocyte–specific secretory protein adiponectin. Diabetes 2003;52:268–76. [DOI] [PubMed] [Google Scholar]
- [20].Gui Y, Silha JV, Murphy LJ. Sexual dimorphism and regulation of resistin, adiponectin, and leptin expression in the mouse. Obes Res 2004;12:1481–91. [DOI] [PubMed] [Google Scholar]
- [21].Fasshauer M, Klein J, Neumann S, et al. Adiponectin gene expression is inhibited by beta–adrenergic stimulation via protein kinase A in 3T3–L1 adipocytes. FEBS Lett 2001;507:142–6. [DOI] [PubMed] [Google Scholar]
- [22].Nguyen MT, Satoh H, Favelyukis S, et al. JNK and tumor necrosis factor–alpha mediate free fatty acid–induced insulin resistance in 3T3–L1 adipocytes. J Biol Chem 2005;280:35361–71. [DOI] [PubMed] [Google Scholar]
- [23].Basu R, Shah P, Basu A, et al. Comparison of the effects of pioglitazone and metformin on hepatic and extra–hepatic insulin action in people with type 2 diabetes. Diabetes 2008;57:24–31. [DOI] [PubMed] [Google Scholar]
- [24].Jackson A, Pollock M. Practical assessment of body composition. Physician Sports Med 1985;13:76–90. [DOI] [PubMed] [Google Scholar]
- [25].Friedewald W, Levy RI, Fredrickson DS. Estimation of the concentration of low–density lipoprotein cholesterol in plasma, without use of the preparative ultracentrifuge. Clin Chem 1972;18:499–502. [PubMed] [Google Scholar]
- [26].Matthews D, Hosker J, Rudenski A, et al. Homeostasis model assessment: insulin resistance and B–cell function from fasting plasma glucose and insulin concentrations in man. Diabetologia 1985;28:412–9. [DOI] [PubMed] [Google Scholar]
- [27].Heliovaara MK, Strandberg TE, Karonen SL, et al. Association of serum adiponectin concentration to lipid and glucose metabolism in healthy humans. Horm Metab Res 2006;38:336–40. [DOI] [PubMed] [Google Scholar]
- [28].Yanese T, Fan W, Kyoya K, et al. Androgens and metabolic syndrome: lessons from androgen receptor knock out (ARKO) mice. J Steroid Biochem Mol Biol 2008;109:254–7. [DOI] [PubMed] [Google Scholar]
- [29].Vozarova B, Stefan N, Lindsay RS, et al. Low plasma adiponectin concentrations do not predict weight gain in humans. Diabetes 2002; 51:2964–7. [DOI] [PubMed] [Google Scholar]
- [30].Winzer C, Wagner O, Festa A, et al. Plasma adiponectin, insulin sensitivity, and subclinical inflammation in women with prior gestational diabetes mellitus. Diabetes Care 2004;27:1721–7. [DOI] [PubMed] [Google Scholar]
- [31].Sepilian V, Nagamani M. Adiponectin levels in women with polycystic ovary syndrome and severe insulin resistance. J Soc Gynecol Investig 2005;12:129–34. [DOI] [PubMed] [Google Scholar]
- [32].Ohashi A, Matsushita Y, Kimura K, et al. Conjugated linoleic acid deteriorates insulin resistance in obese/diabetic mice in association with decreased production of adiponectin and leptin. J Nutr Sci Vitaminol 2004;50:416–21. [DOI] [PubMed] [Google Scholar]
- [33].Bueno AA, Oyama LM, de Oliveira C, et al. Effects of different fatty acids and dietary lipids on adiponectin gene expression in 3T3–L1 cells and C57BL/6J mice adipose tissue. Pflugers Arch 2008;455:701–9. [DOI] [PubMed] [Google Scholar]
- [34].Ybarra J, Lehmann TN, Golay A, et al. Gender–based dimorphic pattern for interleukin–1 receptor antagonist in type 2 diabetes mellitus. Diabetes Metab 2008;34:75–81. [DOI] [PubMed] [Google Scholar]
- [35].Matsuda Y, Tanioka T, Yoshioka T, et al. Gender differences in association of plasma adiponectin with obesity reflect resultant insulin resistance in non–diabetic Japanese patients with schizophrenia. Psychiatry Clin Neurosci 2005;59:266–73. [DOI] [PubMed] [Google Scholar]
- [36].van Harmelen V, Wahrenberg H, Eriksson P, et al. Role of gender and genetic variance in plasminogen activator inhibitor–1 secretion from human adipose tissue. Thromb Haemost 2008;83:304–8. [PubMed] [Google Scholar]
- [37].Stefan N, Kantartzis K, Machann J, et al. Identification and characterization of metabolically benign obesity in humans. Arch Int Med 2008;168:1609–16. [DOI] [PubMed] [Google Scholar]