Abstract
Severe acute respiratory syndrome associated coronavirus main protease (SARS‐CoV Mpro) has been proposed as a prime target for anti‐SARS drug development. We have cloned and overexpressed the SARS‐CoV Mpro in Escherichia coli, and purified the recombinant Mpro to homogeneity. The kinetic parameters of the recombinant SARS‐CoV Mpro were characterized by high performance liquid chromatography‐based assay and continuous fluorescence‐based assay. Two novel small molecule inhibitors of the SARS‐CoV Mpro were identified by high‐throughput screening using an internally quenched fluorogenic substrate. The identified inhibitors have K i values at low μM range with comparable anti‐SARS‐CoV activity in cell‐based assays.
Keywords: SARS-CoV, severe acute respiratory syndrome associated coronavirus; Mpro, main protease; HPLC, high performance liquid chromatography; HTS, high throughput screening; RT-PCR, reverse transcription polymerase chain reaction; PCR, polymerase chain reaction; IPTG, isopropyl β-d-thiogalactoside; DABCYL, 4-(4-dimethylaminophenylazol)benzoyl; EDANS, 5-(2-aminoethylamino)-1-naphthalenesulphonic acid; CPE, cytopathic effect; PRA, plaque reduction assay; EMEM, Eagle's minimal essential medium; FBS, fetal bovine serum; PFU, plaque forming unit; MTT, 3-[4,5-dimethylth-iazol-2-yl]-2,5-diphenyltetrazolium bromide; CMV, cytomegalovirus; Severe acute respiratory syndrome; Coronavirus; 3C-like protease; Main protease; Fluorogenic substrate; Small molecule inhibitor
1. Introduction
Severe acute respiratory syndrome (SARS) swept through the world last year, infecting more than 8000 people across 29 countries and causing more than 900 fatalities [1]. The etiological agent of SARS was identified rapidly as a novel coronavirus of possible zoonotic origin [2, 3, 4]. Inadequate knowledge of the novel coronavirus SARS‐CoV and the absence of efficacious therapeutics, however, were the main reasons for the failure to improve the outcome of the patients and to manage the outbreak of SARS effectively.
Similar to other coronaviruses, SARS‐CoV is an enveloped, positive‐strand RNA virus with a large single‐strand RNA genome comprised of ∼29 700 nucleotides [5, 6]. Among various open reading frames identified, the replicase gene encodes two overlapping polyproteins, pp1a and pp1ab, and comprises approximately two‐thirds of the genome. Since the viral polyproteins are largely processed by the main protease (Mpro), and based on the successful development of efficacious antiviral agents targeting 3C‐like proteases in other viruses, this “essential” protease is considered as a prime target for anti‐SARS drug development [7, 8]. In addition, the recently available crystal structure of the SARS‐CoV Mpro has made possible the employment of structure‐based drug design to develop Mpro‐specific inhibitors [9].
To date, a number of potential inhibitors of SARS‐CoV have been proposed using molecular modelling and virtual screening techniques [10, 11, 12, 13, 14]. However, the inhibitory activities of most of the proposed inhibitors have not yet been examined in in vitro assays employing purified SARS‐CoV Mpro and synthetic substrates because of the tedious procedures involved in conventional high performance liquid chromatography (HPLC)‐based cleavage assays. In addition, HPLC‐based cleavage assays are impractical for high‐throughput screening (HTS) of thousands of compounds from chemical libraries. A continuous fluorescence‐based assay system will therefore be of great interest to the field for the rapid screening and evaluation of the potencies of potential inhibitors of SARS‐CoV Mpro.
We have acquired a chemical library (ChemBridge Corporation) of 50 240 structurally diverse small molecule compounds that vary in functional groups and charges. A diverse chemical library was purposely chosen for anti‐SARS drug screening, since we set out to isolate biologically active small molecules perturbing various viral components of the SARS‐CoV in a cellular model of infection. A total of 104 compounds protected permissive Vero cells (African green monkey kidney cells) from SARS‐CoV infection. Identification of inhibitors of SARS‐CoV Mpro from this pool of compounds using conventional HPLC‐based assays is labor‐intensive and time consuming. Here, we report the enzymatic characterization of a recombinant SARS‐CoV Mpro with authentic SARS‐CoV Mpro amino acid sequence and the employment of a continuous fluorescence‐based assay to identify novel small molecule inhibitors of SARS‐CoV Mpro. The efficacies of the 2 selected inhibitors have also been evaluated in cell‐based antiviral assays. Our study has defined the kinetic parameters of SARS‐CoV Mpro in HPLC‐based and continuous fluorescence‐based assays and validated the usefulness of the fluorescence‐based assay in HTS. Our results also provide biologically active novel non‐peptide lead compounds for rational drug design of SARS‐CoV Mpro inhibitors.
2. Materials and methods
2.1. Cloning of SARS‐CoV Mpro and construction of plasmid pET SVMP
SARS‐CoV (strain HKU39849) RNA was extracted from cell lysates of virus‐infected Vero cells (African green monkey kidney cell line) by TRIZOL (Invitrogen) according to the manufacturer's instructions. Reverse transcription was performed using Thermoscript RT‐PCR system purchased from Invitrogen. The full‐length cDNA was subsequently amplified by PCR using forward primer SVMPF (5′‐CGCGGATCCGATCGAAGGTCGTAGTGGTTTTAGGAAAATG‐3′) and reverse primer SVMPR (5′‐CGGAATTCTTATTGGAAGGTAACACCAGA‐3′). PCR product was separated by agarose gel electrophoresis, purified using QIAquick gel extraction kit (Qiagen), digested with BamHI and EcoRI restriction endonucleases, ligated to BamHI–EcoRI‐digested pET28b DNA (Novagen), and transformed into E. coli DH5α cells by electroporation to generate pET SVMP. The nucleotide sequence of the SARS‐CoV Mpro gene in plasmid pET SVMP was sequenced to confirm that no undesired mutation has been introduced. The construct was designed in a way that a factor Xa cleavage site was engineered in the N‐terminus of the SARS‐CoV Mpro (His‐Tag… ↓
SGFRKM…; the factor Xa cleavage site is indicated with a ↓ and the released N‐terminal part of the SARS‐CoV Mpro is bolded). Cleavage with factor Xa releases the His‐tag and yields recombinant SARS‐CoV Mpro with authentic SARS‐CoV Mpro amino acid sequence. The identity of the purified SARS‐CoV Mpro was determined by mass spectrometry (Genome Research Centre, the University of Hong Kong).
2.2. Protein expression and purification
Escherichia coli BL21 Gold (DE3) cells (Novagen) transformed with plasmid pET SVMP were grown to A 600=0.5 at 37 °C with shaking in Luria‐Bertani broth containing 50 μg/ml of kanamycin. The culture was induced with 0.5 mM of isopropyl β‐d‐thiogalactoside (IPTG) and grown at 30 °C with shaking for 4 h. Cells were harvested by centrifugation at 5000 × g at 4 °C for 20 min and disrupted by sonication in buffer A containing 20 mM Tris–HCl, pH 7.3, and 150 mM NaCl. Lysed cells were centrifuged at 12 000 × g for 30 min and the supernatant was decanted for further manipulation. The fusion SARS‐CoV Mpro was purified by affinity purification using HiTrapTM Chelating column (Amersham Biosciences), cleaved with factor Xa to release the N‐terminal His‐tag, and the recombinant SARS‐CoV Mpro with amino acid sequence identical to authentic SARS‐CoV Mpro was further purified by anion‐exchange chromatography using Q Sepharose Fast Flow column (Amersham Biosciences) followed by size exclusion chromatography using HiLoadTM 16/60 Superdex 75 column (Amersham Biosciences).
2.3. HPLC‐based cleavage assay
A synthetic peptide with the sequence H2N‐TSAVLQ ↓ SGFRKW‐COOH (SP1) mimicking the autolytic cleavage site (the cleavage site is indicated with a ↓) of the N‐terminal part of Mpro was synthesized by SynPep Corporation. Cleavage assays were first carried out at 25 °C in buffer A with 200 nM of purified SARS‐CoV Mpro and 500 μM of the synthetic substrate. The cleavage products were resolved by HPLC using a SOURCETM 5RPC column (2.1 mm × 150 mm) (Amersham Biosciences) with a 20 min linear gradient of 10–30% acetonitrile in 0.1% trifluoroacetic acid. The absorbance was determined at 215 or 280 nm and peak areas were integrated to quantify the cleavage products. The kinetic parameters were determined by Lineweaver–Burk plot using 0.6–2.4 mM of synthetic substrate SP1 with 200 nM of Mpro in identical conditions. The identities of the cleavage products were confirmed by mass spectrometry (Genome Research Centre, the University of Hong Kong).
2.4. Fluorescence‐based kinetic analysis
A synthetic fluorogenic peptide DABCYL‐SAVLQ ↓ SGFRK‐EDANS (SP2) mimicking the autolytic cleavage site (the cleavage site by SARS‐CoV Mpro is indicated with a ↓) was synthesized by SynPep Corporation. Cleavage of the fluorogenic peptide was monitored continuously by a F‐4500 fluorescence spectrophotometer (Hitachi) using an excitation wavelength of 355 nm (10 nm slit) and emission wavelength of 495 nm (10 nm slit). Standard assay conditions were buffer A at 25 °C. Initial fluorescence was measured for substrate concentrations from 2.5 to 50 μM. To establish the linearity between enzyme concentration and rate of cleavage, the initial rate of change of fluorescence was measured at several SARS‐CoV Mpro concentrations (100–800 nM) using 5 μM fluorogenic peptide as substrate. Assuming that the substrate concentration used was much lower than the K m of SARS‐CoV Mpro, we determined the kinetic parameters and fluorescent properties of the substrate using the following equations
 |
(1) |
 |
(2) |
where F t is the fluorescence intensity measured at a given time (t) during the reaction, F o is the intensity of the substrate prior to the addition of enzyme, F f is the intensity of the product when all the substrates were cleaved with sufficient Mpro within a period of 30 min, and [E] is the concentration of SARS‐CoV Mpro used in the reaction. Values of k cat/K m were determined either by non‐linear least squares regression analysis of all data using Eq. (1) or by linear least squares regression analysis of initial velocity data using Eq. (2).
2.5. HTS for inhibitors of SARS‐CoV Mpro
HTS was performed in quadruplicate in black polypropylene 96‐well plates (Greiner bio‐one). Two microliters of the 104 compounds (1.0 mg/ml in dimethyl sulfoxide (DMSO)) was added to individual wells. Fifty microlitersof 10 μM fluorogenic peptide in Buffer A was then delivered into each well with a QFill2 liquid dispenser (Genetix). The reaction was initiated by addition of 50 μl of 200 nM SARS‐CoV Mpro in buffer A with the QFill2 liquid dispenser. Fluorescence intensity was then measured with a Fusion Universal Plate Reader (Perkin–Elmer Life Sciences) using an excitation wavelength of 335 nm and emission wavelength of 535 nm. Fluorescence intensity change of each well was calculated and then normalized to mean values when no compound was added.
2.6. K i of inhibitors of SARS‐CoV Mpro
For determination of K i of identified inhibitors, cleavage assays were carried out at 25 °C in buffer containing 20 mM Tris–HCl, pH 7.3, 150 mM NaCl, and 1% DMSO, with or without inhibitors. Two hundred nanomolar of purified SARS‐CoV Mpro was pre‐incubated with the buffer for 30 min and fluorogenic substrate SP2 was added to a final concentration of 5 μM to initiate the reaction. Values of K i were determined by non‐linear least squares regression analysis of data fitted to the following equation
 |
(3) |
where (k cat/K m)i and (k cat/K m)o are values in the presence and absence of inhibitors, respectively, and [I] is the total concentration of inhibitor added. At least six concentrations of inhibitors were used to obtain final K i values.
2.7. Cell‐based antiviral assays
SARS‐CoV strain HKU 39849 was isolated from a SARS patient in Hong Kong. The degree of protection offered by the test compounds against SARS‐CoV infection was measured by Vero cell cytopathic effect (CPE) assay and plaque reduction assay (PRA). For CPE assay, Vero cells were seeded at 2 × 10⁴ cells per well (96‐well microtitre plate) in complete Eagle's minimal essential medium (EMEM) (Invitrogen) supplemented with 5% heat‐inactivated fetal bovine serum (FBS) (Invitrogen), with or without the addition of test compounds. One hundred TCID50 (50% tissue‐culture infectious dose) of SARS‐CoV was added subsequently to each well. Assay plates were incubated at 37 °C in 5% CO2 and CPE of the infected cells were recorded 96 h post infection using a Leica DMIL inverted microscope equipped with DC300F digital imaging system (Leica Microsystems). For PRA, one hundred plaque forming units (PFU) of SARS‐CoV were added to individual wells of 24‐well tissue culture plates (TPP) seeded with a confluent monolayer of Vero cells (1 × 10⁵ cells per well) in EMEM with 1% FBS. Plates were incubated at 37 °C in 5% CO2 for 1 h. One millilitre of overlay (1% low‐melting agarose in EMEM with 1% FBS and appropriate concentrations of inhibitors) was added to each well after the media were aspirated. After 48 h of incubation at 37 °C in 5% CO2, cells were fixed by adding 1 ml of 10% formaldehyde and the agarose plugs removed. Cells were stained with 0.5% crystal violet in 70% methanol and the viral plaques counted. Experiments were carried in quadruplicate and dose response data were best fit to logistic equation in SigmaPlot 8.0 (SPSS). The cytotoxicity of the inhibitors was determined by MTT (3‐[4,5‐dimethylth‐iazol‐2‐yl]‐2,5‐diphenyltetrazolium bromide) assay (Roche) according to the manufacturer's instructions. All procedures involving manipulation of live SARS‐CoV were carried out in a biological safety level 3 containment laboratory.
3. Results
3.1. Biosynthesis and purification of recombinant SARS‐CoV Mpro
The His‐tag recombinant SARS‐CoV Mpro was successfully expressed in E. coli and the full length authentic SARS‐CoV Mpro was purified to homogeneity after affinity chromatography, factor Xa cleavage, anion‐exchange chromatography, and size‐exclusion chromatography. The described protocol yields 10 mg of purified protein from 4 liters of culture. The employment of a synthetic substrate SP1 mimicking the putative autolytic cleavage site of the N‐terminal part of Mpro in the HPLC‐based cleavage assay established the specificity of the purified SARS‐CoV Mpro (Fig. 1A ). The turnover number of SARS‐CoV Mpro and K m on synthetic peptide SP1 was found to be 0.54 ± 0.04 s−1 and 2.3 ± 0.6 × 10⁻⁴ M, respectively, by Lineweaver–Burk plot and the k cat/K m was calculated to be 2.4 ± 0.6 × 10³ M−1 s−1 (Fig. 1B).
Figure 1.
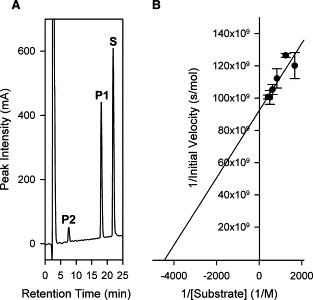
(A) Specific cleavage of synthetic peptide SP1 by purified SARS‐CoV Mpro. P1 and P2, cleavage products; S, uncleaved synthetic substrate SP1. (B) Lineweaver–Burk plot for the determination of SARS‐CoV Mpro kinetic parameters in HPLC‐based assays. The K m and k cat of the SARS‐CoV Mpro for substrate SP1 were determined by incubation of SP1 at different concentrations varying from 0.6 to 2.4 mM with 200 nM of SARS‐CoV Mpro in 20 mM Tris–HCl, pH 7.3, and 150 mM NaCl under conditions described in Section 2. The initial rates of cleavage were determined under the condition that 5–10% of the total substrate was cleaved. Experiments were carried out in triplicates and data points are expressed as means ± S.D.
3.2. Fluorescence‐based kinetic analysis
The linearity of the initial fluorescence intensity gradually lost at concentrations above 10 μM of SP2 (Fig. 2A ), a property very similar to a fluorogenic peptide designed for cytomegalovirus (CMV) 3C‐like protease [15]. When 5 μM of SP2 was used, the initial rate of change of fluorescence intensity increased in a linear fashion with 100–800 nM of SARS‐CoV Mpro (Fig. 2B), indicating the usefulness of using this fluorescence‐based substrate to conduct kinetic studies under the specified conditions. Using 5 μM of SP2 and 100–600 nM of SARS‐CoV Mpro, a k cat/K m value of 2.9 ± 0.2 × 10⁴ M−1 s−1 was obtained by applying (1), (2).
Figure 2.
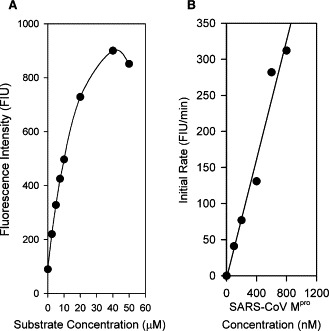
(A) Initial fluorescence intensity of fluorogenic substrate SP2. Results are expressed as fluorescence intensity units (FIU). (B) Initial cleavage rate of SP2 by SARS‐CoV Mpro. 0–800 nM of purified SARS‐CoV Mpro were used in the experiment.
3.3. HTS for inhibitors of SARS‐CoV Mpro
The 104 compounds were screened at 20 μg/ml. The rate of change of fluorescence intensity was normalized to control in the absence of inhibitors and the results are shown in Fig. 3 . Ten compounds exhibited greater than 50% reduction in the rate of change of fluorescence intensity when compared to the control in the absence of inhibitors and were therefore selected for further evaluations. Some of the hits were expected to be false positives because of delivery errors, light scattering, or optical absorbance of test compounds. The final evaluation of inhibitors was to be performed with a rigorous HPLC‐based cleavage assay that is not subject to these artifacts. Of the 10 compounds tested at a concentration of 20 μg/ml with 200 nM SARS‐CoV Mpro and 200 μM SP1 using the HPLC‐based assay, two exhibited >50% inhibitory effects on the Mpro and were therefore regarded as true inhibitors (data not shown). The two identified inhibitors were designated MP576 and MP521 and their chemical structures are shown in Fig. 4 .
Figure 3.
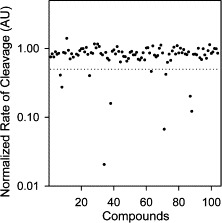
HTS of small molecule inhibitors of SARS‐CoV Mpro using fluorogenic substrate SP2. The initial cleavage rates of SARS‐CoV Mpro on fluorogenic substrate SP2 in the presence of the test compounds (104 compounds) were normalized to values in the absence of compounds and expressed as arbitrary units (AU). Dotted line indicates 0.5 AU.
Figure 4.
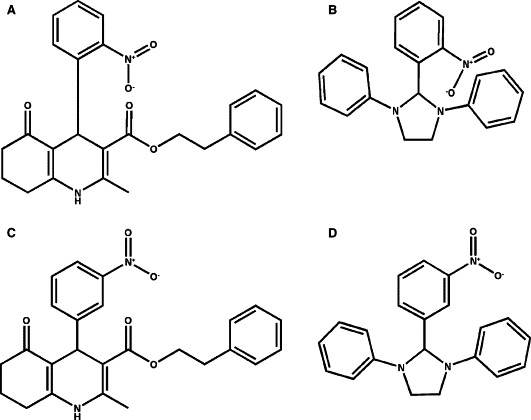
Chemical structures of SARS‐CoV Mpro inhibitors and their chemical analogues. (A) Chemical structure of MP576 (3‐quinolinecarboxylic acid, 1,4,5,6,7,8‐hexahydro‐2‐methyl‐4‐(2‐nitrophenyl)‐5‐oxo‐, 2‐phenylethyl ester). (B) Chemical structure of MP521 (2‐(2‐nitrophenyl)‐1,3‐diphenyl‐imidazolidine). (C) Chemical structure of CB5751. (D) Chemical structure of CB5173. CB5751 is an analogue of MP576 and CB5173 is an analogue of MP521.
3.4. K i of inhibitors of SARS‐CoV Mpro
To determine the values of K i, the concentration of the inhibitors was converted to molar units for more precise comparison of their inhibitory activities. The K i values of MP576 and MP521 were calculated (applying Eq. (3)) to be 2.9 ± 0.3 and 11 ± 2 μM, respectively, using fluorogenic substrate SP2 (Table 1 ).
Table Table 1.
Anti‐SARS‐CoV properties of MP576 and MP521
| Compound | K i (μM) | EC50 (μM) | TC50 (μM) |
|---|---|---|---|
| MP576 | 2.9 ± 0.3 | 7 ± 2 | >50 |
| MP521 | 11 ± 2 | 14 ± 4 | >50 |
3.5. Cell‐based antiviral assays
At 10 μg/ml concentration, both inhibitors MP576 and MP521 protected the monolayer of Vero cells from SARS‐CoV induced CPE (Fig. 5 ), indicating the promising antiviral activities and the non‐toxic properties of these two compounds at the concentration tested. In addition, MP576 and MP521 inhibited the SARS‐CoV plaque formation in Vero cells in a concentration dependent manner with EC50 (median effective concentration) values of 7 ± 2 and 14 ± 4 μM, respectively (Table 1), demonstrating that the protective effects observed were indeed due to the presence of Mpro inhibitors. Furthermore, the TC50 (median toxic concentration) values of MP576 and MP521 were determined to be >50 μM (Table 1), indicating that these two compounds are not cytotoxic at their effective antiviral concentrations.
Figure 5.

Anti‐SARS‐CoV activities of MP576 and MP521. (A) Vero cells infected with 100 TCID50 SARS‐CoV. (B) Vero cells infected with 100 TCID50 SARS‐CoV in the presence of 20 μg/ml of MP576. (C) Vero cells infected with 100 TCID50 SARS‐CoV in the presence of 20 μg/ml of MP521. CPE were recorded 96 h post infection. Experiments were carried out in duplicate and repeated twice.
4. Discussion
We set out to clone and to characterize the SARS‐CoV Mpro with the intention to develop an assaying system amendable for HTS operations for isolating potential drug leads targeting this “essential” component of the SARS‐CoV. Since the additional amino acid sequence present in recombinant Mpro resulting from cloning procedures might have undesirable properties in in vitro or in vivo assaying systems, we engineered the recombinant SARS‐CoV Mpro in a way that the final purified recombinant SARS‐CoV Mpro will have amino acid sequence identical to that of the authentic SARS‐CoV Mpro. After successive purifications employing affinity chromatography, factor Xa cleavage, anion‐exchange chromatography, and size‐exclusion chromatography, we obtained a purified SARS‐CoV Mpro with a k cat/K m value=2.4 × 10³ M−1s−1 using synthetic substrate SP1 and a k cat/K m value=2.9 × 10⁴ M−1 s−1 using fluorogenic substrate SP2. The kinetic parameters obtained were comparable to that of other viral 3C‐like proteases reported [16, 17]. We noticed that the k cat/K m value (calculated to be 1.8 × 10² M−1 s−1) published by Lai's group on a synthetic peptide substrate (H2N‐TSAVLQSGFRK‐COOH) [18, 19] is about 10‐fold lower than the one we obtained with our synthetic peptide substrate SP1 (H2N‐TSAVLQSGFRKW‐COOH; k cat/K m value=2.4 × 10³ M−1 s−1). Aside from differences in purification procedures and assaying conditions, and slight difference in amino acid sequence between the two peptides, we do not have an explanation for the apparent discrepancy between the results obtained by the two groups.
The fluorogenic substrate SP2 used in the study is very sensitive for assaying the cleavage activity of the SARS‐CoV Mpro. As little as 6.5 nM of the SARS‐CoV Mpro could be detected in the assaying system we employed (data not shown). This ultra‐sensitive substrate, however, could not be used at concentrations higher than 10 μM due to its internal quenching effects [15]; this property rendered SP2 unsuitable for the determination of K m of the assay system. Nevertheless, SP2 has been demonstrated to be an excellent substrate for HTS purposes and for evaluation of inhibitor potencies.
The two small molecule compounds identified in our study are novel non‐peptide inhibitors of SARS‐CoV Mpro. The fact that they inhibited the SARS‐CoV Mpro with K i values around 10 μM protected Vero cells from viral infection at comparable concentrations and exhibited low cytotoxicity towards Vero cells makes them promising leads for anti‐SARS drug development. Further investigations using analogues (CB5751 and CB5173) of these two SARS‐CoV Mpro inhibitors suggested that the position of the nitro group in both inhibitors contributes substantially to their inhibitory activities; changing the 2‐nitro group to 3‐nitro group (Fig. 4C, D) readily reduced the compounds' ability to inhibit the SARS‐CoV Mpro (Fig. 6 ). We speculate that the 2‐nitro group may be involved in forming productive bonding in the inhibitor‐enzyme complex. Further structure‐activity relationship studies employing more analogues of the identified compounds and site‐directed mutagenesis with the SARS‐CoV Mpro will help us to elucidate the mode of actions of these two novel inhibitors. While this manuscript is in preparation, a number of groups reported the cloning and production of different versions of the SARS‐CoV Mpro [20, 21]. Others described the development of in vitro assays for screening SARS‐CoV Mpro inhibitors [22, 23]. We report here the detailed kinetic analysis of a recombinant SARS‐CoV Mpro with amino acid sequence identical to that of the authentic SARS‐CoV Mpro and the successful identification of potent small molecule inhibitors of the Mpro with demonstrated anti‐SARS‐CoV activities in cellular models. With the establishment of assaying systems to examine the in vitro cleavage and the cellular anti‐SARS‐CoV activities, we can now start lead optimization by using focused combinatorial chemical libraries to understand the structure‐activities relationship of the two leads and to yield compounds with far superior antiviral activities.
Figure 6.
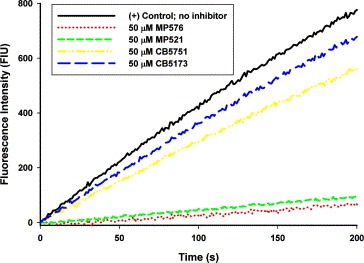
Inhibitory activity of analogues of MP576 and MP521 on SARS‐CoV Mpro. The cleavage of 10 μM of the fluorogenic substrate SP2 by 200 nM of purified SARS‐CoV Mpro in 20 mM Tris‐HCl, pH 7.3, and 150 mM NaCl at 25 °C was monitored continuously by a fluorescence spectrophotometer in the presence or absence of 50 μM of different compounds. Background fluorescence was subtracted for clarity of comparison. Experiments were carried out in duplicate and mean value of each data point was used for plotting.
Acknowledgements
We thank K. H. Chan for providing SARS‐CoV stocks and Genome Research Centre, the University of Hong Kong for mass spectrometry analysis. The work was supported by Vice‐Chancellor SARS Fund, HKU SARS Donation Fund, HKU seed grant for basic research, University DBS SARS Research Fund, and Research Fund for the Control of Infectious Diseases.
Kao Richard Y.,To Amanda P.C.,Ng Louisa W.Y.,Tsui Wayne H.W.,Lee Terri S.W.,Tsoi Hoi-Wah and Yuen Kwok-Yung(2004), Characterization of SARS-CoV main protease and identification of biologically active small molecule inhibitors using a continuous fluorescence-based assay, FEBS Letters, 576, doi: 10.1016/j.febslet.2004.09.026
References
- 1. World Health Organization (WHO). Available from http://www.who.int/csr/sars/en/
- 2. Peiris J.S., Lai S.T., Poon L.L., Guan Y., Yam L.Y., Lim W., Nicholls J., Yee W.K., Yan W.W., Cheung M.T., Lancet, 361, (2003), 1319– 1925. [DOI] [PMC free article] [PubMed] [Google Scholar]
- 3. Ksiazek T.G., Erdman D., Goldsmith C.S., Zaki S.R., Peret T., Emery S., Tong S., Urbani C., Corner J.A., Lim W., N. Engl. J. Med, 348, (2003), 1953– 1966. [DOI] [PubMed] [Google Scholar]
- 4. Drosten C., Gunther S., Preiser W., van der Werf S., Brodt H.R., Becker S., Rabenau H., Panning M., Kolesnikova L., Fouchier R.A., N. Engl. J. Med, 348, (2003), 1967– 1976. [DOI] [PubMed] [Google Scholar]
- 5. Rota P.A., Oberste M.S., Monroe S.S., Nix W.A., Campagnoli R., Icenogle J.P., Penaranda S., Bankamp B., Maher K., Chen M.H., Science, 300, (2003), 1394– 1399. [DOI] [PubMed] [Google Scholar]
- 6. Marra M.A., Jones S.J., Astell C.R., Holt R.A., Brooks-Wilson A., Butterfield Y.S., Khattra J., Asano J.K., Barber S.A., Chan S.Y., Science, 300, (2003), 1399– 1404. [DOI] [PubMed] [Google Scholar]
- 7. Anand K., Ziebuhr J., Wadhwani P., J. Mesters R., Hilgenfeld R., Science, 300, (2003), 1763– 1767. [DOI] [PubMed] [Google Scholar]
- 8. Yan L., Velikanov M., Flook P., Zheng W., Szalma S., Kahn S., FEBS Lett, 554, (2003), 257– 263. [DOI] [PMC free article] [PubMed] [Google Scholar]
- 9. Yang H., Yang M., Ding Y., Liu Y., Lou Z., Zhou Z., Sun L., Mo L., Ye S., Pang H., Proc. Natl. Acad. Sci. USA, 100, (2003), 13190– 13193. [DOI] [PMC free article] [PubMed] [Google Scholar]
- 10. Takeda-Shitaka M., Nojima H., Takaya D., Kanou K., Iwadate M., Umeyama H., Chem. Pharm. Bull. (Tokyo), 52, (2004), 643– 645. [DOI] [PubMed] [Google Scholar]
- 11. Toney J.H., Navas-Martin S., Weiss S.R., Koeller A., J. Med. Chem, 47, (2004), 1079– 1080. [DOI] [PubMed] [Google Scholar]
- 12. Jenwitheesuk E., Samudrala R., Bioorg. Med. Chem. Lett, 13, (2003), 3989– 3992. [DOI] [PMC free article] [PubMed] [Google Scholar]
- 13. Xiong B., Gui C.S., Xu X.Y., Luo C., Chen J., Luo H.B., Chen L.L., Li G.W., Sun T., Yu C.Y., Yue L.D., Duan W.H., Shen J.K., Qin L., Shi T.L., Li Y.X., Chen K.X., Luo X.M., Shen X., Shen J.H., Jiang H.L., Acta Pharmacol. Sin, 24, (2003), 497– 504. [PubMed] [Google Scholar]
- 14. Zhang X.W., Yap Y.L., Bioorg. Med. Chem, 12, (2004), 2219– 2223. [DOI] [PMC free article] [PubMed] [Google Scholar]
- 15. Holskin B.P., Bukhtiyarova M., Dunn B.M., Baur P., de Chastonay J., Pennington M.W., Anal. Biochem, 227, (1995), 148– 155. [DOI] [PubMed] [Google Scholar]
- 16. Webber S.E., Tikhe J., Worland S.T., Fuhrman S.A., Hendrickson T.F., Matthews D.A., Love R.A., Patick A.K., Meador J.W., Ferre R.A., Brown E.L., DeLisle D.M., Ford C.E., Binford S.L., J. Med. Chem, 39, (1996), 5072– 5082. [DOI] [PubMed] [Google Scholar]
- 17. Kati W.M., Sham H.L., McCall J.O., Montgomery D.A., Wang G.T., Rosenbrook W., Miesbauer L., Buko A., Norbeck D.W., Arch. Biochem. Biophys, 362, (1999), 363– 375. [DOI] [PubMed] [Google Scholar]
- 18. Fan K., Wei P., Feng Q., Chen S., Huang C., Ma L., Lai B., Pei J., Liu Y., Chen J., Lai L., J. Biol. Chem, 279, (2004), 1637– 1642. [DOI] [PMC free article] [PubMed] [Google Scholar]
- 19. Huang C., Wei P., Fan K., Liu Y., Lai L., Biochemistry, 43, (2004), 4568– 4574. [DOI] [PubMed] [Google Scholar]
- 20. Sun H., Luo H., Yu C., Sun T., Chen J., Peng S., Qin J., Shen J., Yang Y., Xie Y., Chen K., Wang Y., Shen X., Jiang H., Protein Expr. Purif, 32, (2003), 302– 308. [DOI] [PMC free article] [PubMed] [Google Scholar]
- 21. Shi J., Wei Z., Song J., J. Biol. Chem, 279, (2004), 24765– 24773. [DOI] [PMC free article] [PubMed] [Google Scholar]
- 22. Bacha U., Barrila J., Velazquez-Campoy A., Leavitt S.A., Freire E., Biochemistry, 43, (2004), 4906– 4912. [DOI] [PubMed] [Google Scholar]
- 23. Kuo C.J., Chi Y.H., Hsu J.T., Liang P.H., Biochem. Biophys. Res. Commun, 318, (2004), 862– 867. [DOI] [PMC free article] [PubMed] [Google Scholar]


