Abstract
The intestinal mucosa serves as both a conduit for uptake of food-derived nutrients and microbiome-derived metabolites and as a barrier that prevents tissue invasion by microbes and tempers inflammatory responses to the myriad contents of the lumen. How the intestine coordinates physiological and immune responses to food consumption to optimize nutrient uptake while maintaining barrier functions remains unclear. Here we show in mice how a gut neuronal signal triggered by food intake is integrated with intestinal antimicrobial and metabolic responses controlled by type 3 innate lymphoid cells (ILC3)1–3. Food consumption rapidly activates a population of enteric neurons that express vasoactive intestinal peptide (VIP)4. Projections of VIP-producing neurons (VIPergic neurons) in the lamina propria are in close proximity to clusters of ILC3 that selectively express VIP receptor type 2 (VIPR2; also known as VPAC2). Production of interleukin (IL)-22 by ILC3, which is up-regulated by commensal microbes such as segmented filamentous bacteria (SFB)5–7, is inhibited upon engagement of VIPR2. As a consequence, there is a reduction in epithelial cell-derived antimicrobial peptide, but enhanced expression of lipid-binding proteins and transporters8. During food consumption, activation of VIPergic neurons thus enhances growth of epithelial-associated SFB and increases lipid absorption. Our results reveal a feeding- and circadian-regulated dynamic intestinal neuro-immune circuit that promotes a trade-off between IL-22-mediated innate immune protection and efficiency of nutrient absorption. Modulation of this pathway may hence be effective for enhancing resistance to enteropathogen2,3,9 and for treatment of metabolic diseases.
Type 3 innate lymphoid cells (ILC3) promote intestinal immune and metabolic homeostasis by integrating cytokine-mediated and glia-derived cues and conveying information from the luminal microbiota to intestinal epithelial cells (IECs) and cells in the lamina propria1–3,5,10. The activation of ILC3 is regulated by cytokines, including IL-23, IL-1β, and TL1A, which are produced by mononuclear phagocytes and induced by intestinal microbe-derived stimuli5,7,11. Cytokines produced by activated ILC3, particularly IL-22, support the production of antimicrobial peptides (e.g. RegIIIγ) and mucin by IECs, ensuring spatial segregation of microbes from the intestinal tissue12,13. This microbiota-ILC3-IEC circuit promotes intestinal barrier function by controlling intestinal commensal microbiota and mediating rapid protective responses to enteropathogens2,3,9,12. Here, we investigate how a subset of enteric neurons coordinate ILC3 cytokine production to regulate the intestinal barrier in a circadian manner.
ILC3 clusters interact with lamina propria VIPergic neurons
Different subtypes of ILC3s are present within the intestinal lamina propria and are dispersed or in tertiary lymphoid tissue clusters known as cryptopatches (CPs) and isolated lymphoid follicles (ILFs)14,15. We noticed that CCR6+ILC3, which comprise the lymphoid tissue inducer (LTi) cells enriched in CPs and ILFs, selectively express multiple neurotransmitter/neuropeptide receptors and genes related to axonal guidance and neuron differentiation (Fig. 1a and Extended Data Fig. 1a–c)16,17. This prompted us to evaluate whether these cells were associated with projections from the enteric nervous system (ENS), which controls gastrointestinal functions in response to luminal changes (e.g. food intake, microbes, metabolites)18–22. We observed that ILC3 in ileum CPs/ILFs and colon lymphoid patches were in close proximity to lamina propria neurons (Fig. 1b–d and Supplementary Videos 1,2) that were positive for vasoactive intestinal peptide (VIP), but negative for substance P or tyrosine hydroxylase, on antibody staining (Fig. 1e,f and Extended Data Figs. 2 and 3). These anatomical findings, together with the observation that intestinal CCR6+ILC3, but not T cells, express VIP receptor type 2 (Vipr2) (Fig. 1a and extended Data Figure 4a), prompted us to investigate the role of VIPergic neurons in CCR6+ILC3-regulated intestinal immune homeostasis.
Figure 1. Processes of VIP-producing enteric neurons are in close proximity to Vipr2-expressing ILC3 within cryptopatches.
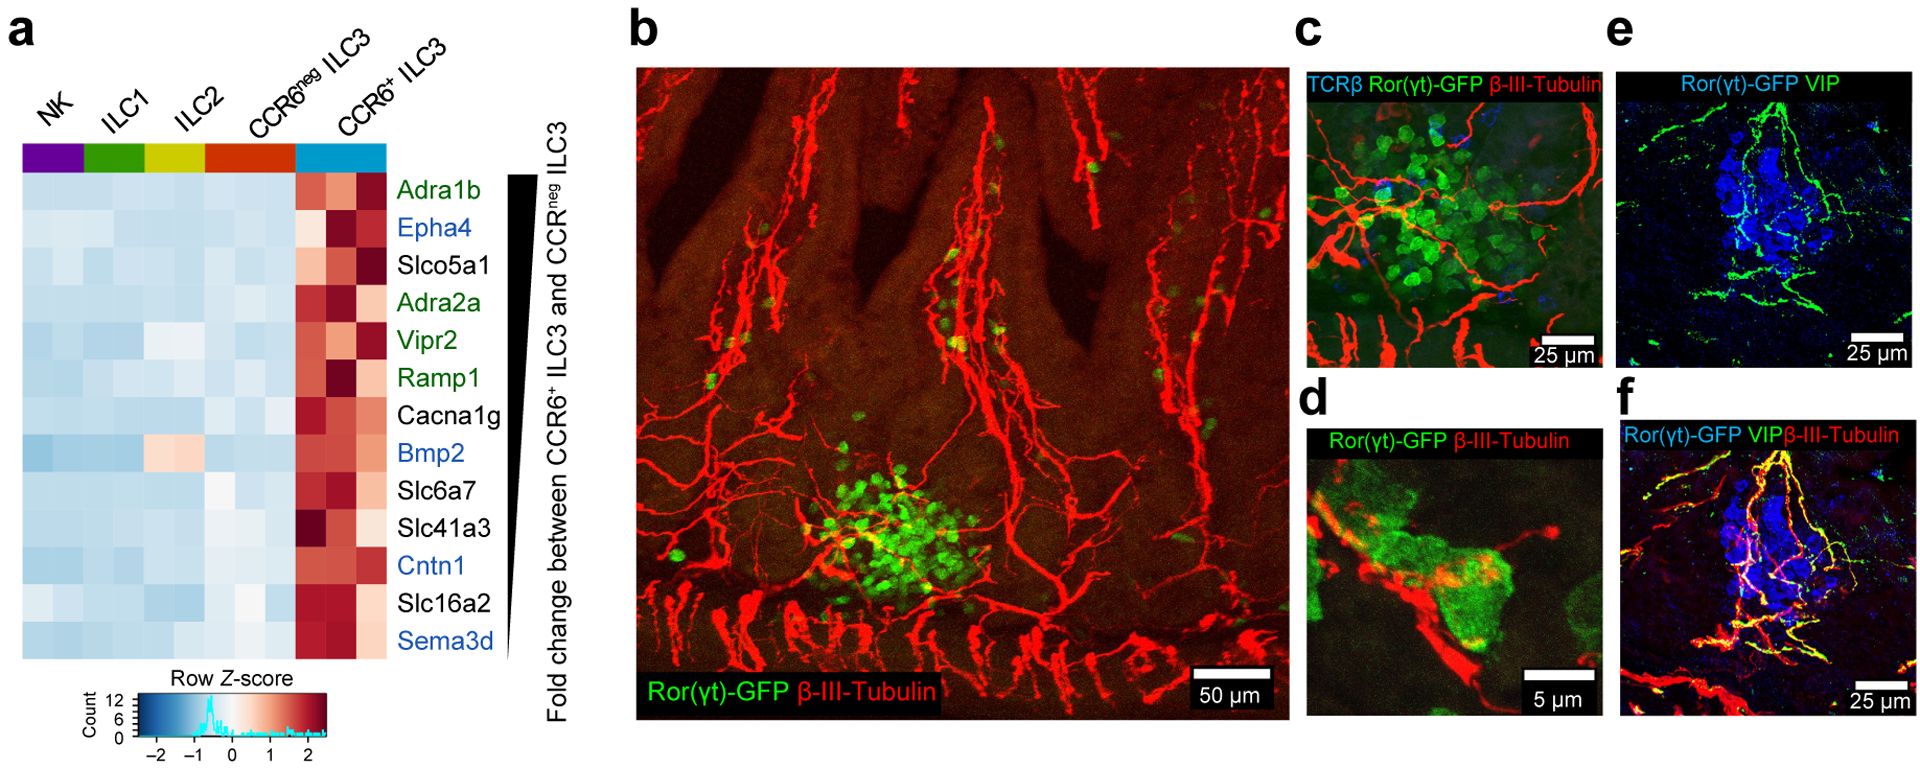
a, Heatmap of differentially expressed neural-related genes of small intestine CCR6+ ILC3 and other ILCs (Fold change ≥ 2, Wald test p-value <0.05, n=2 or 3 independent biological samples, GSE116092). Color scale is based on normalized read counts. Genes listed at right are ranked based on relative fold change, and color coded: Green: Neurotransmitter/neuropeptide receptors, Blue: genes related to nervous system development/axonal guidance and contact. b-f, Representative confocal images from the small intestine of RORc(t)EGFP/+ mice. Clusters of intestinal ILC3 (cryptopatch) in close proximity to enteric neurons in the lamina propria (supplementary videos 1 and 2). Pan-neuronal marker: β3-tubulin+ (red), ILC3: GFP+TCRβneg (green and blue, respectively). 110 ILC3 clusters were analyzed and all exhibited β3-tubulin+ fibers interacting with ILC3 (n=4 mice). VIP staining (e,f); 40 ILC3 clusters analyzed, with all displaying VIP+ β3-tubulin+ fibers interacting with ILC3 (n=4 mice).
VIP-mediated inhibition of CCR6+ILC3 modulates mucosal barrier function
IL-23-induced cytokine production by cultured CCR6+ILC3 was inhibited by VIPR2 agonists (Fig. 2a,b and Extended Data Fig. 4b–e), although there was no effect on cell activation (Sca-1 up-regulation5) or IL-22 production by CCR6negILC3 (Extended Data Fig. 4f–h). To investigate the in vivo effect of VIPR2 activation, we generated mixed bone marrow chimeric mice and observed IL-22 production in a greater proportion of Vipr2−/− than Vipr2+/+ CCR6+ ILC3 (Extended Data Fig 5a,b). Transcriptomic analysis of these cells revealed up-regulation of genes involved in retinoic acid-mediated signaling (Rxra) and translation initiation (Eif5a) in the absence of Vipr2 (Extended Data Fig 5c–e). In mice with conditional deletion of Vipr2 in RORγt+ cells (RORc(t)CreVipr2fl/fl), a larger proportion and number of ex vivo unstimulated ileal CCR6+ILC3 produced IL-22 and IL-17A than cells from control littermates (Fig. 2c and Extended Data Fig. 5f–k), but there was no difference in cytokine production among RORγt+ T cells (Extended Data Fig. 5l,m). Due to low expression of IL-17A in CCR6+ILC3, we focused our attention on regulation of IL-22-mediated barrier functions promoted by VIPR2 signaling. RegIIIγ mRNA, regulated by IL-22, was considerably higher in ileal extracts enriched for intestinal epithelial cells (ieIECs) from RORc(t)CreVipr2fl/fl mice than from RORc(t)CreVipr2+/+ mice (Fig. 2d). In addition, small intestine villi and crypt lengths, and frequency of proliferating cells (Ki67+) in crypts, were increased in RORc(t)CreVipr2fl/fl mice (Extended Data Fig. 5n–q), consistent with in vivo effects of chronic IL-22 overexpression or treatment23,24.
Figure 2. VIPR2-dependent inhibition of CCR6+ILC3 and epithelial antimicrobial response.
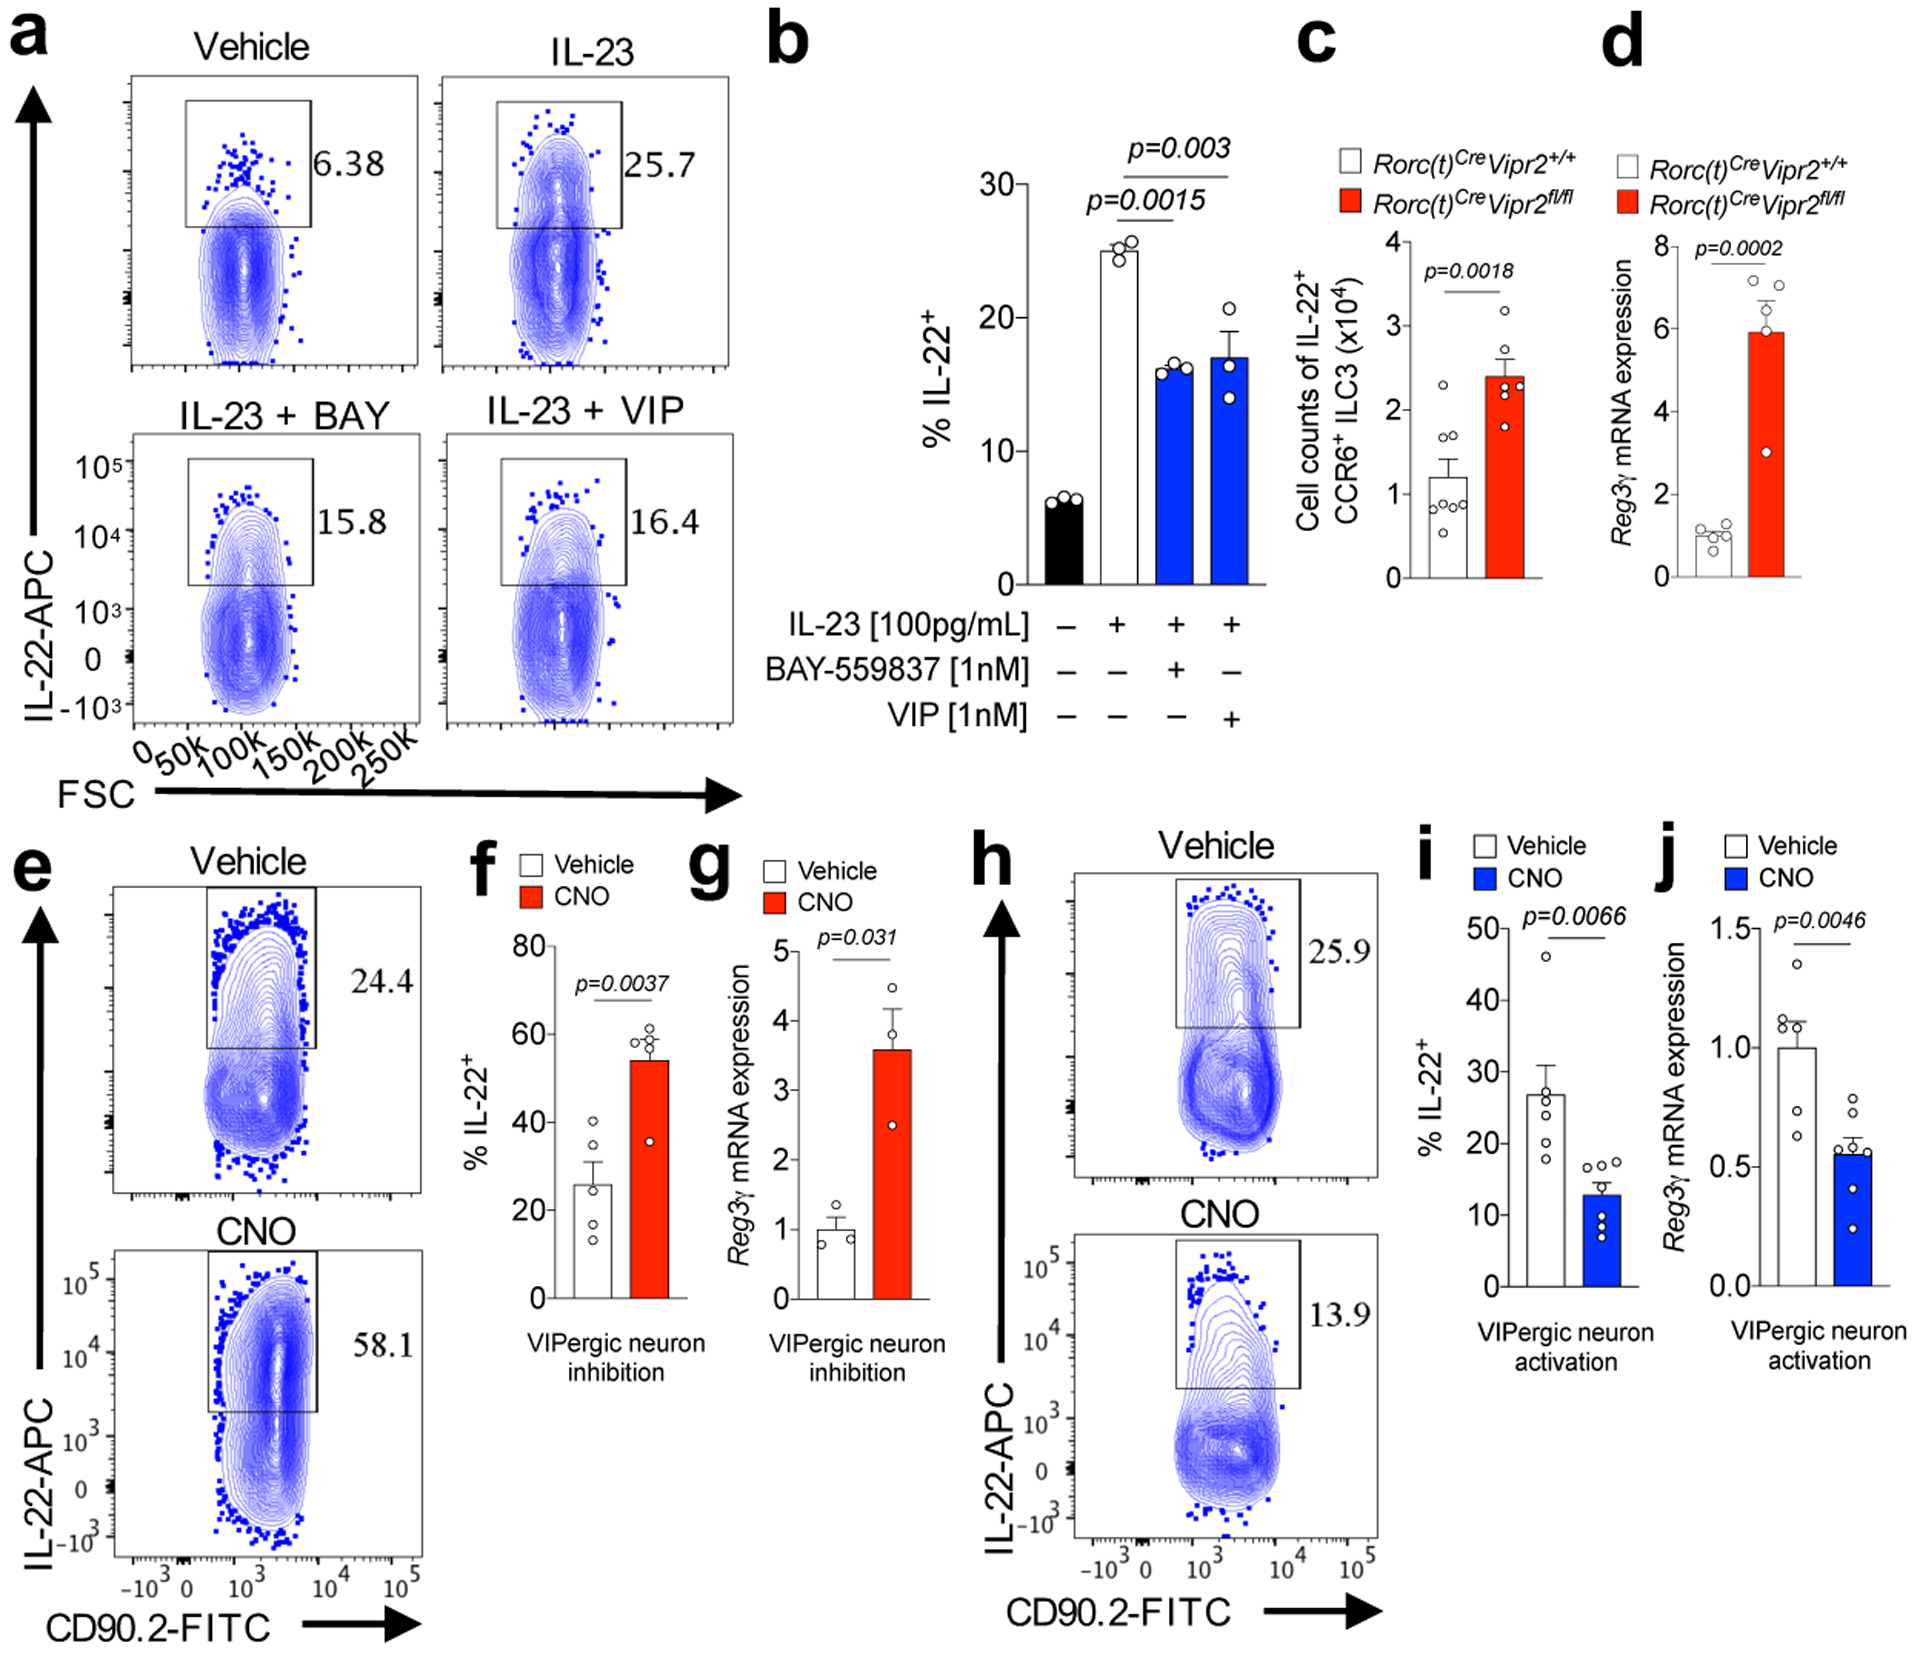
a, b, IL-22 expression in purified CCR6+ILC3 after in vitro IL-23 stimulation ± VIPR2 ligands, BAY-559837 and VIP. n=3 independent biological samples, each stimulated in all 4 conditions. From 3 independent experiments. c, IL-22+CCR6+ILC3 numbers in the ileum of RORc(t)CreVipr2+/+ (n=8) and RORc(t)Cre Vipr2fl/f mice (n=6). From 3 independent experiments. d, RegIIIγ mRNA expression in ileal extracts enriched for IEC (ieIEC) from RORc(t)CreVipr2+/+ (n=5) and RORc(t)CreVipr2fl/f mice (n=5). From 2 independent experiments. e,f, IL-22 expression in CCR6+ ILC3 from the ileum of VipIRES-CrehM4Difl-stop-fl/+ mice (inhibitory DREADD) at 24h following treatment with vehicle (n=5 mice) or CNO (n=5 mice). From 3 independent experiments. g, RegIIIγ mRNA expression in ieIEC of inhibitory DREADD mice at 24h following treatment with vehicle (n=3 mice) or CNO (n=3 mice). From 2 independent experiments. h,i, IL-22 expression in CCR6+ILC3 from ileum of VipIRES-CrehM3Dqfl-stop-fl/+ (activating DREADD) at 24h following treatment with vehicle (n=6 mice) or CNO (n=7 mice). From 4 independent experiments. j, RegIIIγ mRNA expression ieIEC of activating DREADD mice at 24h following treatment with vehicle (n=6 mice) or CNO (n=7 mice). From 2 independent experiments. Graphs are Mean ± SEM. 2b: one-way ANOVA, Bonferroni’s correction; 2c,d,f,g,i,j: two-sided t-test.
To determine whether direct modulation of VIPergic neurons (inhibition or activation) affects ILC3 function, we adopted a chemogenetic strategy utilizing mice engineered to express designer receptors exclusively activated by designer drugs (DREADD)25 in VIP+ cells (Extended Data Figure 6a–c). With inhibitory DREADD (hM4Di) (VipIRES-CrehM4Difl-stop-fl/+ mice), there was a higher frequency of IL-22+CCR6+ILC3 in the small and large intestine at 24h following administration of the DREADD ligand clozapine-N-oxide (CNO, Fig. 2e,f and Extended Data Figure 6d,e). In parallel, there was increased RegIIIγ mRNA expression in ieIECs (Fig. 2g). Conversely, mice expressing the activating DREADD (hM3Dq) (VipIRES-CrehM3Dqfl-stop-fl/+ mice) had fewer IL-22+CCR6+ ILC3 in the small and large intestine, and lower RegIIIγ mRNA in ieIECs after CNO treatment (Fig. 2h–j and Extended Data Figure 6f). There were no differences in the frequency of cytokine-producing T cells after activation of VIPergic neurons (Extended Data Fig. 6g–h). Combined, these results indicate that VIPergic neurons modulate intestinal immune homeostasis, acting through VIPR2 on CCR6+ILC3 to inhibit cytokine production.
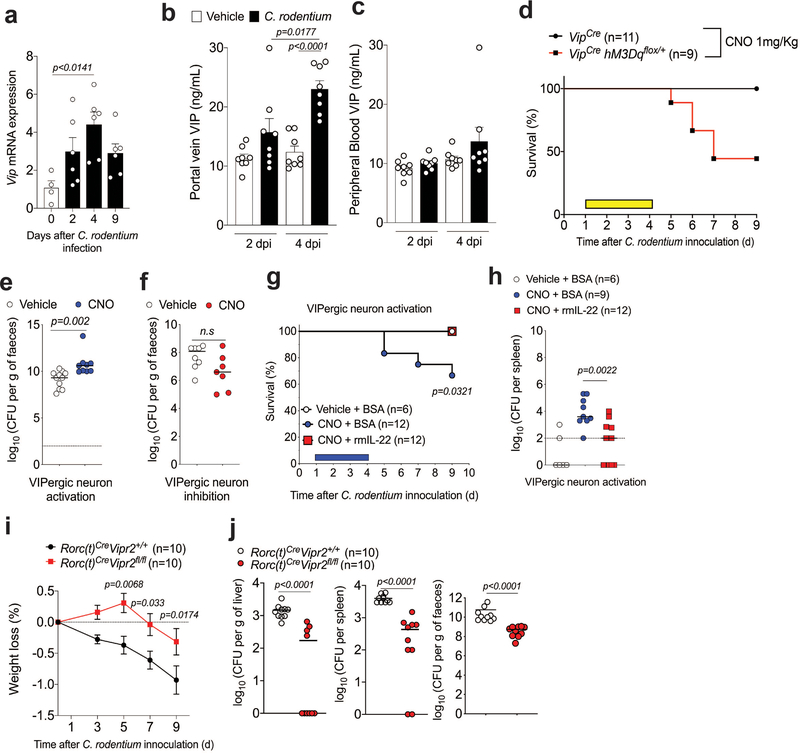
We next investigated whether VIPergic activity contributes to resistance to the enteropathogen Citrobacter rodentium. As previously described26, following infection there was increased Vip mRNA expression in the proximal colon and cecum and of VIP amounts in the portal vein, but not in peripheral blood (Extended Data Fig. 7a–c). After oral gavage with a typically well-tolerated dose of C. rodentium (2×10⁹ CFU), DREADD-mediated activation of VIPergic neurons led to increased bacterial translocation to spleen and liver (Fig. 3a,b) and reduced survival (Fig. 3c and Extended Data Fig 7d), despite only a moderate increase in luminal C. rodentium (Extended Data Fig. 7e). Gavage with a high dose of C. rodentium (4×10¹⁰ CFU) resulted in substantial bacterial translocation to liver and spleen, but DREADD-mediated inhibition of VIPergic neurons provided protection without affecting luminal bacterial burden (Fig 3d,e and Extended Data Fig. 7f). Treatment with recombinant murine IL-22 reversed the effect of DREADD-mediated activation of VIPergic neurons (Extended Data Fig. 7g,h). RORc(t)CreVipr2fl/fl mice exhibited enhanced protection after gavage with a high dose of C. rodentium (4×10¹⁰ CFU) when compared with RORc(t)CreVipr2+/+l mice (Extended Data Figure 7i,j). Activation of VIPergic neurons following enteropathogen infection may therefore contribute to intestinal barrier breakdown.
Figure 3. VIPergic signaling reduces mucosal barrier function.
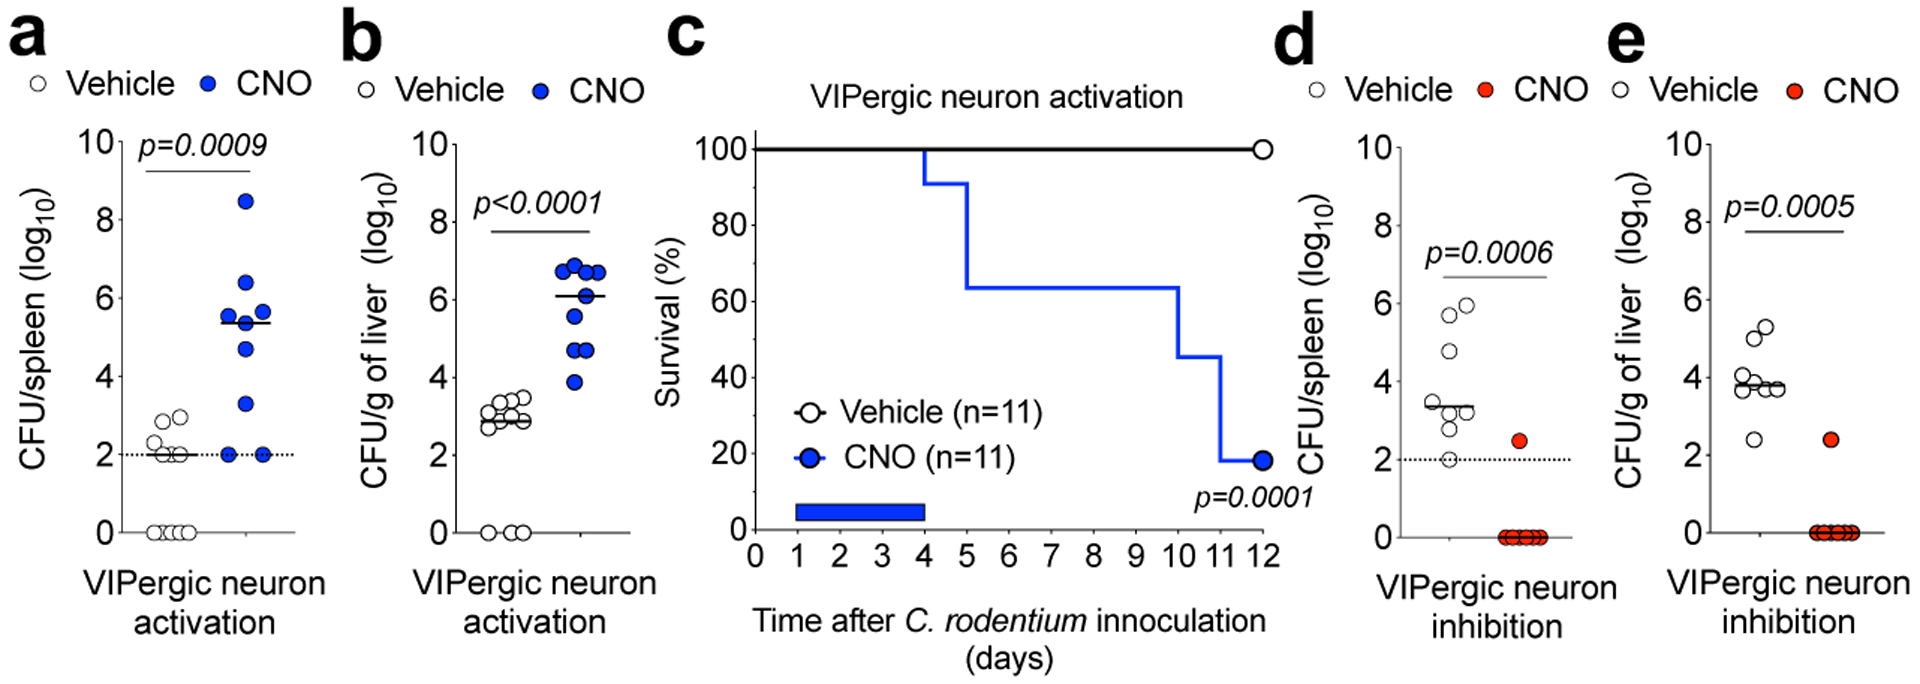
a, b, C. rodentium dissemination to (a) spleen and (b) liver in VipIRES-CrehM3Dqfl-stop-fl/+ mice treated with vehicle (n=11) or CNO (n=9) for 4 days post infection (d.p.i) with 2×10⁹ CFU. From 2 independent experiments. c, Survival for C. rodentium-infected VipIRES-CrehM3Dqfl-stop-fl/+ mice treated with vehicle (n=11 mice) or CNO (n=11). Mantel-Cox test. From 5 independent experiments. d, e, C. rodentium dissemination to (d) spleen and (e) liver of VipIRES-CrehM4Difl-stop-fl/+ mice treated with vehicle (n=8) or CNO (n=7) for 4 d.p.i with 4×10¹⁰ CFU. Dotted line: Detection limit; Median, two-sided Mann-Whitney test (a,b,d,e). From 4 independent experiments. Log10 Colony Forming Units (CFU) of C. rodentium at 9 d.p.i. CFU counts of 0 were attributed a value of 1 for visualization.
Feeding promotes VIPR2-dependent inhibition of intestinal CCR6+ILC3
Food ingestion has been reported to rapidly signal VIP release in the intestine4. Indeed, there was more VIP in the ileum of mice sampled during the vivarium’s dark-phase as compared to the light-phase, which correspond to periods of food consumption and resting, respectively (Extended Data Fig. 8a)27. To dissect the effect of food intake on the VIPergic immune inhibitory axis, we restricted food availability for two weeks to alternating 12h cycles of feeding and fasting, and dissociated from effects of light/dark cycle by providing food only during the dark-phase or light-phase (vide methods). There was more VIP in the portal vein, but not peripheral blood, after 6h of food availability than 6h fasting, regardless of when mice were fed phase (ZT6 or ZT18) (Extended Data Fig. 8b,c). In turn, frequency of IL-22+CCR6+ILC3 was reduced after 6h of food consumption relative to fasting for 6h, independently of light-dark cycle (Fig. 4a,b). However, there was no difference in frequency of IL-22+CCR6+ILC3 with or without feeding in RORc(t)CreVipr2fl/fl mice (Fig 4c,d). Similar results were observed with mixed bone marrow chimeric mice (Extended Data Figure 8d,e), consistent with VIPR2-dependent inhibition of IL-22 production in CCR6+ILC3 following food intake. This conclusion was further supported by the reduction in the frequency of IL-22+CCR6+ILC3 at 6h following intragastric delivery of a liquid test diet, but not saline, during the light-phase (ZT1-ZT7) (Fig 4e,f). Furthermore, DREADD-mediated inhibition of VIPergic neurons abrogated the effect of the test diet on ILC3 (Fig. 4e and 4f). These results suggest rapid and dynamic temporal control of intestinal CCR6+ILC3 function promoted by food intake-mediated activation of VIPergic signaling and VIPR2.
Figure 4. Feeding reduces IL-22 production by CCR6+ILC3 through activation of VIPergic neurons.

IL-22 expression among CCR6+ ILC3 from the ileum of mice, as indicated a, b, at 6h after feeding or fasting, at ZT6 and ZT18 (n=5 mice for each one of the 4 groups). From 2 independent experiments. c, d, RORc(t)CreVipr2+/+ (n=6) or RORc(t)CreVipr2fl/fl mice (n=6 mice) at 6h after fasting or 6h after feeding (n=7 mice for each) at ZT18. Data shown are pooled from 2 independent experiments and representative of 3 independent experiments. e, f, VipIRES-CrehM4Difl-stop-fl/+ mice were treated with vehicle or CNO and 30 minutes later were fed by intragastric administration of saline or Liquid Test Diet (every 45 minutes, for 6 h). n=4 mice/group. From 2 independent experiments. Data (b,d,f) are Mean ± SEM, two-sided t-test.
Postprandial changes in commensal microbiota promoted by the VIP-ILC3 axis
Because IL-22 acts on intestinal epithelial cells to regulate barrier functions, we next examined whether the neuroimmune inhibitory circuit promoted by food consumption influences host interactions with microbiota. There was IL-22-dependent elevation of RegIIIγ mRNA in ieIECs from mice fasted for 12h as compared to those fed for 12h (Fig. 5a). In parallel, food consumption had a striking effect on the morphology of the ileal epithelium-associated segmented filamentous bacteria (SFB), independently of light cycle (Fig. 5b–c and Extended Data Fig. 9a–c). SFB attached to IECs had long segmented filaments after 12h of feeding. However, in the ileum of mice fasted for 12h, epithelium-associated SFB had few segments and were stubble-like. In addition, there was an increase in the Firmicutes/Bacteroidetes ratio in the feces of mice after 12h of feeding compared to 12h of fasting, independently of light-cycle (Extended Data Fig. 9d,e).
Figure 5. Feeding-dependent dynamic regulation of commensal bacterial growth through the VIP-VIPR2-IL-22 axis.
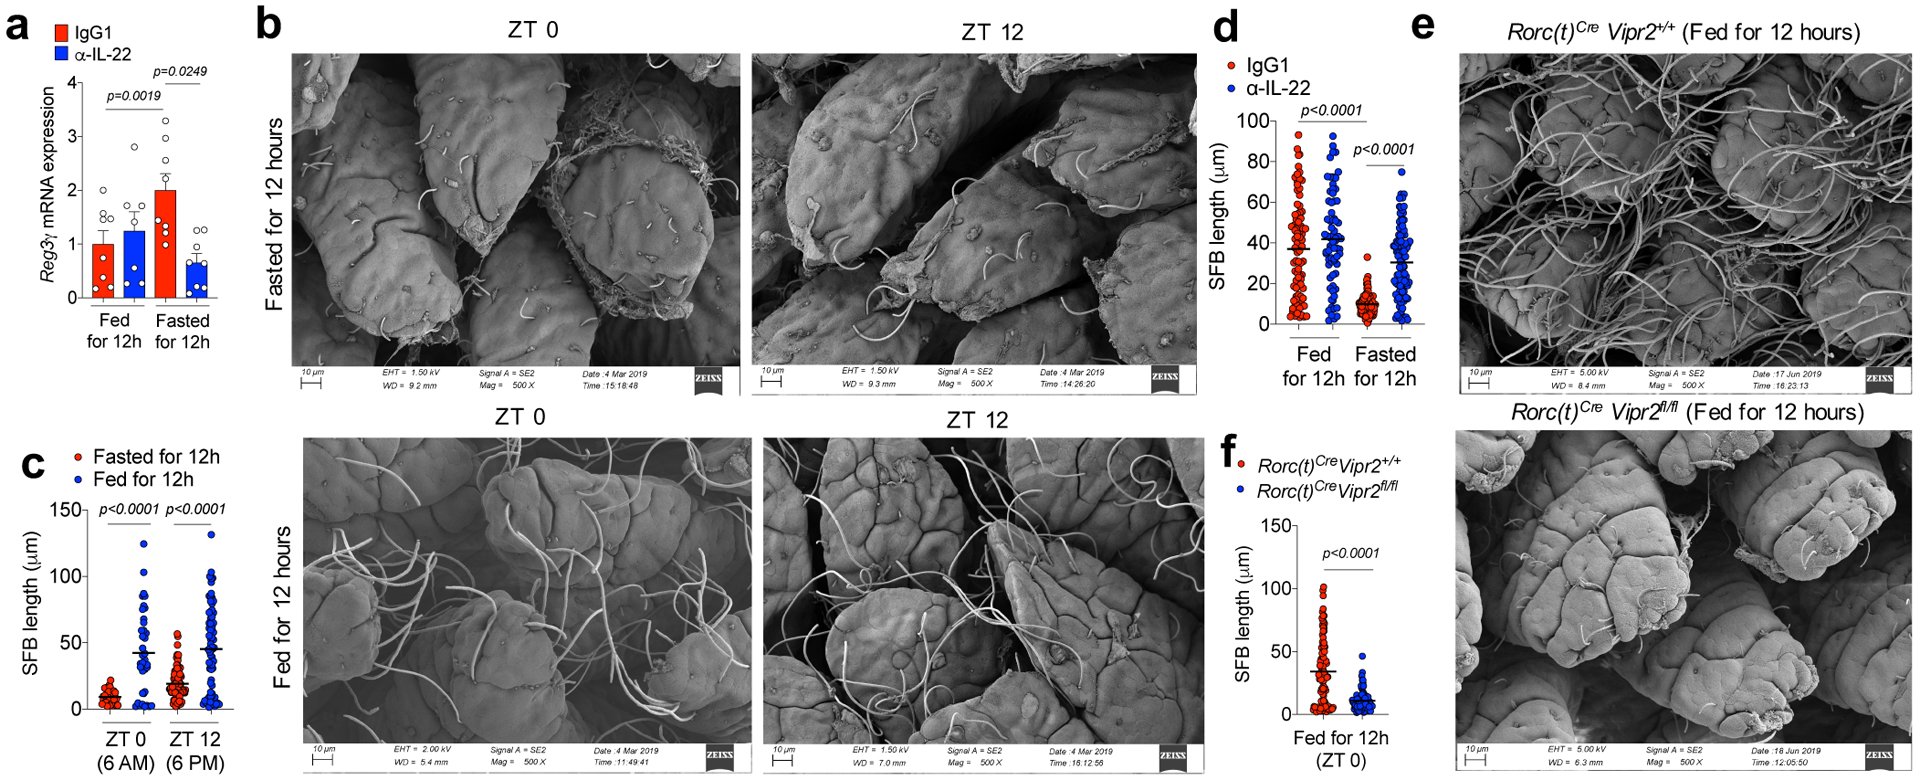
a, RegIIIγ mRNA expression in ieIECs from mice treated with IgG or α-IL-22 during feeding (Fed for 12h: Treated from ZT12->ZT0) or fasting periods (Fasted for 12h: Treated from ZT0->ZT12). Fed IgG1: N=8 mice, Fed α-IL-22: N=7 mice, Fasted IgG1: N=8 mice, Fasted α-IL-22: N=8 mice. Mean ± SEM, two-sided t-test. Data pooled from 2 independent experiments. b, c, Representative scanning electron microscopy (SEM) images (b) of epithelium-associated commensal SFB in the ileum of mice 12h after fasting or feeding at ZT0 and ZT 12 and (c) SFB filament length from a minimum of 2 random fields for each mouse (each dot represents an individual filament). N=3 mice/group, black lines show mean (one-way ANOVA). From 2 independent experiments. d, SFB length in ileum of mice treated with IgG or α-IL-22 during feeding or fasting periods (measured as in Figure 5c). N=3 mice/group. From 2 independent experiments. e,f, Representative (e) SEM images of epithelium-associated SFB in the ileum of RORc(t)Cre Vipr2+/+ (n=3) and RORc(t)Cre Vipr2fl/fl (n=3) mice fed for 12h and (f) measurement of bacterial filament lengths as in Figure 5c. Black lines show mean (two-sided t-test). From 2 independent experiments.
Short-term blockade with α-IL-22 not only reduced RegIIIγ mRNA expression in the ieIECs of mice during fasting, but also prevented control of SFB growth upon food restriction (Fig. 5d). In RORc(t)CreVipr2fl/fl mice, which have increased IL-22 production, SFB failed to form segmented filaments even after 12h of feeding (Fig. 5e,f). The Firmicutes/Bacteroidetes ratio in the ileal fecal matter and, to a lesser extent, in the fecal pellet, was reduced as compared to RORc(t)CreVipr2+/+ mice (Extended Data Figure 9f–j). These results suggest that VIPergic signaling regulates commensal microbiota by modulating cryptopatch-associated ILC3 in response to food consumption.
Feeding-activated VIPergic-ILC3 circuit increases efficiency of fat absorption
As IL-22 was recently shown to regulate intestinal lipid metabolism8, at least in part by controlling genes involved in lipid transport, we examined the role of the VIPergic-ILC3-IL-22 circuit in lipid absorption. Mice that had been fed for 12h absorbed more of 3H-triolein than mice fasted for 12h, although there was some effect of circadian regulation by light/dark adaptation (Extended Data Fig. 10a,b). Expression of mRNAs for proteins associated with fatty-acid/lipid uptake and transport (e.g. Fabp2) was lower in ieIECs from mice that were food-restricted for 12h compared to fed mice (Fig. 6a), in inverse relationship to RegIIIγ mRNA (Fig 5a). Treatment with α-IL-22 during the fasting period increased 3H-triolein absorption and the expression of epithelial Fabp2 (Fig 6a,b).
Figure 6. Feeding-dependent regulation of lipid absorption by the VIP-VIPR2-IL-22 axis.

a, Normalized Fabp2 mRNA expression in ieIECs, as in Figure 5a. b, Plasma 3H CPM (counts per minute) in 12h-fasted mice after gavage with 3H-triolein (2uCi/mice). Mice were treated with IgG (n=4) or α-IL-22 (n=4) during fasting. Two-way ANOVA. From 2 independent experiments. c, Normalized Fabp2 and Cd36 mRNA expression in IEC-enriched ileal extracts from 12h fed RORc(t)Cre Vipr2+/+ (n=5) and RORc(t)Cre Vipr2fl/fl (n=5) mice. Two-sided t-test. From 2 independent experiments. d, Plasma triglyceride content in 12h fed RORc(t)Cre Vipr2+/+ (n=5) and RORc(t)Cre Vipr2fl/fl (n=4) mice. Two-sided t-test. From 2 independent experiments. e, Plasma 3H CPM in 12h fed RORc(t)Cre Vipr2+/+ (n=3) and RORc(t)Cre Vipr2fl/fl (n=3) mice after gavage with 3H-triolein. Two-way ANOVA. From 2 independent experiments. f, Plasma triglyceride content in VipIRES-CrehM4Difl-stop-fl/+ mice after gavage with saline or Liquid Test Diet (each 45 minutes, for 6 hours). Vehicle (n=5 mice/group), CNO (n=4 mice/group). One-way ANOVA. From 2 independent experiments. Graphs are Mean ± SEM.
The effect of food intake on lipid absorption was dependent on the VIP-ILC3 axis, since expression of Fabp2 and Cd36 mRNAs, 3H-triolein absorption, and concentrations of circulating plasma triglycerides were substantially reduced in RORc(t)CreVipr2fl/fl mice compared to control littermates after 12h of feeding (ZT0) (Figures 6c–e). RORc(t)CreVipr2fl/fl mice also had reduced weight compared to their control littermates (Extended Data 10c,d), as observed with constitutive expression of IL-2228. Finally, continuous intragastric delivery of a liquid test diet for 6h led to an increase in serum triglycerides, which was blocked by DREADD-mediated inhibition of VIPergic neurons (Fig. 6f).
Discussion
These results reveal an important neuro-immune circuit in which feeding-activated VIPergic neurons antagonize microbiota-dependent CCR6+ILC3 function, resulting in reduced IL-22 production and increased efficiency of lipid absorption (Extended Data Figure 10e,f). Our results suggest a model in which the benefit of greater nutrient acquisition comes at the expense of reduced IL-22-promoted antimicrobial functions, illustrated by susceptibility to some enteropathic bacteria, rapid growth of epithelial-associated commensal SFB, and broader changes in the luminal commensal composition. Whether the host derives benefit from the reduced anti-microbial activity is unclear, although it may enable bacteria-dependent generation of essential metabolites29 and vitamins that would be readily absorbed. It will be of interest to determine whether chronic activation of ILC3/IL-22 in the absence of VIPR2 signaling affects global metabolism and colonization resistance to enteropathogens30.
The mechanism of food sensing and VIPergic activation is unclear, and may involve microbial31,32, nutritional4 or mechanical stimuli33, acting peripherally or by way of the central nervous system. VIP has been implicated in circadian regulation centrally, as VIPR2 is required for expression of the core clock genes in the suprachiasmatic nucleus of the hypothalamus, and in the periphery, regulating circadian oscillation of IL-5 and IL-13 production by ILC2 and eosinophil recruitment in lung and gut mucosa34,35. While our study highlights the importance of food intake in regulating VIP-ILC3 interaction, there is also a light-dependent contribution to the efficiency of lipid absorption, and hence we cannot rule out an additional role for central or peripheral clock functions36.
Our results also suggest that disturbances in feeding schedules could reduce intestinal barrier functions and promote dysbiosis, contributing to metabolic inbalance by chronic activation of VIPergic neurons. Moreover, enteropathogens may hijack this neuro-immune circuit and reduce intestinal barrier functions, facilitating intestinal colonization. In these scenarios, VIPR2 inhibitors may be valuable therapeutic tools to reduce lipid absorption or enforce the barrier during acute gastrointestinal infections.
METHODS
Mice
C57Bl/6 mice (male and female) were obtained from Taconic Farm. All transgenic mice were bred and maintained in the animal facility of the Skirball Institute (New York University School of Medicine) in specific pathogen-free conditions. hM3Dqfl-stop-fl mice (CAG-LSL-Gq-DREADD, Jax #026220), hM4Difl-stop-fl mice (CAG-LSL-Gi-DREADD, Jax #026219), VIPIRES-Cre mice (B6J.Vip-IRES-Cre, Jax #031628), tdTomatof/-stop-fl (CAG-tdTomato, JAX #007914) and CD45.1 mice (B6.SJL-Ptprca Pepcb/BoyJ, Jax# 002014) were purchased from Jackson Laboratories. RORc(t)EGFP/+ and RORc(t)Cre mice were generated in our laboratory and previously described14,37. BAC-transgenic Rorc(t)-GfpTG were generated by G. Eberl’s lab38 and used for evaluation of Vipr2 mRNA expression in different populations of RORγt+ lymphoid cells purified by FACS sorting. Vipr2−/− mice (Jax# 031332) were purchased from Jackson Laboratories and were maintained in a CD45.2 background or were bred with CD45.1 (B6.SJL-Ptprca Pepcb/BoyJ) mice, which subsequently generated Vipr2−/− CD45.1/2 mice and WT CD45.1 littermates. Conditional VIPR2 knockout (Vipr2fl/fl) mice were generated using CRISPR-Cas9 technology as described below. Mice in all experiments were 6–12 weeks old at the starting point of treatments and all were colonized with SFB. All animal procedures were performed in accordance with protocols approved by the Institutional Animal Care and Usage Committee of New York University School of Medicine or the NIAID as applicable.
Generation of RORc(t)Cre Vipr2fl/fl mice
Mice carrying loxP sites flanking exons 3 and 4 of the Vipr2 gene (Vipr2fl/fl) were generated using published CRISPR/Cas9 protocols39,40 at the NYU School of Medicine’s Rodent Genetic Engineering Laboratory. Briefly, guide RNAs targeting regions upstream of exon 3 (gRNA_16 sequence: GAAATCTCACAACAGATTCG) and downstream of exon 4 (gRNA_23 sequence: TCTCCTCAGAAGCATCGAAT) were designed using the Crispr guide design software (http://crispr.mit.edu/). gRNA recognition sequences were cloned into the pX330 vector (a gift from Dr. Feng Zhang, Addgene #42230), using oligos with a T7 promoter containing the gRNA template that were chemically synthetized by IDT (Integrated DNA Technologies). The products of PCR-amplified T7-gRNA were used as templates for in vitro transcription (MEGAshortscript T7 kit, Thermo Fisher Scientific). The gRNAs were purified using the MEGAClear Transcription Clean-up kit (Thermo Fisher Scientific). Two donor templates (ssDNA_1 and ssDNA_2) with 200bp each were chemically synthetized by IDT. The donor templates contained 60bp homology arms flanking a cassete containing a loxP sequence and XhoI or SalI restriction sites, located in the original PAM sequence (mutated PAM). Namely, ssDNA_1 (XhoI) for the region upstream exon 3: (GGATGGCATTTACATAGGACCCCATCCCAGTGGCTGCTCAGAAGAGCACTCACTCCTTATCCctcgagataacttcgtataatgtatgctatacgaagttatCCGAATCTGTTGTGAGATTTCGAGAACTCATAAGGACTGATAAGGCCACACAACTTGAGC), and ssDNA_2 for the region downstream exon 4 (TGATTTCTCCTAGGTCACACTCAGGGAGCATTTCCAGACACTGGAAAACTCCTGAGGCCCgtcgacataacttcgtataatgtatgctatacgaagttatATTCGATGCTTCTGAGGAGACTATAATTAAACCCTGCCTGTGTGAGGCATGGCTTCTGAT). Mice were generated by injection of a mixture of mammalian optimized Cas9 mRNA (100 ng/μl, TriLink Biotechnologies), purified gRNA_16 and gRNA_23 (50 ng/μl, each) and donor templates ssDNA_1 and ssDNA_2 (50ng/ul, each) in injection buffer (10 mM Tris, pH 7.5; 0.1 mM EDTA) into the cytoplasm of C57BL/6J embryos in accordance with standard procedures approved by the IACUC at the NYU School of Medicine. Female CD-1 mice (Charles River) were used as foster mothers. F0 mice were genotyped and sequenced (Sanger sequencing) to identify mice homozygous for both loxP insertions. Founders bearing loxP insertions were then backcrossed at least one time to wild-type C57BL/6J mice generating the Vipr2fl/fl mice. For the generation of RORc(t)Cre Vipr2fl/fl mice, Vipr2fl/fl mice were crossed with RORc(t)Cre mice for the generation of RORc(t)Cre Vipr2fl/fl and RORc(t)Cre Vipr2+/+ littermates.
VIPergic neuronal activation/inhibition using DREADDs
To perform chemogenetic activation or inhibition of VIPergic neurons, we bred VIPIRES-Cre homozygous mice to hM3Dqfl-stop-fl mice (DREADD for activation) or hM4Difl-stop-fl mice (DREADD for inhibition), generating VIPIRES-CrehM3Dqfl-stop-fl (VIPergic activation) and VIPIRES-Cre hM3Dqfl-stop-flhM4Difl-stop-fl mice (VIPergic inhibition). To perform 24h activation of the DREADDs, mice were treated with Clozapine-N-Oxide (CNO, 1mg/Kg intraperitoneally, TOCRIS) each 12h. Our experiments with VIPIRES-Cre only mice revealed that these dose of CNO treatment does not affect ILC3 function. To perform activation of the DREADDs during Citrobacter rodentium infection, mice were treated daily with CNO (1mg/Kg, intraperitoneally) from day 1 to day 4 after infection.
Food restriction protocol
Due to the ad libitum feeding scheme, approximately 15% of daily food intake occurs during the light-phase/resting period27. Therefore, we restricted food availability for a period of two weeks, food was made available to mice only for 12h per daily cycle. Mice were kept in two different regimens: Dark-phase fed mice, with food being available between 6 PM – 6AM (ZT 12->ZT 0); and light-phase fed, with food being available between 6 AM – 6PM (ZT 0->ZT 12). To avoid littering, at the beginning of the fasting period of each regimen, mice were transferred to a clean cage containing alpha cellulose clean bedding (Shepherd’s™ALPHA-dri). Mice were provided with free access to water.
Gavage of Liquid Test Diet
Dry powder micro stabilized rodent liquid diet (Test Diet, LD 101) was blended (mechanical blender) vigorously for 30 seconds in saline (NaCl 0.9%) at 0.5g/mL. Mice were gavaged with 400ul of this solution using a polyurethane feeding tube (16ga × 38mm, FTPU-16-38-50, INSTECH) every 45 min for 6 h.
Generation of bone marrow VIPR2+/+/VIPR2−/− chimeric reconstituted mice
Bone marrow mononuclear cells were isolated from CD45.1 VIPR2+/+ and CD45.2 (or CD45.1/2) VIPR2−/− mice by flushing the long bones. Red blood cells were lysed with ACK Lysing Buffer and the remaining cells were resuspended in PBS for injection in at a 1:1 ratio (WT:VIPR2 KO). 4×10⁶ cells were injected intravenously into 6 week old CD45.1/2 (or CD45.2) mice that were irradiated 4h before reconstitution using 1000 rads/mouse (2×500rads, at an interval of 3h, at X-RAD 320 X-Ray Irradiator). To deplete intestinal ILC3, one day after the bone marrow transfer, mice were treated with InVivoMAb anti-mouse Thy1.2 (200ug/mice for 4 consecutive days, Clone 30H12, BioXCell). Experiments were performed 6–7 weeks after the last treatment with α-Thy1.2.
Radioactively labeled triglyceride absorption assay
Plasma 3H-CPM (counts per minute) was measured 1–4h after gavage with 3H-Triolein–containing lipid (PerkinElmer, #NET431001MC)41. Briefly, mice were injected with poloxamer 407 (1g/Kg, i.p., Sigma, #16758). After 30 minutes, mice were gavaged with a mixture of 2μCi 3H-Triolein in 200ul of 20% intralipid oil emulsion. Blood samples were collected and diluted in Liquid Scintillation Counting cocktail (Ultima Gold) and measured using a Scintillation counter (Beta Counter MicroBeta2 System, Perkin Elmer).
IL-22 in vivo Blockade
For experiments with IL-22 blockade, mice were injected with monoclonal α-IL-22 (Clone 8E11, 250μg/mouse, generously provided by Tangsheng Yi, Genentech), 12 hours before sample collection. Control groups received mIgG1 (inVivoMAb, clone: MOPC-2, BioXCell).
C. rodentium mediated colon inflammation
C. rodentium strain DBS100 (ATCC51459; American Type Culture Collection) was grown at 37°C in LB broth to OD600 reading between 0.5 and 0.7. VIPIRES-CrehM3Dqfl-stop-fl (VIPergic activation) and C57BL/6 mice were inoculated with 200 μl of a bacterial suspension (2×10⁹ CFU) by oral gavage. VIPIRES-Cre hM3Dqfl-stop-flhM4Difl-stop-fl mice (VIPergic inhibition) and RORc(t)Cre Vipr2fl/fl were inoculated with 200 μl of a bacterial suspension (3–4×10¹⁰ CFU) by oral gavage. For DREADD experiments, CNO treatment started at 1 day post-infection (d.p.i.) until 4 d.p.i. Mice were followed the next 12 days post-infection (d.p.i.) to measure survival rate. At 9 d.p.i. fecal pellets were collected and the mice dissected to harvest spleen and liver. Samples were weighted and minced on sterile deionized water with Triton 0.1% and filtered on a 70μm cell strainer. The filtered samples were used to measure C. rodentium burden with serial dilutions (triplicates) on MacConkey agar plates.
Immunofluorescence and Confocal Microscopy
Slide section staining: Small intestines from perfused SFB+ Rorc(t)EGFP/+ or VIPIRES-CretdTomatofl-stop-fl mice were Swiss-rolled, fixed for 4h in 4% paraformaldehyde, incubated overnight in 30% sucrose at 4°C, and frozen in embedding medium for frozen specimens (O.C.T, Tissue-Tek, Sakura). Tissue was cut into 30–70 μM sections, blocked in PBST 0.5% (0.5% Triton X-100, 10% normal donkey serum) for 1 h, and incubated overnight at 4°C using the following antibodies: α-Vasoactive Intestinal Peptide (1:1000, rabbit polyclonal, 20077, Immunostar), α-Tyrosine Hydroxylase (1:50, rabbit polyclonal, AB152, Millipore), α-Substance P (1:3000, rabbit polyclonal, 20064 Immunostar), α-GFP Alexa Fluor 488 (1:500, clone: FM264G, Biolegend), α-GFP Alexa Fluor 488 (1:500, Goat polyclonal, Rockland), α-GFP Alexa Fluor 488 (1:500, rabbit polyclonal, Molecular Probes), α-TCRβ Brilliant Violet 421 (1:50, clone: H57–597, Biolegend), α-β−3-Tubulin Alexa Fluor 594 or Alexa Fluor 488 (1:500, clone:AA10, Biolegend). Tissue was washed and when needed incubated with secondary fluorescently labeled antibodies (Donkey Anti-Rabbit Pacific Blue or Alexa Fluor 647) for 2h before nuclear staining with Draq-7 (R&D Systems) or 4′,6-diamidino-2-phenylindole (DAPI, ThermoFisher).
Whole mount stainings: Ileum was collected from perfused VIPIRES-CrehM3Dqfl-stop-fl mice, flat opened and cleared of fecal material. The flat tissue was fixed overnight in 4% paraformaldehyde at 4°C. Whole tissue was cut in sections of 4cm, blocked in PBST 0.5% (0.5% Triton X-100, 10% normal donkey serum) overnigh at 4°C, and incubated for 48h at 4°C using the following antibodies: α-HA Alea Fluor 647, for staining of HA-tagged hM3Dq, (16B12, 1/300, Biolegend) and α-cFOS (1/100, 9F6, Rabbit, Cell, Signaling #2250). Tissue was washed for 24h at 4°C and incubated with secondary fluorescently labeled antibodies (Donkey Anti-Rabbit Alexa Fluor 488, Thermo Fisher) for 24h at 4°C. Tissue was washed for 24h before nuclear staining with 4′,6-diamidino-2-phenylindole (DAPI, ThermoFisher). Images were acquired using a Zeiss LSM 710 confocal (Carl Zeiss). The imaging data were processed and analyzed using Image J software (NIH, Bethesda, MD). Imaris software version 9.0.1 (Bitplane; Oxford Instruments) was used to generated reconstructed 3D images.
Isolation of Lamina Propria Lymphocytes (LPLs) from the small intestine
Whole small intestine, proximal small intestine (14cm), ileum (distal 14cm of the small intestine) or the large intestine were dissected from mice. Unless indicated, all the dissections were performed between ZT2-ZT3. Mesenteric fat tissue and Peyer’s patches were carefully removed from these tissues. Intestinal tissue was opened and extensively cleaned of fecal matter. Following, this tissue was sequentially treated with HBSS 1X (1 mM DTT) at 37°C for 10 min with gentle shaking (200rpm), and twice with 5 mM EDTA at 37°C for 10 min to remove epithelial cells. The EDTA fraction (ileal extracts enriched for IECs) was filtered using a 100uM strainer, centrifuged and suspended in Trizol for further RNA isolation. The remaining tissue was then minced with a scissor and dissociated in RPMI containing 10% FBS, Dispase (0.05 U/ml; Worthington), collagenase (1 mg/ml collagenase II; Roche) and DNase I (100 μg/ml; Sigma) at constant shaking at 37°C for 45 min (175rpm). The digested tissue was then filtered through a 70μm strainer to remove large debris. Viable Lamina Propria Lymphocytes (LPLs) were collected at the interface of a 40%/80% Percoll/RPMI gradient (GE Healthcare).
Isolation of ILC3, γδT17 and Th17 cells from the small intestine
CCR6+ and CCR6neg ILC3 (DAPInegCD3negCD11bnegCD11cnegCD14negCD19negTCRβnegTCRγnegNK1.1negKLRG1negCD127+CD90.2+), γδT17 (DAPInegCD11bnegCD11cnegCD8negD14negCD19negNK1.1negTCRγ+TCRβnegGFP+CD3+) and Th17 (DAPInegCD11cnegCD8negCD14negCD19negNK1.1negTCRγnegTCRβ+GFP+CD3+) were isolated from small intestine of the BAC-transgenic Rorc(t)-GfpTG mice using the ARIA II FACS Sorter (sorted through a 70μM nozzle, BD Biosciences) and resuspended in TRIZOL for further RNA isolation. CCR6+ ILC3 were also isolated from VIPR2+/+/VIPR2−/− chimeric reconstituted mice for further RNA isolation.
ILC3 in vitro cell culture
CCR6+ and CCR6neg ILC3 (DAPInegCD3negCD11cnegCD14negCD19negTCRβnegTCRγnegNK1.1negKLRG1negCD127+CD90.2+) were isolated from small intestine LPLs of C57BL/6 mice using the ARIA II FACS Sorter (BD Biosciences). ILC3 were cultured at 37°C in flat bottom 96 well plates (104 cells/well) in RPMI supplemented with 10% heat-inactivated FBS (Hyclone), 50 U penicillin-streptomycin (Hyclone), 2 mM glutamine (Hyclone), 10mM HEPES (Hyclone), 1mM sodium pyruvate (Hyclone) and 50 μM β-mercaptoethanol (Gibco). ILC3 were stimulated with IL-23 (100–300 pg/mL, R&D systems) and/or VIPR2 ligands (BAY-559837: 1–100nM, and VIP: 1nM-1uM, TOCRIS) for 16h (37°C), washed, incubated in for 4h at 37°C in RPMI with 10% FBS, phorbol 12-myristate 13-acetate (PMA) (50 ng/ml; Sigma), ionomycin (500 ng/ml;Sigma) and Golgi Plug (BD Bioscience), and stained for membrane extracellular markers in Staining Buffer (PBS FBS 2% EDTA 5mM) and for intracellular markers using Cytofix/Cytoperm buffer set following manufacturer’s protocol (BD Biosciences). Acquisition of cytometric parameters was performed on an LSRII (BD Biosciences). All data were analyzed using FlowJo Software Version 10 (Tree Star).
Analysis of ex-vivo cytokine production by intestinal lymphocytes
Single cell suspensions were pelleted and resuspended with surface-staining antibodies in PBS FBS 2% EDTA 1mM. Staining was performed for 20–30min on ice. Live/dead fixable blue (ThermoFisher) was used to exclude dead cells. The following monoclonal antibodies were purchased from eBiosciences, BD Pharmingen or BioLegend: CD3, CD45.1, CD45.2, TCRβ, CD11c, CD14, CD19, KLRG1, TCRγ, RORγ/γt, NK1.1, CD127, CD90.2, CCR6, Sca-1, IL17A and IL-22. Analysis of ex-vivo cytokine production in ILC3 was performed in unstimulated cells (unless indicated), with LPLs incubated for 4h at 37°C in RPMI with 10% FBS with only GolgiPlug (BD). Cells were then stained for surface markers and anti-CD16/anti-CD32 before fixation and permeabilization, and then subjected to intracellular cytokine staining for IL-22 and IL-17A according to the manufacturer’s protocol (Cytofix/Cytoperm buffer set from BD Biosciences). For analysis of ex-vivo cytokine production by Th17/γδT17 cells were incubated for 4 hours at 37C in RPMI with 10% FBS, phorbol 12-myristate 13-acetate (PMA) (50 ng/ml; Sigma), ionomycin (500 ng/ml;Sigma) and GolgiStop (BD). After surface and live/dead staining, cells were treated using the the FoxP3 staining buffer set from eBioscience according to the manufacturer’s protocol. Intracellular stains were prepared in 1X eBioscience permwash buffer containing anti-CD16/anti-CD32, normal mouse IgG (conc), and normal rat IgG (conc). Staining was performed for 30–60min on ice. Flow cytometric analysis was performed on an LSR II (BD Biosciences) or an Aria II (BD Biosciences) and analyzed using FlowJo software version 10 (Tree Star).
Blood collection
Peripheral and portal vein blood were collected under general anesthesia (Ketamine 100mg/Kg, Xylazine 15mg/Kg). Peripheral blood was collected through orbital venous plexus bleeding with a glass capillary in a tube containing EDTA (25mM) as an anticoagulant. Plasma was collected after centrifugation of the collected sample and frozen until processing. Surgery was performed to collect blood from the portal vein, which drains the gastrointestinal tract. Briefly, after laparotomy, the portal vein was localized and the blood was collected with a syringe. Portal vein blood was processed following the same protocol above for peripheral blood.
Evaluation of villi and crypt morphology in the small intestine
Small intestine samples (14 cm distal from the pylorus, 10cm long) were gently swiss rolled from the distal end and fixed in 4% paraformaldehyde (Electron Microscopy Science, Hatfield USA). Formalin-fixed tissues were then processed for paraffin embedding, cut into 5-micron thick sections and stained with hematoxylin and eosin (H&E) or Ki-67/hematoxylin as per protocol by the Experimental Pathology Core Laboratory at New York University (NY, USA). Measurement of villi and crypt length on H&E slides was performed by two independent researches in a blinded fashion using coded slides. Per sample, we analyzed a total of 6 slides with a distance of 100uM between each cut. For each slide, 10 villi/crypts were measured, as a total of 60/sample. The mean values of villi and crypt length were plotted. The imaging data were processed and analyzed using Image J software (NIH, Bethesda, MD). Quantification of frequency of Ki-67+ cells in the whole crypt region was performed in a blinded fashion using coded slides and the tools of Qupath software42.
Tissue processing for ELISA
Distal Ileum (6 cm from the ileal-cecal junction) was collected and extensively washed to clean out fecal matter. The samples were weighed and, using a tissue homogenizer, extracted in PBS Tween 0.1% (with protease inhibitor) and centrifuged to remove tissue debris. The supernatant was frozen until measurement of VIP concentrations in the tissue.
ELISA for Vasoactive Intestinal Peptide
VIP content was measured in the blood plasma or homogenized tissue following manufacturer’s recommendations (EIAM-VIP-1, RayBiotech).
Measurement of plasma concentration of triglycerides
Peripheral blood was collected as described above and plasma was used to quantify triglyceride concentrations following manufacturer’s recommendations (Sigma-Aldrich, MAK266).
Scanning Electron Microscopy
Scanning Electron Microscopy was performed on 1–1.5 cm pieces from terminal ileum (2cm above the ileal-cecal junction). Intestine was cut open and washed to remove fecal matter, pinned in dental wax and fixed for 2h with a 0.1M sodium cacodylate buffer (CB, pH 7.4) containing 2.5% glutaraldehyde and 2% paraformaldehyde. Samples were post fixed in 1% OsO4 for 2 hours, dehydrated in ethanol, and critical point dried using Tousimis autosamdsri 931 (Rockwille, MD). The dried intestines were put on SEM stabs, sputter coated with gold/palladium by DESK V TSC HP Denton Vacuum (Moorestown, NJ), and images were taken on random locations in the tissue by Zeiss Gemini300 FESEM using secondary electron mode at 5kv. For quantification of SFB length, random fields were selected for measurement using Image J.
RNA extraction from intestinal epithelial cells, RT-PCR and qPCR
RNA isolation of CCR6+ ILC3, CCR6neg ILC3, γδT17, Th17 and ileal epithelial cells, was performed using TRIzol following manufacter’s instructions (Invitrogen) followed by DNase I (Qiagen) treatment and cleanup with RNeasy MinElute kit (Qiagen) following manufacturer protocols. cDNA was generated using SuperScriptTM IV First-Strand Synthesis System (ThermoFisher). Gene-specific primers spanning exons were used: Rps17 (F:’5-cgccattatccccagcaag-3’/ R:’5-tgtcgggatccacctcaatg-3’), RegIIIγ (F:’5-tctgcaagacagacaagatgct-3’/ R:’5-ggggcatctttcttggcaac-3’), Fabp2 (F:’5-gtctagcagacggaacggag-3’/R:’5-ctccttcatatgtgtaggtctgga-3’), Cd36 (F:’5-tggccttacttgggattgg-3’/R:’5-ccagtgtatatgtaggctcatcca-3’). Quantitative PCR was performed using the Hot Start-IT SYBRGreen (Affymetrix) on the Roche real-time PCR system (Roche 480). Values were normalized to Rps17 gene for each sample. For evaluation of Vipr2 mRNA expression, TaqMan probes for Vipr2 (Mm01238618) and Hprt (Mm00446968) were purchased from Thermo Fisher Scientific and reactions were run with the CFX Connect Real—Time PCR Deterction System (Bio-Rad).
Analysis of microbiota composition in the ileal fecal material, fecal pellet and ileal tissue
The ileum (ileal tissue: 1 cm), ileal fecal content, fecal pellet were collected from mice, and bacterial DNA was extracted with the QIAamp DNA Stool Kit (QIAGEN) following the manufacturer’s instructions. In the ileal tissue, SFB was quantified by qPCR with primers specific for 16S SFB rRNA genes (SFB F- sequence/SFB R- sequence)using Hot Start-IT SYBRGreen (Affymetrix) on the Roche real-time PCR system (Roche 480). The relative values of SFB in the tissue were normalized based on the amounts of host gDNA using primers specific for the genomic Hif1a locus (Hif1a F-sequence / Hif1a R-sequence). In the ileal fecal content and fecal pellet, SFB was quantified by qPCR with primers specific for SFB and the relative values were normalized based on the total relative amounts of 16S rDNA (16S F-sequence / 16S R-sequence).
For analysis of the whole microbial community composition in the ileal and fecal matter, sequencing of the 16S rRNA was performed as previously described43 in a MiSeq instrument (Ilumina, San Diego, USA) using 150bp, paired ended chemistry. 16S rRNA sequence data were processed using QIIME v244.
Data processing of publicly available RNA-seq
DESeq2-normalized gene quantification and differential expression analysis were downloaded from GSE11609216. Raw counts were downloaded from GSE127267 (ImmGen ULI RNA-seq data)17 and differential expression analysis was performed using DESeq2. Normalized counts were used for downstream analysis. A cutoff was made based on the normalized counts of a known non-expressed gene (Foxp3) (GSE116092, cut-off ≤ 9 and for GSE127267, cutoff <25).. GO term analysis of GSE11609216 was done using g:Profiler. For heat maps, genes were considered differentially expressed with FDR < 0.01 and log2 fold change ≥ 2.
Library preparation for RNA sequencing and transcriptomic analysis
RNA-seq libraries for CCR6+ ILC3 were prepared with the TruSeq Stranded Total RNA Library Prep Gold Kit (Illumina, 20020598). The sequencing was performed using Illumina NextSeq instrument (Ilumina, San Diego, USA) using 150bp, paired ended chemistry. RNA-seq libraries were prepared and sequenced by the Genome Technology Core at New York University School of Medicine. Fastq files were aligned to the mouse Ensemble genome GRCm38 with STAR v 2.6.1d. Read pairs were counted using featurecounts from the Subread package v 1.6.2, prior to normalization and differential expression analysis which were performed using DESeq2 (Wald test with Benjamini–Hochberg correction to determine the FDR). Genes were considered differentially expressed with FDR<0.05 and log2 fold change > 1. Gene pathways and functions were assessed using Ingenuity Pathway Analysis (Qiagen Bioinformatics).
Statistical analysis
Unpaired two-sided t-test, paired two-sided t-test, one-way ANOVA with multiple comparisons with Bonferroni correction, two-way ANOVA with multiple comparisons and Bonferroni correction, Mann-Whitney test, Mantel Cox test (for survival curves), were performed to compare the results using GraphPad Software Version 8 (GraphPad Software). No samples were excluded from analysis. Exact p-values were provided when possible. We treated p<0.05 value as significant.
Data availability
Source data for quantifications shown in all graphs plotted in the Figures and Extended Data Figures are provided with the paper. The datasets generated in this study are available from the corresponding author, on reasonable request. RNA-seq datasets analysed are publicly available in the Gene Expression Omnibus repository (accession number GSE140502) and 16S-seq datasets analysed are publicly available at BioProject (accession number PRJNA594406).
Extended Data
Extended Data Figure 1. Enrichment of transcripts related to nervous system/neural functions and development in CCR6+ ILC3.
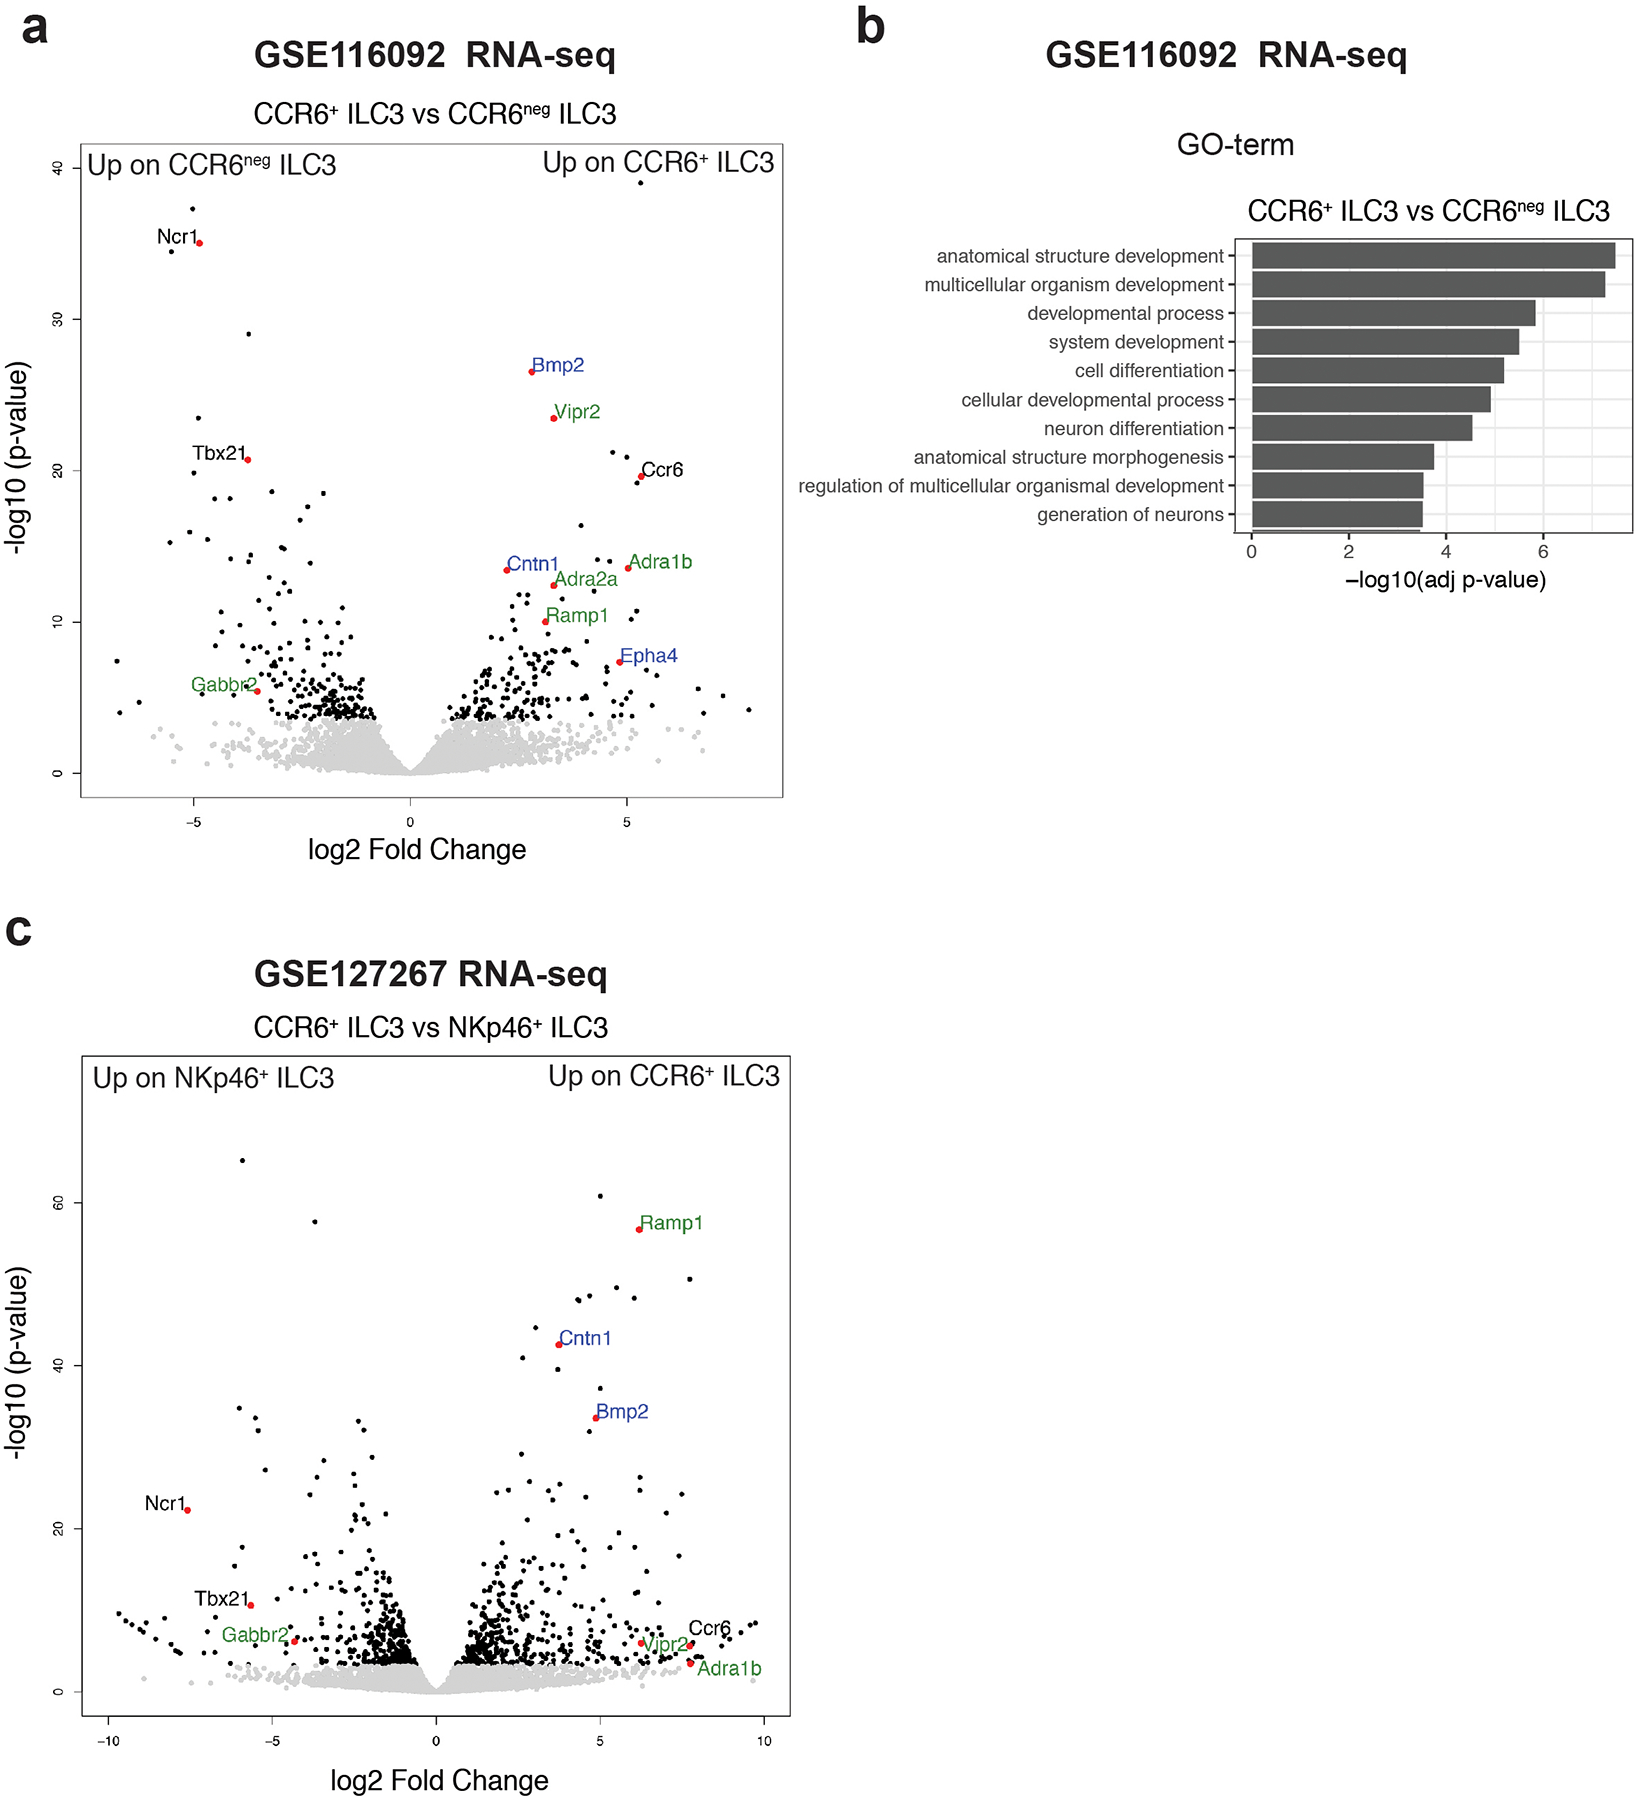
a, Volcano-plot of differentially expressed genes between CCR6+ ILC3 and CCR6neg ILC3 isolated from the small intestine of C57BL/6 mice GSE11609216 (n=3 independent biological samples). Wald test. Green: Neurotransmitter/neuropeptide receptors, Blue: genes related to nervous system development/axonal guidance and contact. b, Top 10 Gene-Ontology terms from a comparison between subtypes of ILC3 showing enrichment of transcripts related to neuron differentiation and generation in CCR6+ ILC3 when compared to CCR6neg ILC3. gSCS algorithm for multiple testing correction. Green: Neurotransmitter receptors, Blue: genes related to nervous system development/axonal guidance and contact. c, Vocano-plot of differentially expressed genes between CCR6+ ILC3 (enriched in cryptopatches and ILFs45) and NKp46+ ILC3 (low presence in CPs and ILFs46) (GSE12726717, n=2 independent biological samples, Wald test).
Extended Data Figure 2. Cryptopatch-associated enteric neurons are also present in the large intestine (colon) lamina propria.
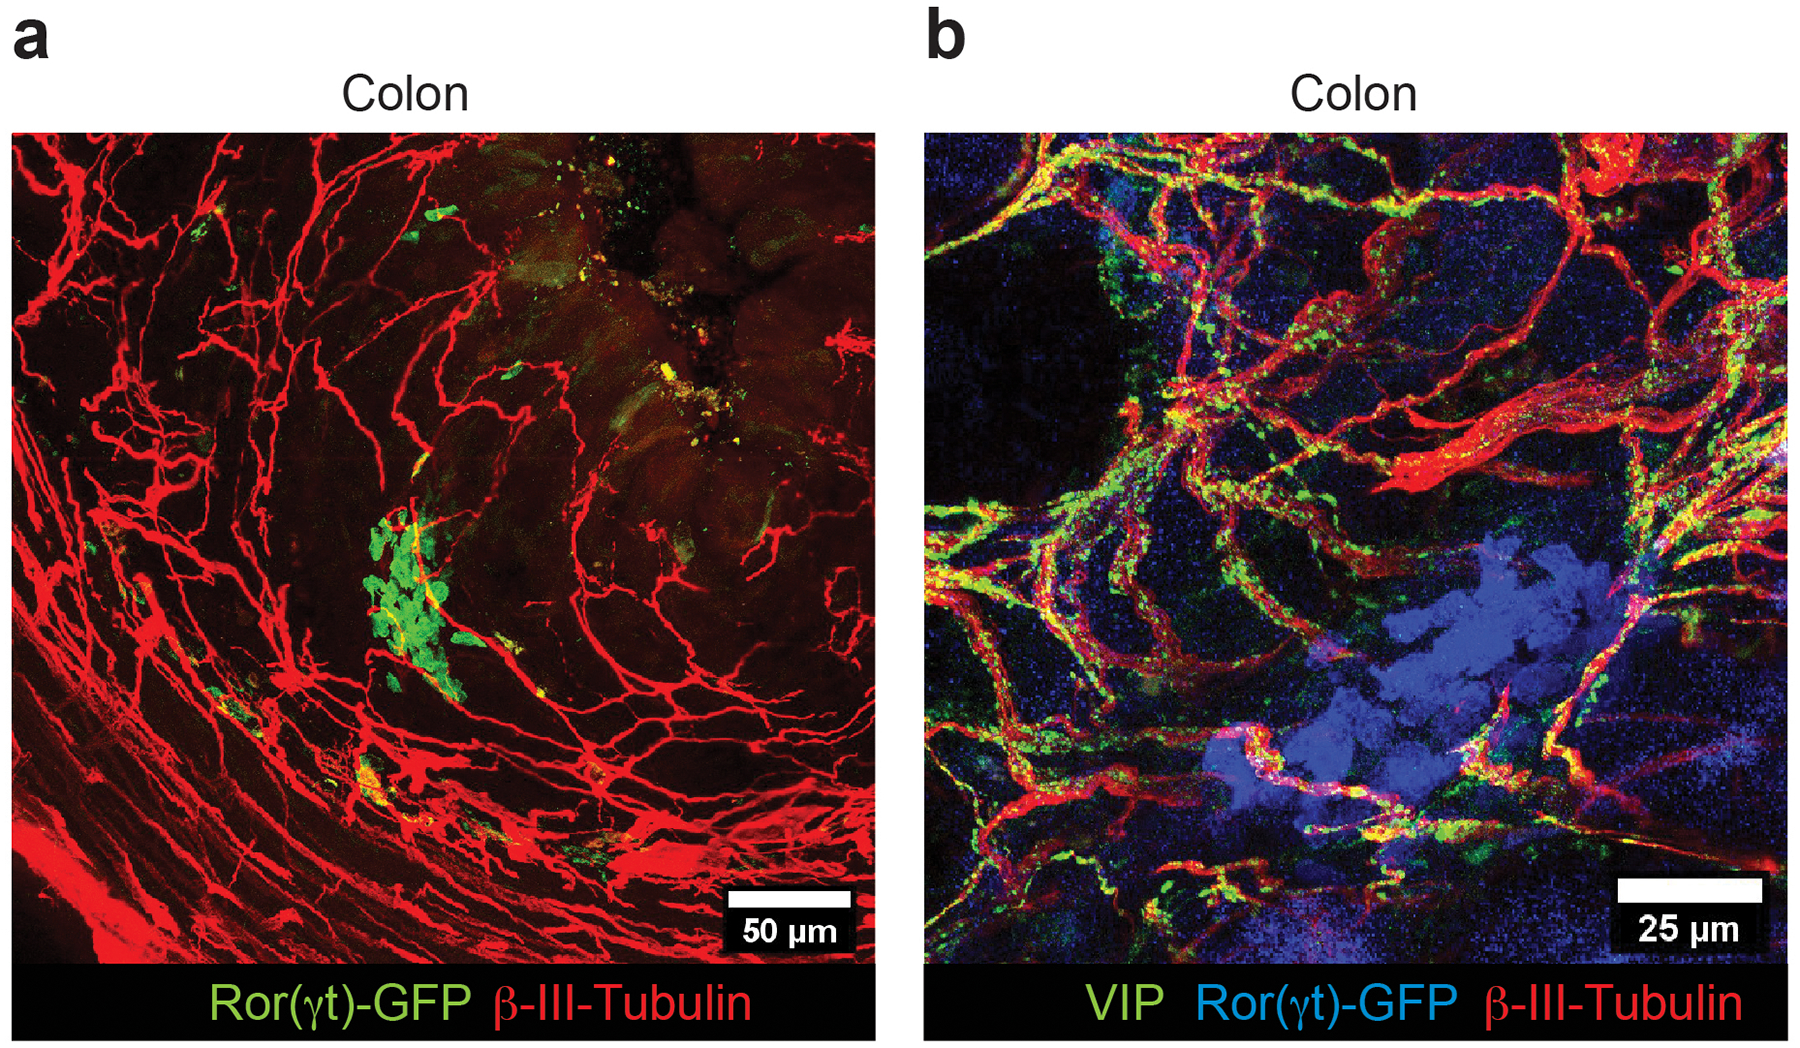
a, b Representative immunofluorescence images of lamina propria neuronal projections of enteric neurons in the large intestine of Rorc(t)EGFP/+ mice (representative of 4 CP/ILF clusters). (a) Cluster of ILC3 (GFP+ cells, green) in close proximity of neuronal projections (βIII-Tubulin, red) of the enteric neurons in the colon lamina propria. (b) Cluster of ILC3 (GFP+ cells, blue) in close proximity of neuronal projections (βIII-Tubulin, red) of Vasoactive Intestinal Peptide+ enteric neurons (green) in the colon lamina propria (representative of 3 CP/ILF clusters).
Extended Data Figure 3.
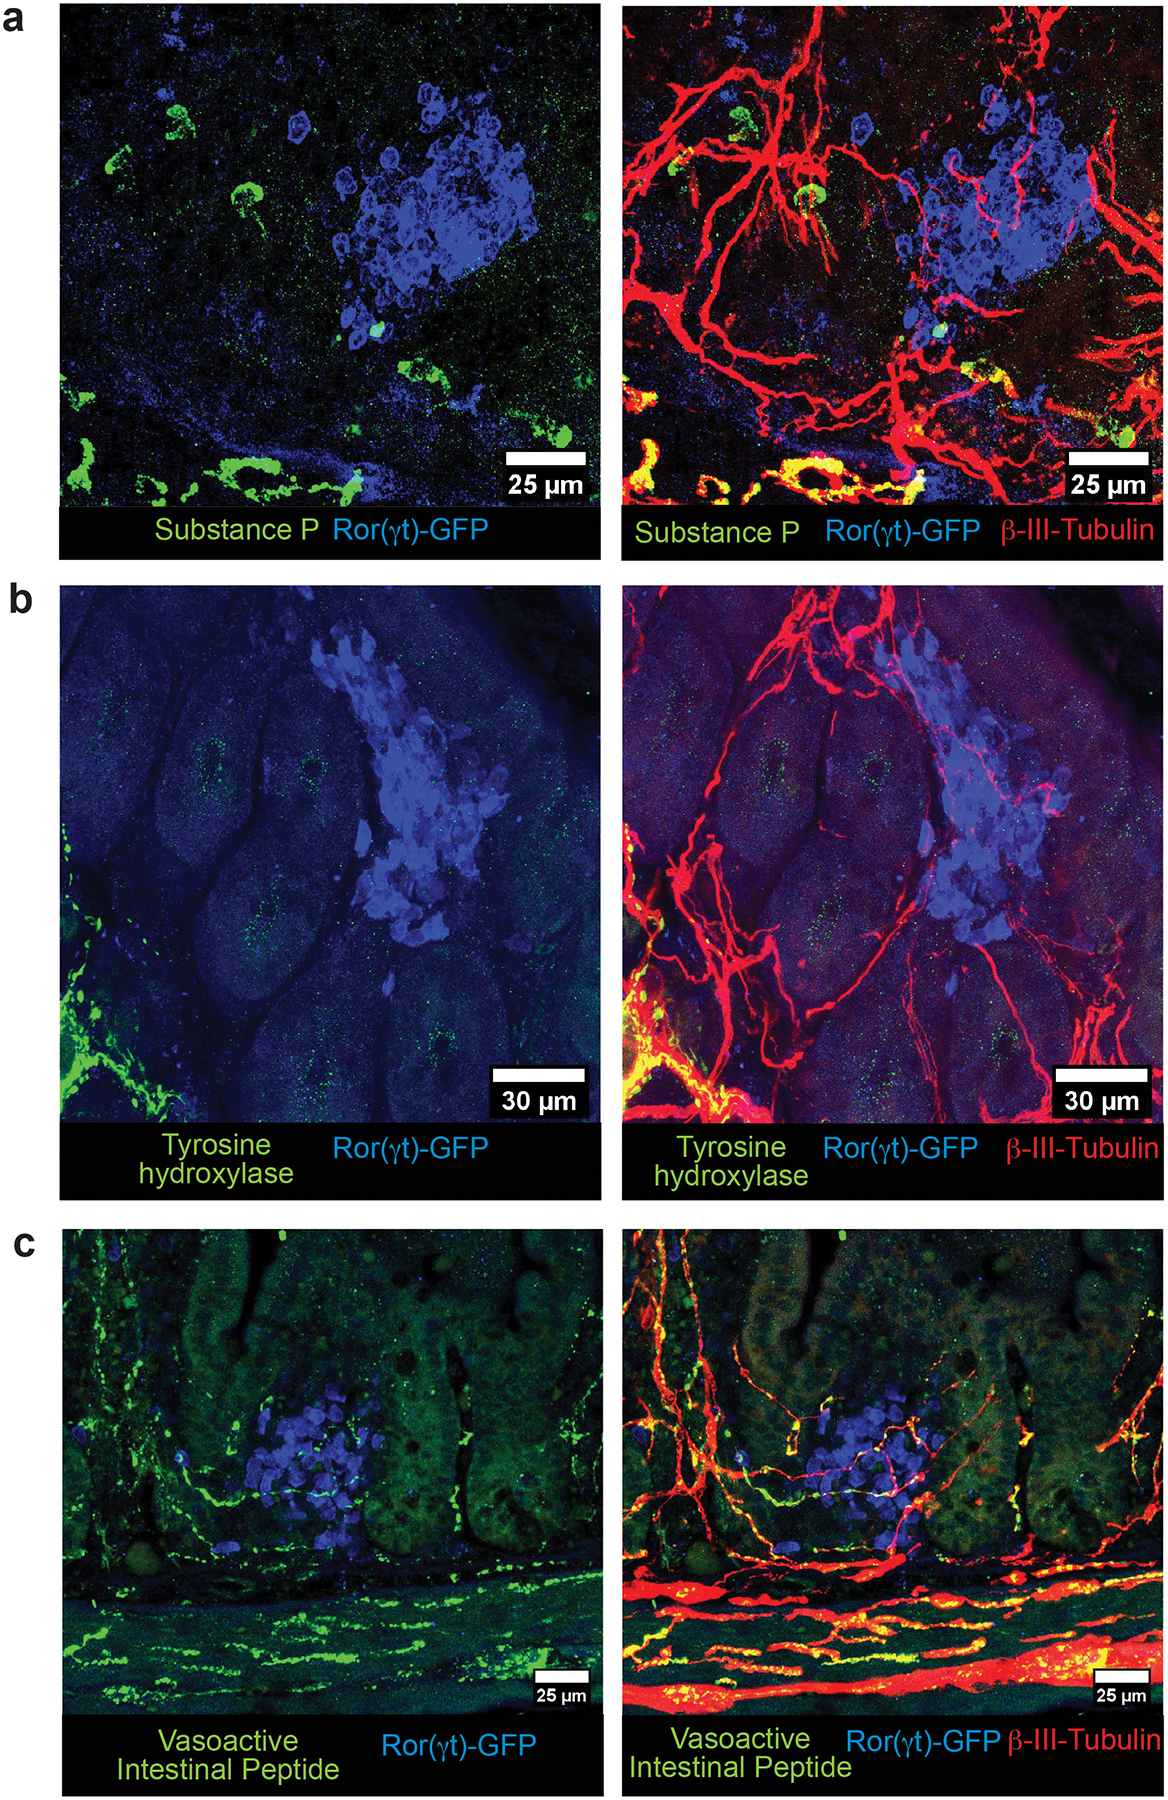
Neurochemical code of the cryptopatch-associated enteric neurons in the small intestine lamina propria. a-c, Representative immunofluorescence images of different subtypes of lamina propria neuronal projections of enteric neurons in the small intestine of Rorc(t)EGFP/+ mice. (a) Substance P (green) is not present in neuronal projections (βIII-Tubulin, red) localized inside CPs/ILFs (cluster of GFP+ cells, blue) in the lamina propria. Representative of 15 CPs/ILFs analyzed in the small intestine of 4 different Rorc(t)EGFP/+ mice). No colocalization of substance P was observed in any of the cryptopatch associated neuronal fibers. (b) Tyrosine hydroxylase+ neurons (green) are in close proximity but are not represented among neuronal projections (βIII-Tubulin, red) localized inside CPs/ILFs (cluster of GFP+ cells, blue) in the lamina propria. Representative of 20 CPs/ILFs analyzed in the small intestine of 4 different Rorc(t)EGFP/+ mice. TH+ fibers are found in proximity to ILC3 clusters but never intercalate with CPs/ILFs. (c) Vasoactive Intestinal Peptide+ (green) neurons (βIII-Tubulin, red) are in close proximity and interacting with ILC3 (GFP+, blue) in CPs/ILFs. Representative of 40 CPs/ILFs analyzed in the small intestine of 4 different Rorc(t)EGFP/+ mice.
Extended Data Figure 4. VIP agonist inhibits in vitro IL-22 production by CCR6+ILC3.
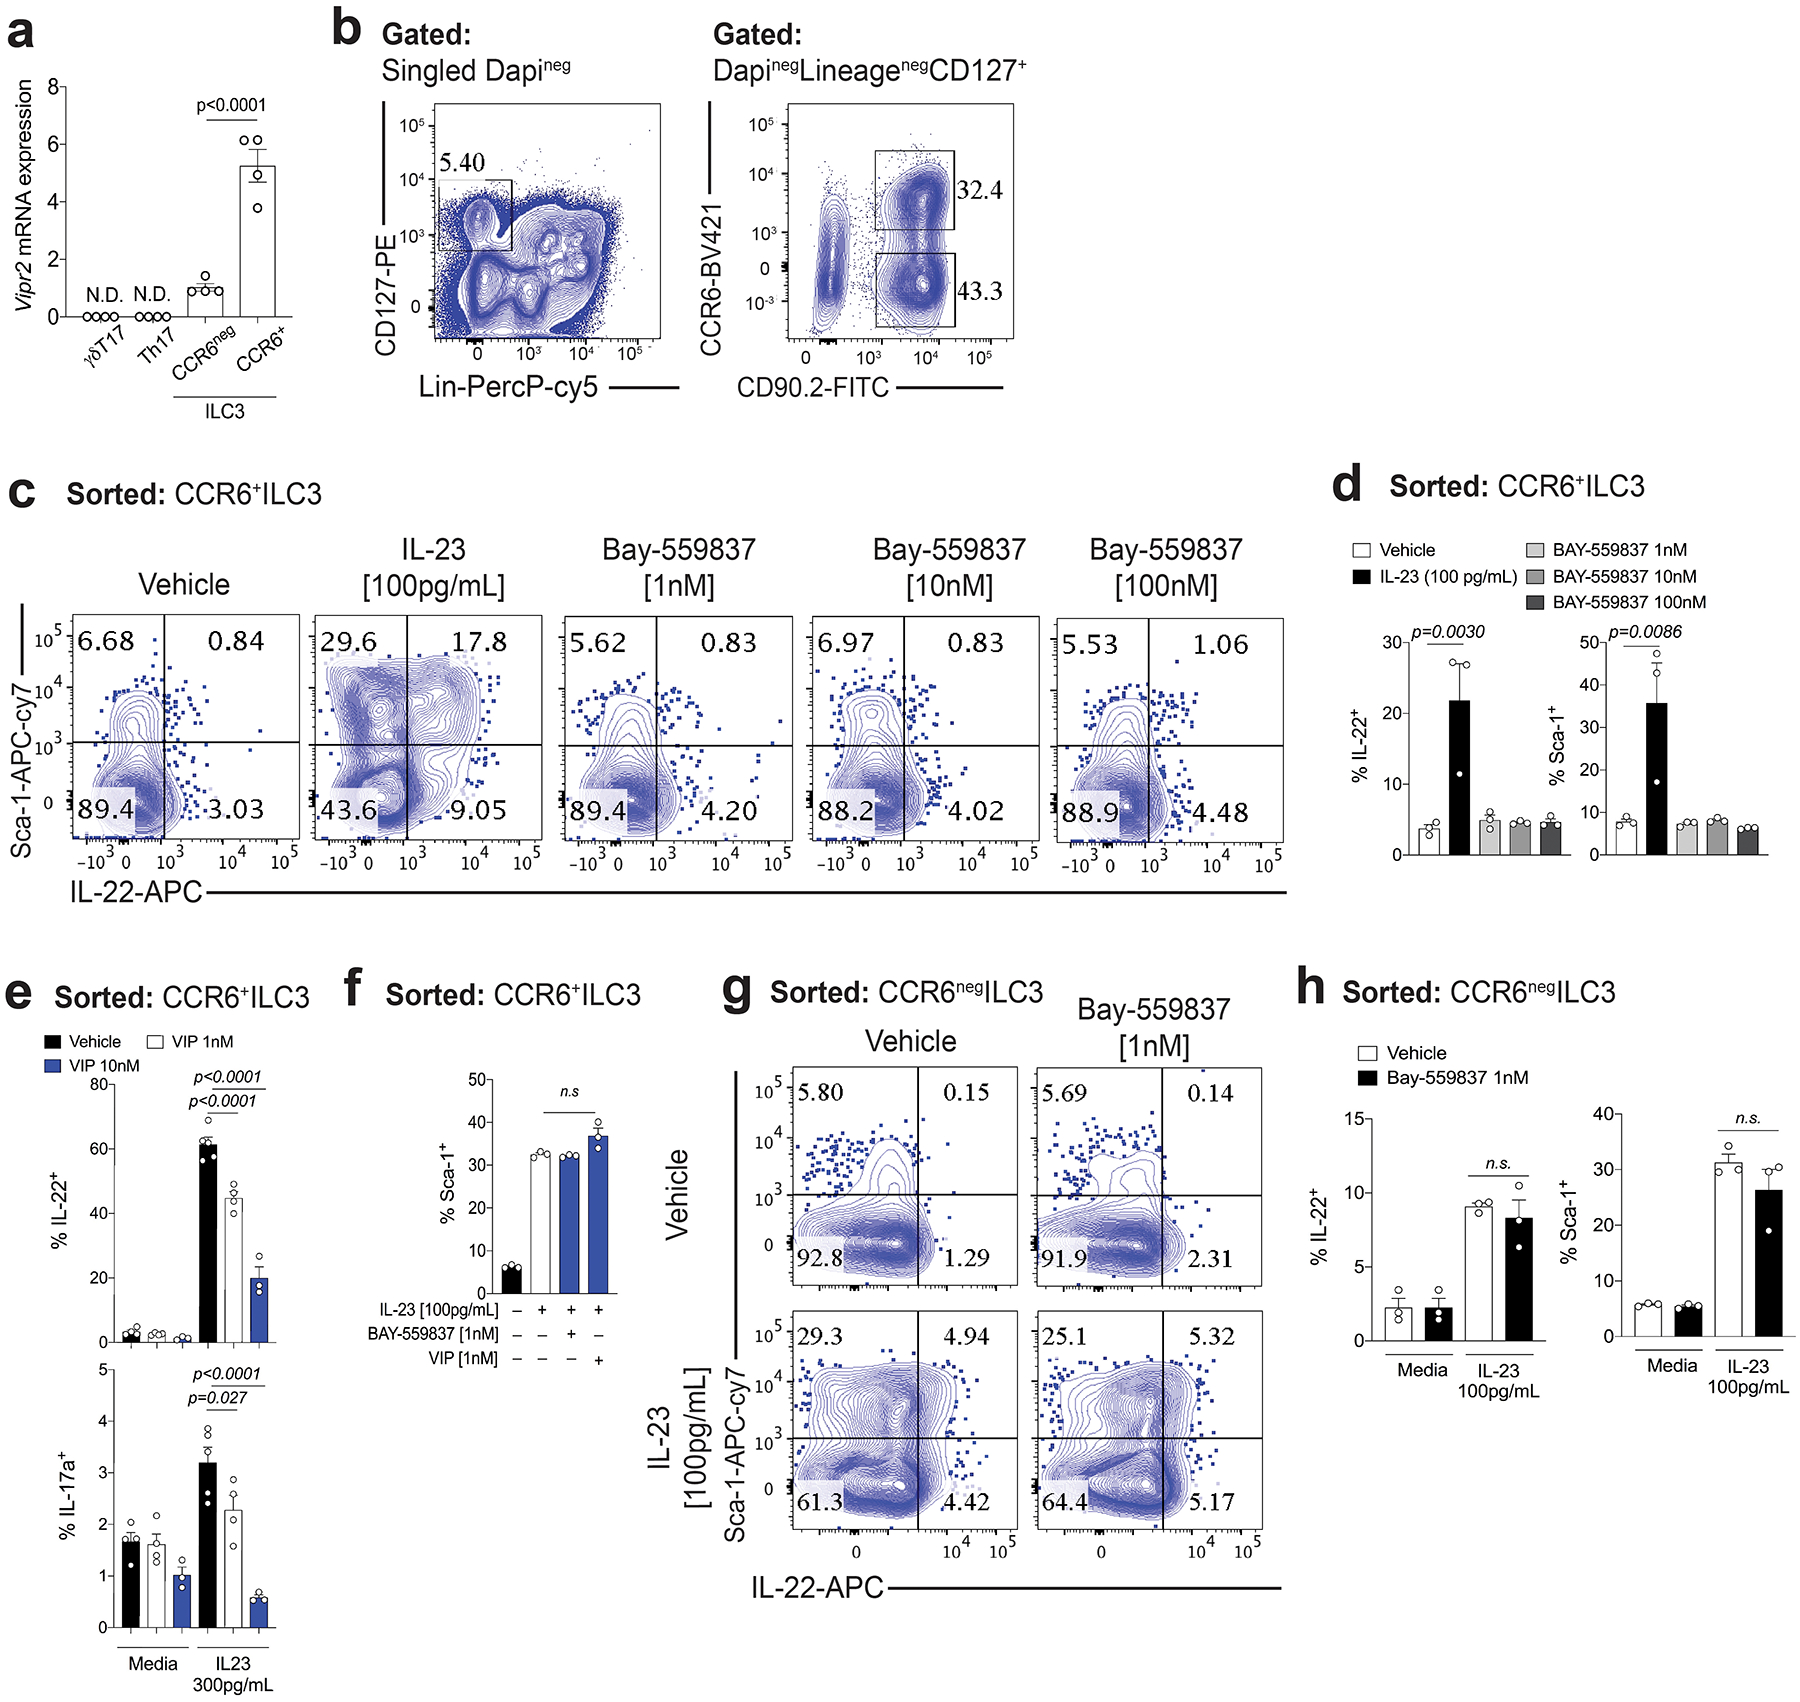
a, Vipr2 mRNA expression (relative to Hprt) in different subtypes of RORγt+ intestinal lymphoid cells, including ILC3 subsets, αβTh17 and γδT17 cells. RNA was isolated from CCR6+ ILC3, CCR6negative ILC3, Th17 (αβ RORγt+T cells) and γδT17 (γδ RORγt+T cell) sorted from small intestine of Rorc(t)-GfpTG mice on basis of following markers: γdT17 cells (LinnegRORgtGFP+CD3+TCRγ+), αβT17 (LinnegRORγtGFP+CD3+TCRβ+), CCR6+ILC3 (LinnegRORγtGFP+CD3neg CCR6+) and CCR6negILC3 (LinnegRORγtGFP+CD3negCCR6neg) (n=4 mice). N.D= not detected. b) FACS plot showing gating strategy for identification and isolation of CCR6+ or CCR6neg ILC3 (DAPInegLinneg CD127+ CD90.2+). c, d, In vitro activation of VIPR2 alone does not induce cytokine production or activation of CCR6+ ILC3. Representative FACS plots (c) and summary (d) for surface Sca-1 expression and intracellular IL-22 in small intestine lamina propria CCR6+ ILC3. n=3 independent biological samples, representative of 2 independent experiments. Mean ± SEM, adjusted p-value (One-way ANOVA, Bonferroni’s multiple comparisons test) e, In vitro activation of VIPR2 promotes concentration-dependent inhibition of cytokine production by CCR6+ ILC3. Summary for IL-22 and IL-17a intracellular expression in small intestine lamina propria CCR6+ ILC3 stimulated in vitro for 12h with IL-23 (300pg/mL) with different concentrations of VIP. n = 3 independent biological samples for VIP 10 nM, and IL-23 + VIP 10 nM. n = 4 independent biological samples for Vehicle, VIP 1 nM, VIP 1nM + IL-23. n = 5 independent biological samples for Vehicle + IL-23. Mean ± SEM, adjusted p-value (One-way ANOVA, Bonferroni’s multiple comparisons test). From 2 independent experiments. f, In vitro activation of VIPR2 does not reduce IL-23-induced Sca-1 expression on CCR6+ ILC3. Summary of Sca-1 expression in small intestine lamina propria CCR6+ ILC3 stimulated in vitro for 12h with IL-23 (100pg/mL) with/without the VIPR2 ligands BAY-559837 or VIP. N=3 independent biological samples, representative of 2 independent experiments. Mean ± SEM, adjusted p-value (One-way ANOVA, Bonferroni’s multiple comparisons test) g, h, In vitro VIPR2 activation does not affect IL-23-induced IL-22 production by CCR6neg ILC3. Representative FACS plots (g) and summaries (h) of surface Sca-1 expression and intracellular IL-22 in small intestine lamina propria CCR6neg ILC3 stimulated in vitro for 12h with IL-23 (100pg/mL) with/without combination with VIPR2 ligand BAY-559837 (1nM). N=3 independent biological samples, and from 2 independent experiments. Mean ± SEM, adjusted p-value (One-way ANOVA, Bonferroni’s multiple comparisons test.
Extended Data Figure 5. VIPR2 is required for in vivo inhibition of IL-22 production by CCR6+ILC3.
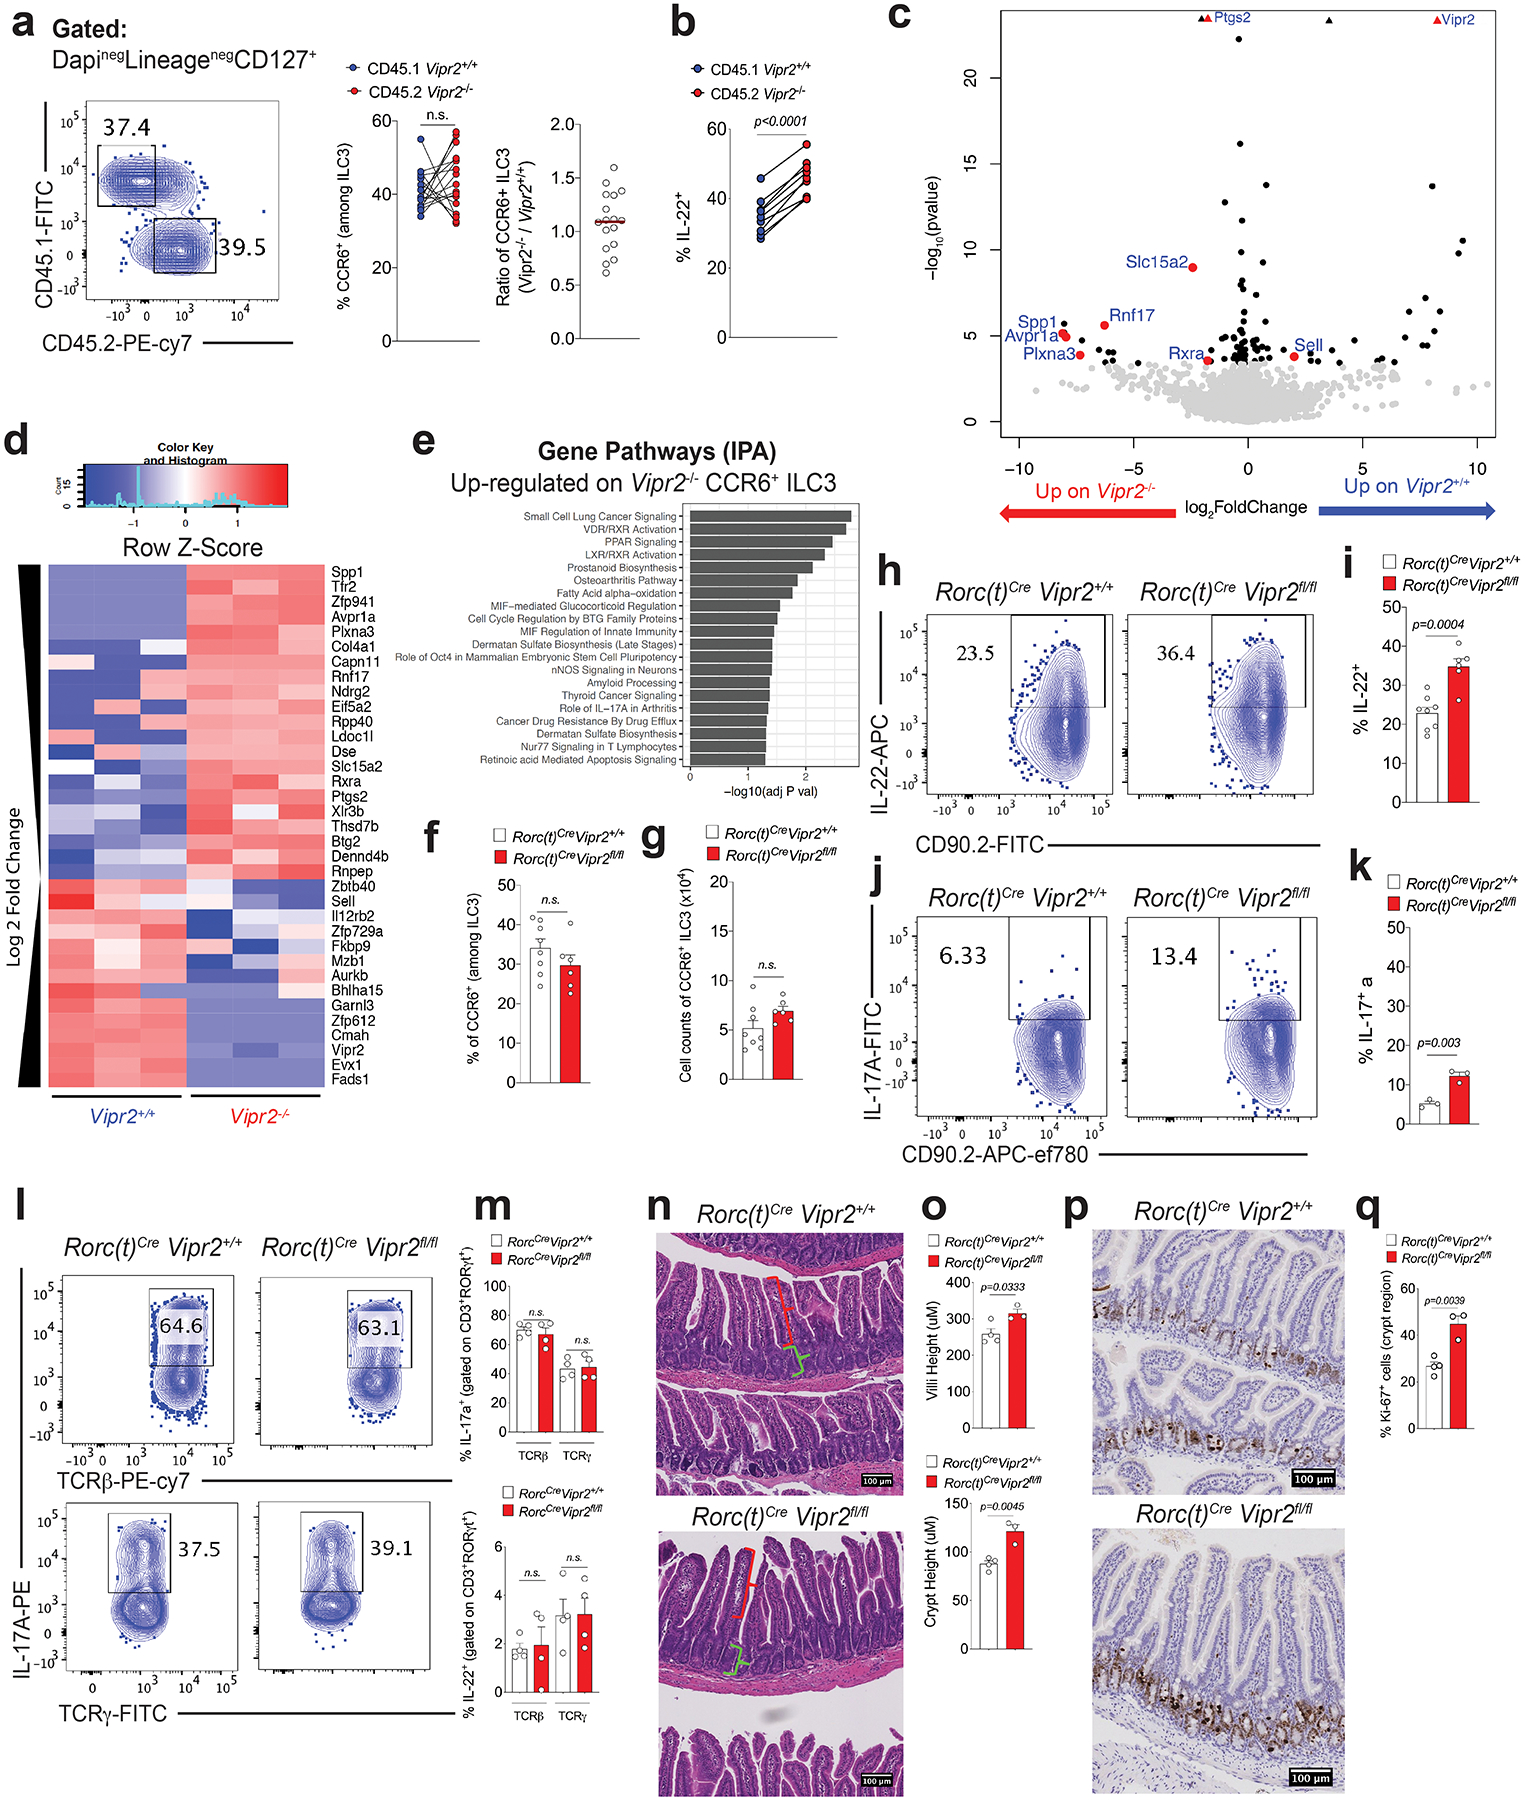
a, b, Mixed bone marrow chimeras, showing (a) no difference in frequency and ratio of WT (Vipr2+/+) vs VIPR2 KO (Vipr2−/−) CCR6+ILC3 in the ileum of mice receiving equal number of cells (N=17 mice, combined from 2 independent experiments) Mean ± SEM, paired t test, and (b) VIPR2-dependent inhibition of IL-22 production in WT (Vipr2+/+, CD45.1) versus VIPR2 KO (Vipr2−/−, CD45.2) CCR6+ ILC3 in the ileum of chimeric mice. N=11 independent biological samples, Mean ± SEM, paired t test. From two independent experiments. c, d, e, Transcriptomic profile showing differences between CCR6+ ILC3 among WT (Vipr2+/+) and VIPR2 KO (Vipr2−/−) isolated from mixed bone marrow chimeras. N = 3 independent biological samples per group (Wald test). (c) Volcano plot and (d) heatmap of selected genes differentially expressed between CCR6+ ILC3 from Vipr2+/+ and Vipr2−/− (FDR 5%, FC>1, Wald test, GSE140502). (e) Analysis of pathways associated with genes upregulated in Vipr2−/− CCR6+ ILC3 compared to Vipr2+/+ CCR6+ ILC3. f, g, Inactivation of Vipr2 in ILC3 and T cells (RORc(t)CreVipr2fl/fl) does not affect (f) proportion or (g) number of CCR6+ ILC3 in the mouse ileum. RORc(t)CreVipr2+/+(n=8 mice) and RORc(t)CreVipr2fl/fl (n=6 mice). Mean ± SEM, two-sided t-test. h, i Frequency of IL-22-producing CCR6+ ILC3 upon inactivation of Vipr2 (RORc(t)CreVipr2fl/fl). Representative FACS plot (h) and summaries (i) indicating frequency of IL-22 production in CCR6+ ILC3 from the ileum of RORc(t)CreVipr2+/+(n=8 mice) and RORc(t)CreVipr2fl/fl (n=6 mice). Mean ± SEM, two-sided t-test. From 3 independent experiments. j, k, IL-17a production in CCR6+ ILC3 upon inactivation of Vipr2. Representative FACS plot (j) and summaries (k) indicating frequency of IL-22 production in CCR6+ ILC3 from the ileum of RORc(t)CreVipr2+/+(n=3 mice) and RORc(t)CreVipr2fl/fl (n=3 mice) mice. Representative of 3 independent experiments. Mean ± SEM, two-sided t-test. l, m, Inactivation of Vipr2 does not affect IL-17a or IL-22 production in CD3+RORγt+ lymphoid populations, namely CD3+ RORγt +TCRγ+TCRβneg (γδT17) and CD3+ RORγt +TCRγnegTCRβ+ (Th17) cells. RORc(t)CreVipr2+/+(n=4 mice) and RORc(t)CreVipr2fl/fl (n=4 mice) mice. Representative of 2 independent experiments. Mean ± SEM, two-sided t-test. FACS plot (l) and summaries (m) indicating frequency of IL-17 and IL22. n.s: not significant. n, o, Intestinal villi and crypt morphology (H&E) indicating the measurement of villi (red bracket) and crypt (green bracket) lengths. Values represent the average length of 60 structures (villi or crypt) per mouse, in a 10cm region, starting 15cm from the pylorus. Mean ± SEM, two-sided t-test. RORc(t)CreVipr2+/+(n=4 mice) and RORc(t)CreVipr2fl/fl (n=3 mice). p, q, Ki-67 and Haematoxilin staining, revealing increased Ki-67+ cells in the crypt region of the small intestine (automated counting). Mean ± SEM, two-sided t-test, RORc(t)CreVipr2+/+(n=4 mice) and RORc(t)CreVipr2fl/fl (n=3 mice).
Extended Data Figure 6. Effect of VIPergic neuronal modulation with DREADDs on IL-22 production by CCR6+ ILC3.
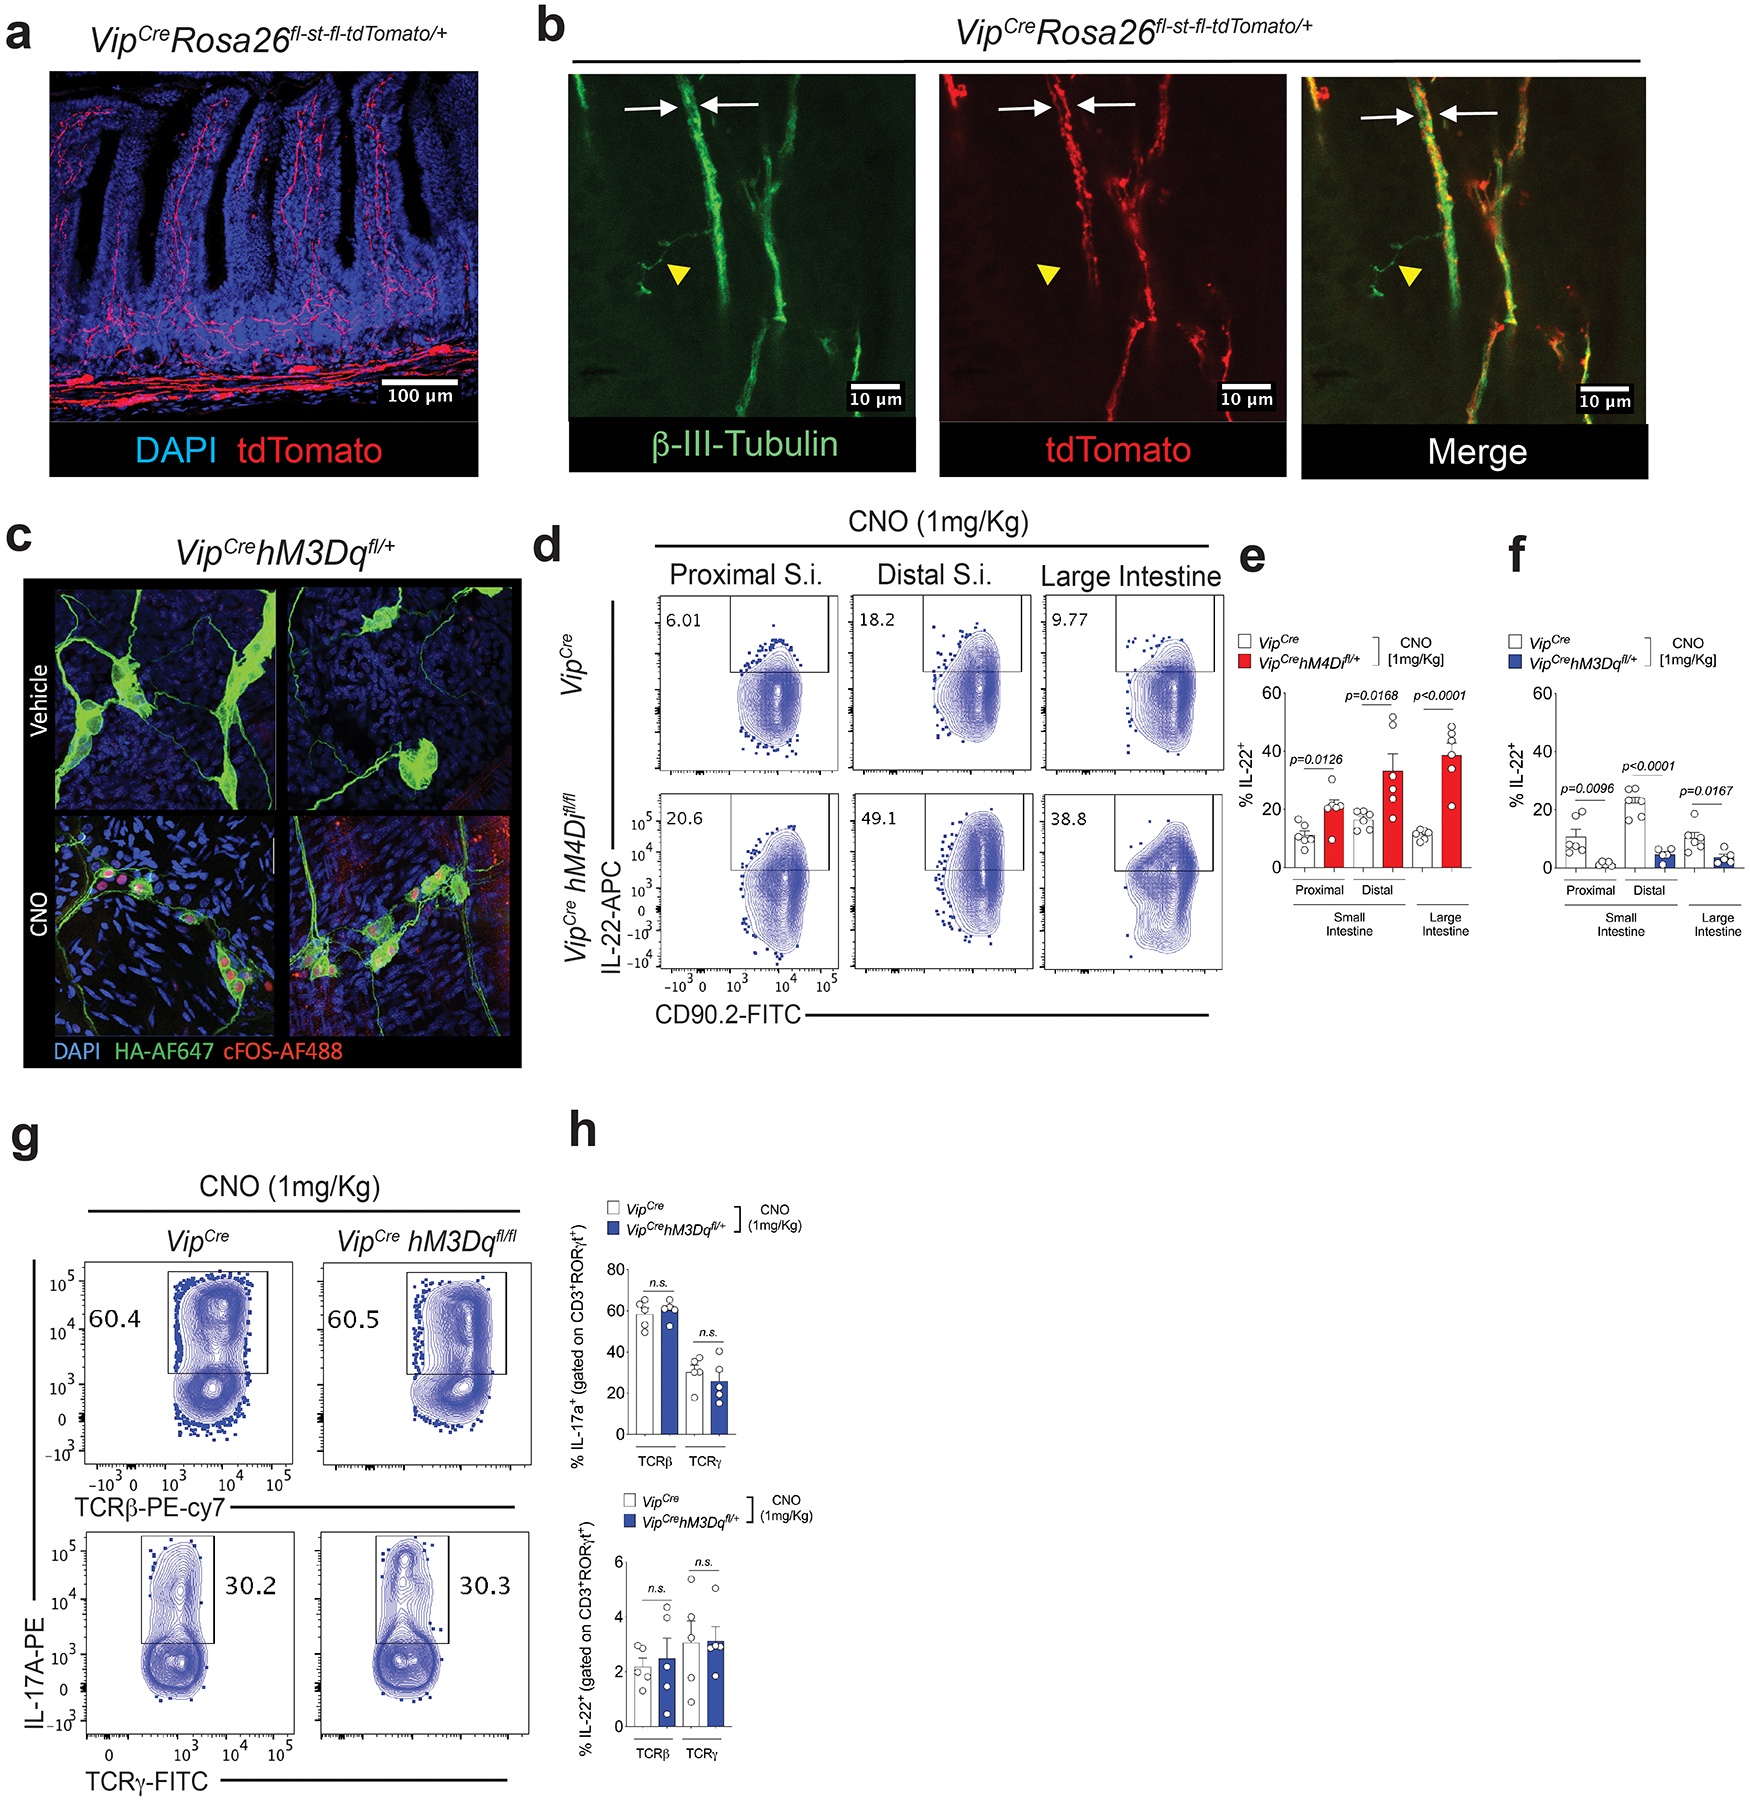
a, b, VIPCre activity in neurons in the gut. Homozygous VIPCre mice were bred to homozygous Rosa26fl-st-fl-tdTomato. (a) Distribution of tdTomato+ projections in the small intestine lamina propia. tdTomato: red; nucleus/Dapi: blue. (b) tdTomato positive and negative neurons present in the small intestine. tdTomato: red; pan=neuronal marker β3-tubulin: green. Two distinct β3-tubulin+ tdTomato+ neuronal projections (white arrows) can be observed in a bundle of enteric neurons in the villi. Yellow: β3-tubulin+ tdTomatonegative projection. c, Nuclear cFOS localization in VIPergic neurons 2h after CNO (1mg/Kg, i.p.) or vehicle treatment of mice expressing the DREADD for activation under the control of VIPCre (VIPCre hM3Dqfl/+). cFOS-AF488: red, hM3Dq-TA-AF647: green, Nucleus/Dapi: blue. d, e, f, Effect of chemogenetic modulation of VIPergic neurons on IL-22 production by CCR6+ ILC3 in the small intestine (S.I.) and large intestine (L.I.). Representative FACS plot (d) and summaries of IL-22 production by CCR6+ ILC3 in mice expressing the DREADD for inhibition (hM4Di) (e) and for activation (hM3Dq) (f). All the mice were treated with CNO (1mg/Kg, i.p, twice, 24h before sample collection). (e): n=6 mice/group. (f) VIPCre (n=6 mice/group) and VIPCrehM3DqCre : (n=5 mice/group). Mean ± SEM, two-sided t-test. g, h, No difference in the frequencies of IL-17 and IL-22 production by CD3+ RORγt +TCRγ+TCRβneg (γδT17) and CD3+ RORγt +TCRγnegTCRβ+ (Th17) cells after activation of VIPergic neurons. Representative FACS plot (g) and summaries (h) Mean ± SEM, two-sided t-test. n=5 mice/group. All the mice were treated with CNO (1mg/Kg, i.p, twice, 24h before sample collection).
Extended Data Figure 7. VIPergic neurons regulate host resistance to enteropathogenic Citrobacter rodentium.
a, Normalized Vip mRNA expression in the large intestine (cecum and proximal colon) of C57BL/6 mice at different time points after oral infection with Citrobacter rodentium (2×10⁹ CFU). Day 0: n=4 mice; 2, 4 and 9 days after infection: n=6 mice/group. Mean ± SEM, one-way ANOVA. b, c, Increased VIP activity in the gastrointestinal tract but not systemically in mice infected with C. rodentium. Concentrations of VIP in plasma from the (b) hepatic portal vein, which drains the gastrointestinal tract, and (c) peripheral blood of mice at different time points after intragastric administration of vehicle or C. rodentium (2×10⁹ CFU). d.p.i: days post-intragastric infection with C. rodentium. Data shown are pooled from two independent experiments. N=8 mice/group, two-sided t-test. d, Off -target effects of CNO treatment do not account for mortality observed using activating DREADD during C. rodentium infection. Survival rates for C. rodentium-infected VipIRES-Cre or VipIRES-CrehM3Dqfl-stop-fl/+ mice treated with CNO (1mg/Kg, daily, 1–4 d.p.i.: yellow rectangle). Vehicle: n=11 mice, CNO: n=9 mice. e, f, Infectious burden in feces of (e) VipIRES-CrehM3Dqfl-stop-fl/+ mice (activating DREADD, Vehicle, n=11 mice; CNO n=9 mice), and (f) VipIRES-CrehM4Difl-stop-fl/+ mice (inhibitory DREADD, Vehicle, n=8 mice; CNO n=7 mice). Mice were treated with vehicle or CNO (1mg/Kg, daily) 1–4 days post-intragastric infection with 2×10⁹ CFU (for VipIRES-CrehM3Dqfl-stop-fl/+mice) or 4×10¹⁰ CFU for (VipIRES-CrehM4Difl-stop-fl/+ mice). Log10 Colony Forming Units (CFU) of C. rodentium 9 days post-oral innoculation (9 d.p.i.). Median, two-tailed Mann-Whitney test. Data representative of two independent experiments. g, h, Exogenous treatment with recombinant murine IL-22 (rmIL-22, 250μg/mouse/day) protects against increase in (g) mortality and (h) bacterial dissemination to the spleen induced by VIPergic activation of VipIRES-CrehM3Dqfl-stop-fl/+mice. Mantel Cox test, survival (g); Median, two-tailed Mann-Whitney test (h). Daily treatment, 1-4 d.p.i.: blue horizontal bar. For visualization in the logarithm scale (e-g), CFU counts of 0 were attributed a value of 1. i, j, Inactivation of Vipr2 expression in ILC3 (RORc(t)CreVipr2fl/fl) enhances barrier protection after oral infection with the enteropathogen C. rodentium (3×10¹⁰ CFU) (i) Discrete protection for weight loss in the first 9 days after infection. Mean, two-way ANOVA. (j,) Log10 Colony Forming Units (CFU) of C. rodentium 9 days post-oral inoculation with 3×10¹⁰ CFU. RORc(t)CreVipr2fl/fl mice display reduced amounts of C. rodentium translocation to the spleen and liver, and reduced CFU counts in the feces. RORc(t)CreVipr2+/+n=10 mice and RORc(t)CreVipr2fl/fl n=10 mice. Mean ± SEM, two-way ANOVA (i) and two-tailed Mann-Whitney test (j). For visualization in the logarithm scale (e-g), CFU counts of 0 were attributed a value of 1.
Extended Data Figure 8. Feeding controls intestinal VIP release and IL-22 production by CCR6+ ILC3 via activation of VIPR2.
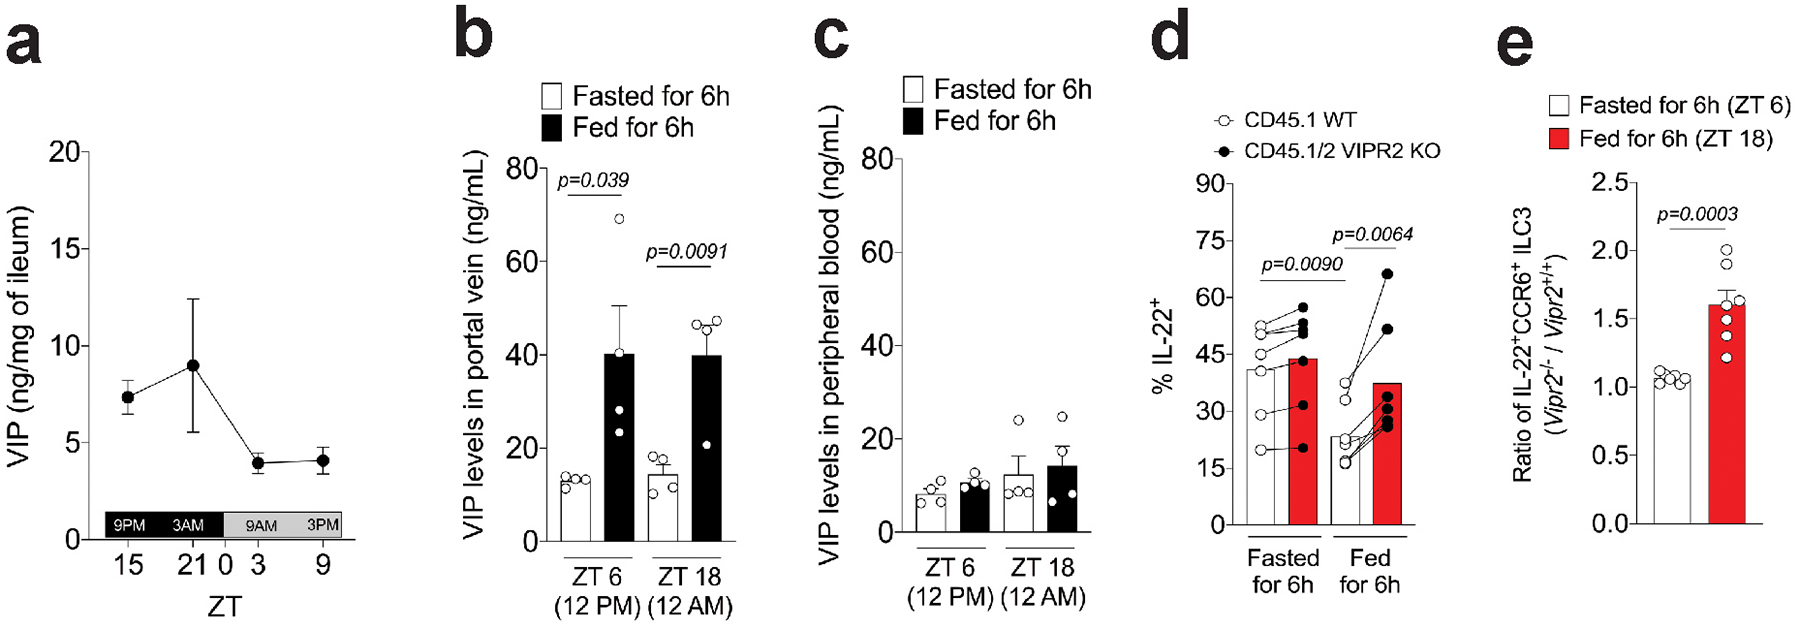
a, Measurement of concentration of VIP in the ileum reveals higher amounts during dark-phase (feeding period, ZT12-ZT0) than in the light-phase (resting period, ZT0-ZT12). n=3 mice per time point, representative of two independent experiments. Mean ± SEM. b, Concentrations of VIP in plasma isolated from hepatic portal vein blood of mice fed or fasted for 6 h. Blood samples were collected at two different time-points, during the light-phase period (ZT 6, 12PM) and the dark-phase period (ZT 18, 12AM). n=4 mice per group, Mean ± SEM, two-sided t-test. From two independent experiments. c, Concentrations of VIP in plasma isolated from the peripheral blood of mice. n=4 mice per group, Mean ± SEM. From two independent experiments. Blood samples were collected at the same time point as in Extended Data Figure 8b. d, IL-22 expression by CCR6+ ILC3 from the ileum of CD45.1 Vipr2+/+:CD45.2 Vipr2−/− bone marrow chimeric mice at 6h after fasting (fasted, ZT 6) and 6h after feeding (fed, ZT 18). n=7 mice per group, two-sided paired t-test. From two pooled independent experiments. e, Ratio of IL-22-expressing cells, relative to Extended Data Figure 8d, among CCR6+ ILC3 from the ileum of CD45.1 Vipr2+/+:CD45.2 Vipr2−/− bone marrow chimeric mice at 6h after fasting (Fasted, ZT 6) and 6h after feeding (Fed, ZT 18). n=7, ***P<0.001 (t-test).
Extended Data Figure 9. Loss of Vipr2 expression in ILC3 (RORc(t)CreVipr2fl/fl mice) affects the growth of epithelium-associated SFB and the composition of ileal and fecal commensal microbiota.
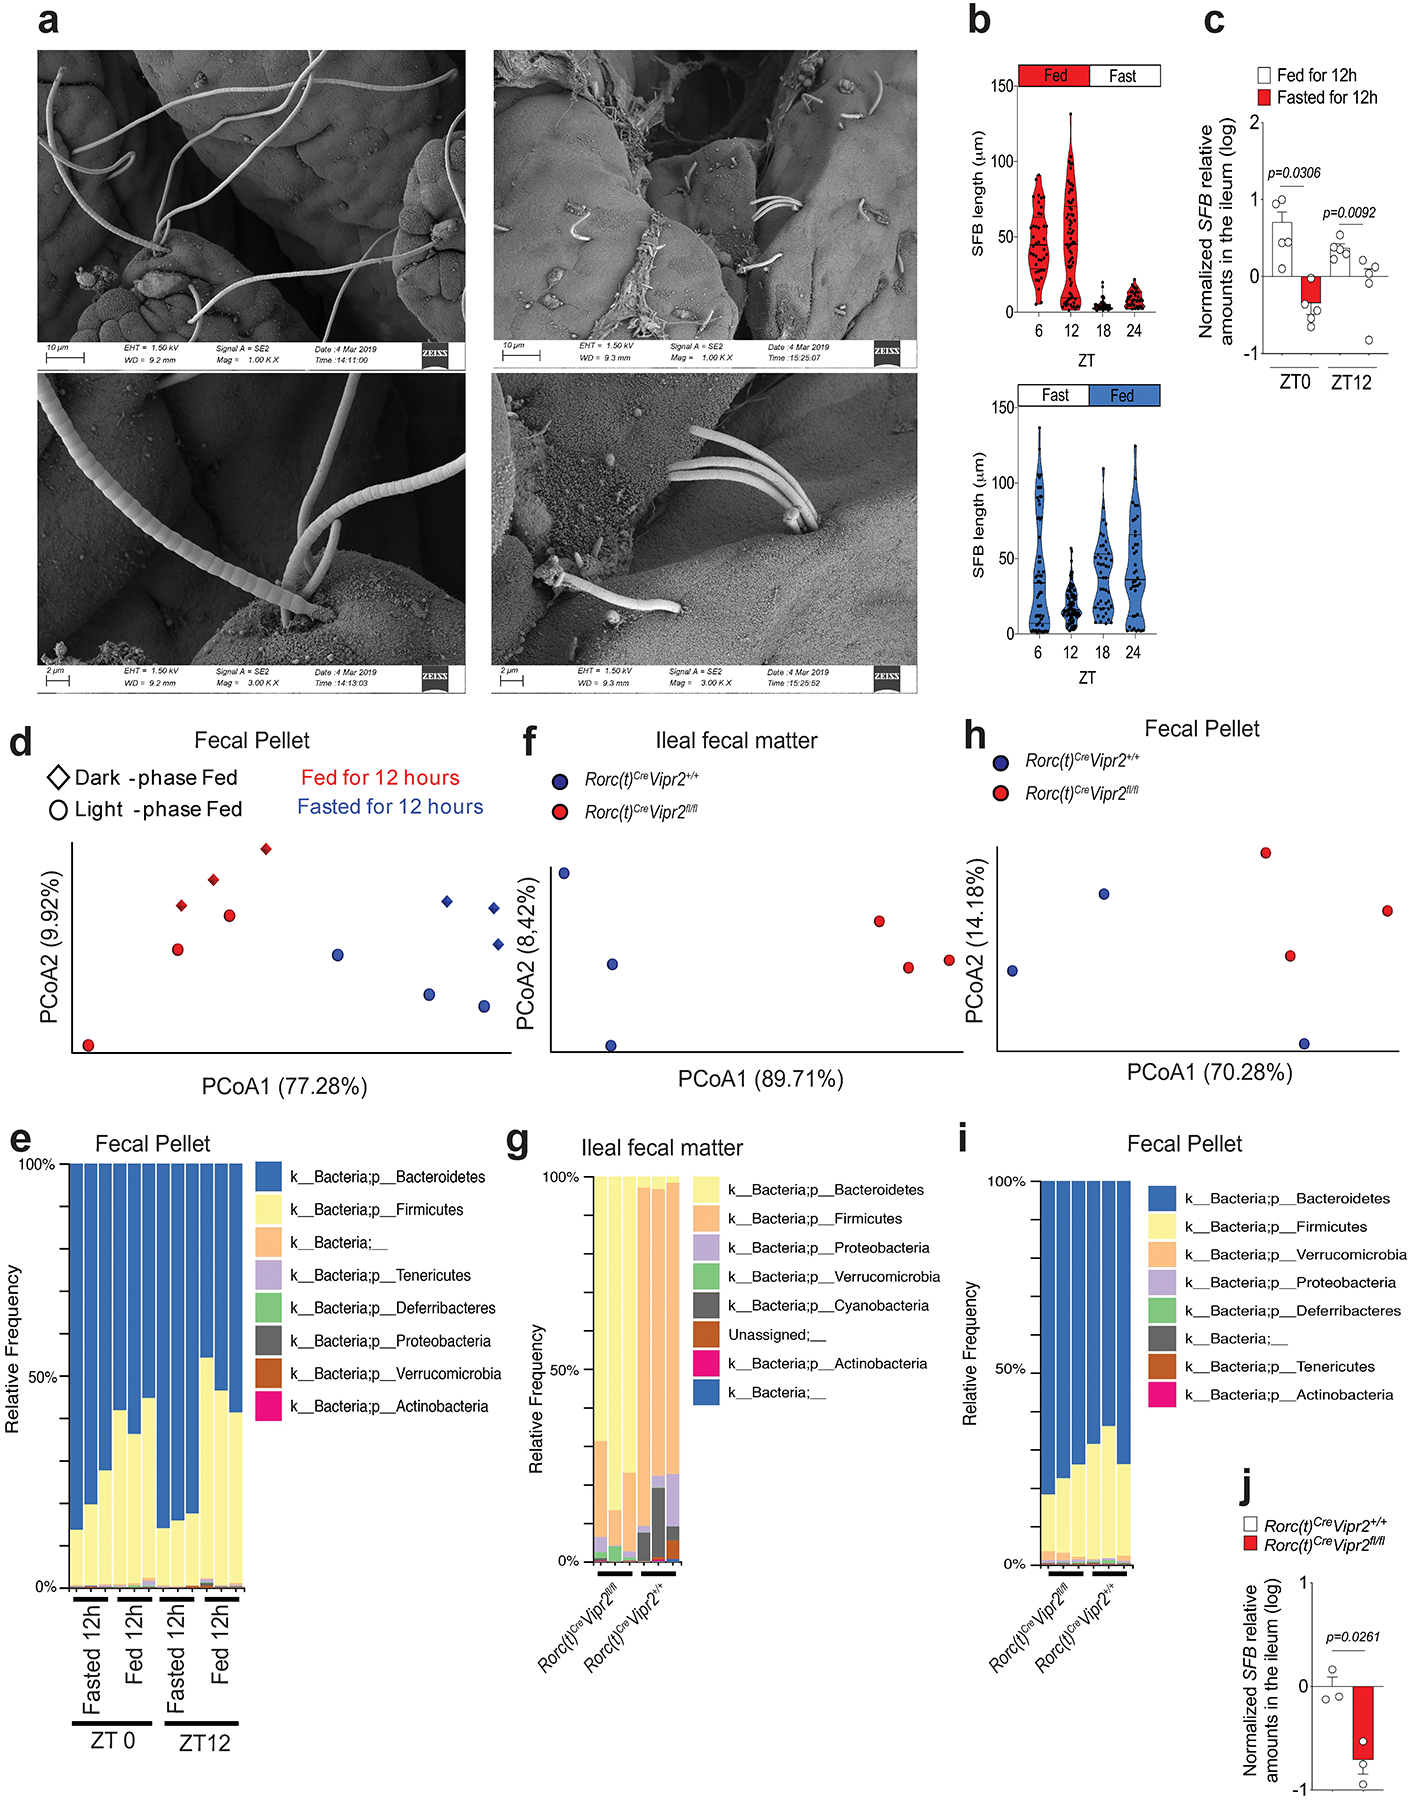
a, Representative SEM images (magnifications: 1K, upper pannel, and 3K, lower pannel) showing epithelial-attached SFB in the ileum of mice 12 h after feeding (long filaments) or fasting (short-filaments, “stubbles”) at ZT 0. Data representative of 2 independent experiments. b, Violin plot distribution of SFB length at different time points during the day in mice that had been fed for two weeks during the light-phase (Light-phase fed: ZT0 to ZT12, red) or during the dark-phase (dark-phase fed: ZT12 to ZT0, blue). Measurements of SFB filament length were performed from a minimum of 2 random fields for each mouse (each dot represents an individual filament). N=3 mice per group, and bars show mean (one-way ANOVA). From 2 independent experiments. Blue or red shape show the distribution of the data. c, Relative amounts (log) of SFB 16S measured in the ileal tissue by qPCR, normalized based on host genomic DNA quantity. Mice were fed for two weeks during the light-phase or during the dark-phase and the ileal tissue was collected at two different time points, ZT0 or ZT12. n=5 mice per group, Mean ± SEM, two-sided t-test. d, Weighted Unifrac principal coordinate analysis of 16S rRNA composition in the fecal pellet of mice that had been fed for two weeks during the light-phase (circles) or during the dark-phase (diamonds) (PRJNA594406). Fecal samples were collected from the same mice at different time points (ZT0 or ZT12). n=3 mice per group. Dark-phase fed: at ZT0 these mice had been fed for 12h (red diamond), while at ZT12 they had fasted for 12h (blue diamond); Light-phase fed: at ZT0 these mice had fasted for 12h (blue circle), while at ZT12 they had been fed for 12h (red circle). e, Phylogenetic profile of the fecal microbiota composition associated with feeding/fasting status in the mice from Extended Data Figure 9d. f, Weighted Unifrac Principal coordinate analysis (PCoA) of 16S rRNA composition in the ileal fecal material from RORc(t)Cre Vipr2+/+ (n=3) or RORc(t)Cre Vipr2fl/fl (n=3) mice (male, 8 weeks old) that had been fed for two weeks only during the dark-phase. Samples were collected at ZT0 (12h fed). This cohort is composed of 3 distinct pairs of RORc(t)Cre Vipr2+/+ and RORc(t)Cre Vipr2fl/fl littermates/cagemates, with each pair housed in different cages. g, Phylogenetic profile of the microbiota composition in the ileal fecal material of RORc(t)Cre Vipr22+/+ or RORc(t)Cre Vipr2fl/fl mice after 12h of feeding. h, Weighted Unifrac Principal coordinate analysis (PCoA) of 16S rRNA composition in fecal pellet of the same mice described above from (RORc(t)Cre Vipr2+/+ or RORc(t)Cre Vipr2fl/fl mice). i, Phylogenetic profile of the microbiota composition in the fecal pellet of RORc(t)Cre Vipr2+/+ or RORc(t)Cre Vipr2fl/fl mice after 12h of feeding. j, Relative amounts (log) of SFB 16S measured in the ileal tissue from RORc(t)Cre Vipr2+/+ (n=3) or RORc(t)Cre Vipr2fl/fl (n=3) mice (male, 8 weeks old) that had been fed for two weeks only during the dark-phase. Samples were collected at ZT0 (12h fed). SFB levels were normalized based on host gDNA levels (Hif1a). This cohort is composed of 3 distinct pairs of RORc(t)Cre Vipr2+/+ and RORc(t)Cre Vipr2fl/fl littermates/cagemates, with each pair housed in different cages. Mean ± SEM, two-sided t-student. From 2 independent experiments.
Extended Data Figure 10. Feeding increase the efficiency of triglyceride absorption.
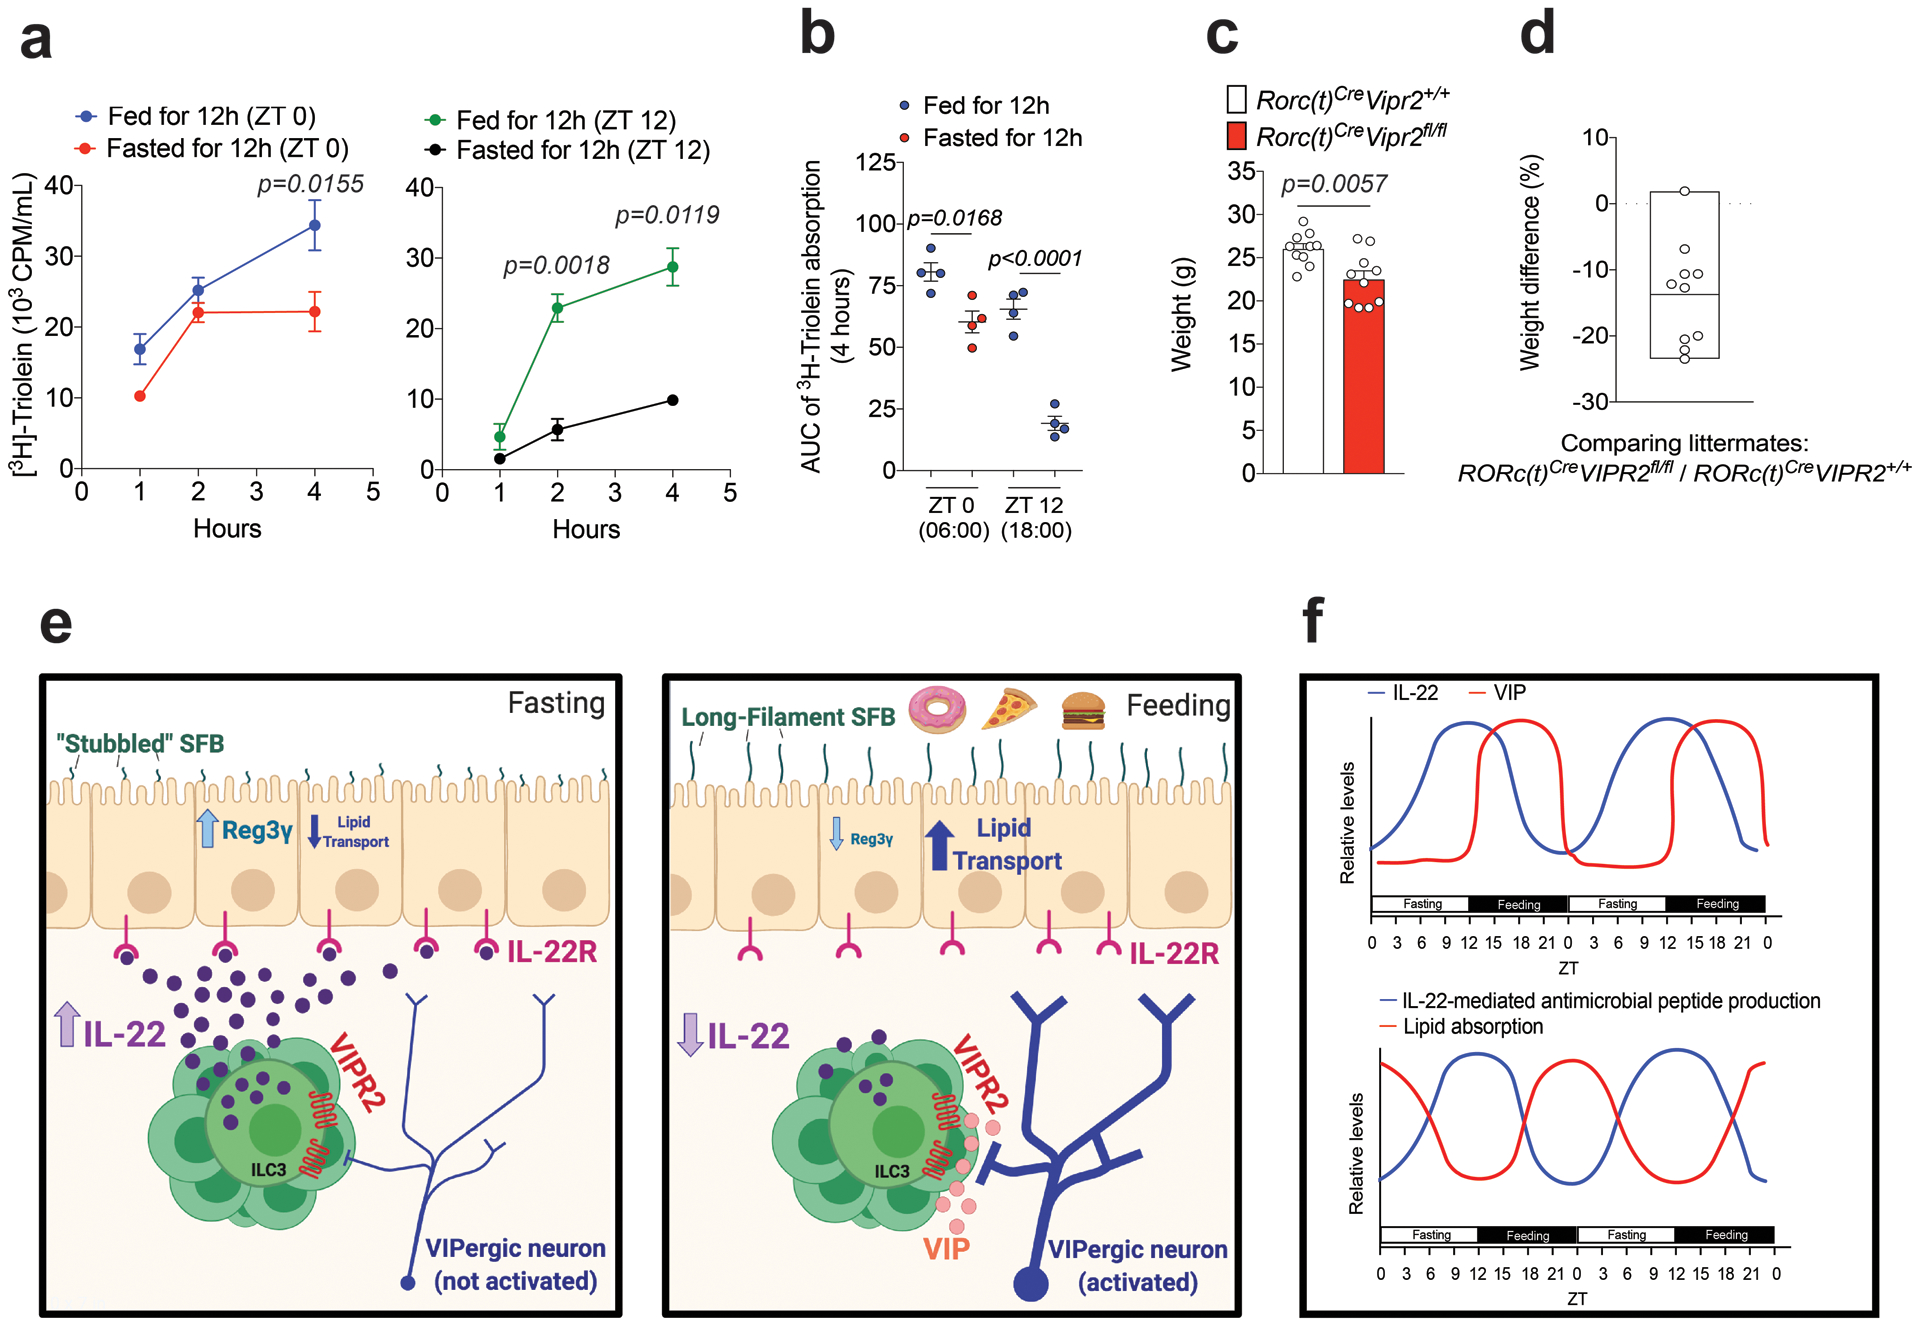
a, b, Plasma 3H CPM (counts per minute) in mice fed or fasted for 12h during the light-phase (ZT 0 – ZT 12, red and green circles) or during the dark-phase (ZT 12 – ZT 0, blue and black circles) and then gavaged with 3H-triolein and sampled at different times (a); and AUC during 4h (b). AUC: Area under the curve per mL of plasma. n=4 mice per group, Mean ± SEM, two-way ANOVA (a) and one-way ANOVA (b). From 2 independent experiments. c, Weight of 10 littermate/cagemate pairs of RORc(t)Cre Vipr2+/+ and RORc(t)Cre Vipr2fl/fl mice under regular chow diet (male, 9 weeks old). Mean ± SEM, two-sided t-test. Representative of two independent experiments (males and females). d, Weight difference (%) between each RORc(t)Cre Vipr2fl/fl (n=10) compared to its paired RORc(t)Cre Vipr2+/+ littermate/cagemate (n=10) mice from Extended data Figure 10c. Mean (box limits represent the minimum and maximum values observed). e,f, Graphical abstract (e) and theoretical model (f) of the observations described created with BioRender.
Supplementary Material
Acknowledgements
We thank members of the Littman lab and Juan J. Lafaille for valuable discussion. We thank S.Y. Kim and the NYU Rodent Genetic Engineering Laboratory (RGEL) for generating the mutant mice, Cindy Loomis and the Experimental Pathology Research Laboratory of NYULMC for histology of small intestine samples, and Adriana Heguy and the Genome Technology Center (GTC) for RNA sequencing. We also thank F-X. Liang, J. Sall, C. Petzold and K. Dancel at the Microscopy Laboratory Core for timely preparation of the scanning electron microscopy images, and M. Cammer and Y. Deng for the help with optical microscopy. The Microscopy Core and the GTC are partially supported by NYU Cancer Center Support Grant NIH/NCI P30CA016087 at the Laura and Isaac Perlmutter Cancer Center, S10 RR023704-01A1 and NIH S10 ODO019974-01A1. The Experimental Pathology Research Laboratory is supported by National Institutes of Health Shared Instrumentation grants S10OD010584-01A1 and S10OD018338-01. This study benefitted from data assembled by the ImmGen Consortium. This work was supported by the Pew Latin American Fellows program (J.T.), the Helen and Martin Kimmel Center for Biology and Medicine (D.R.L.); and National Institutes of Health grant R01DK103358 (D.R.L.). D.R.L. is an Investigator of the Howard Hughes Medical Institute.
Footnotes
Declaration of Interests
The authors declare no competing interests. D.R.L. consults and has equity interest in Chemocentryx, Vedanta, and Pfizer Pharmaceuticals.
REFERENCES
- 1.Constantinides MG. Interactions between the microbiota and innate and innate-like lymphocytes. J Leukoc Biol. 2018;103(3):409–419. [DOI] [PubMed] [Google Scholar]
- 2.Sonnenberg GF. Regulation of intestinal health and disease by innate lymphoid cells. Int Immunol. 2014;26(9):501–507. [DOI] [PMC free article] [PubMed] [Google Scholar]
- 3.Spits H, Cupedo T. Innate lymphoid cells: emerging insights in development, lineage relationships, and function. Annu Rev Immunol. 2012;30:647–675. [DOI] [PubMed] [Google Scholar]
- 4.Chayvialle JA, Miyata M, Rayford PL, Thompson JC. Effects of test meal, intragastric nutrients, and intraduodenal bile on plasma concentrations of immunoreactive somatostatin and vasoactive intestinal peptide in dogs. Gastroenterology. 1980;79(5 Pt 1):844–852. [PubMed] [Google Scholar]
- 5.Sano T, Huang W, Hall JA, et al. An IL-23R/IL-22 Circuit Regulates Epithelial Serum Amyloid A to Promote Local Effector Th17 Responses. Cell. 2015;163(2):381–393. [DOI] [PMC free article] [PubMed] [Google Scholar]
- 6.Savage AK, Liang HE, Locksley RM. The Development of Steady-State Activation Hubs between Adult LTi ILC3s and Primed Macrophages in Small Intestine. J Immunol. 2017;199(5):1912–1922. [DOI] [PMC free article] [PubMed] [Google Scholar]
- 7.Longman RS, Diehl GE, Victorio DA, et al. CX(3)CR1(+) mononuclear phagocytes support colitis-associated innate lymphoid cell production of IL-22. J Exp Med. 2014;211(8):1571–1583. [DOI] [PMC free article] [PubMed] [Google Scholar]
- 8.Mao K, Baptista AP, Tamoutounour S, et al. Innate and adaptive lymphocytes sequentially shape the gut microbiota and lipid metabolism. Nature. 2018;554(7691):255–259. [DOI] [PubMed] [Google Scholar]
- 9.Zheng Y, Valdez PA, Danilenko DM, et al. Interleukin-22 mediates early host defense against attaching and effacing bacterial pathogens. Nat Med. 2008;14(3):282–289. [DOI] [PubMed] [Google Scholar]
- 10.Ibiza S, Garcia-Cassani B, Ribeiro H, et al. Glial-cell-derived neuroregulators control type 3 innate lymphoid cells and gut defence. Nature. 2016;535(7612):440–443. [DOI] [PMC free article] [PubMed] [Google Scholar]
- 11.Mortha A, Chudnovskiy A, Hashimoto D, et al. Microbiota-dependent crosstalk between macrophages and ILC3 promotes intestinal homeostasis. Science. 2014;343(6178):1249288. [DOI] [PMC free article] [PubMed] [Google Scholar]
- 12.Hooper LV, Littman DR, Macpherson AJ. Interactions between the microbiota and the immune system. Science. 2012;336(6086):1268–1273. [DOI] [PMC free article] [PubMed] [Google Scholar]
- 13.Dudakov JA, Hanash AM, van den Brink MR. Interleukin-22: immunobiology and pathology. Annu Rev Immunol. 2015;33:747–785. [DOI] [PMC free article] [PubMed] [Google Scholar]
- 14.Eberl G, Marmon S, Sunshine MJ, Rennert PD, Choi Y, Littman DR. An essential function for the nuclear receptor RORgamma(t) in the generation of fetal lymphoid tissue inducer cells. Nat Immunol. 2004;5(1):64–73. [DOI] [PubMed] [Google Scholar]
- 15.Gury-BenAri M, Thaiss CA, Serafini N, et al. The Spectrum and Regulatory Landscape of Intestinal Innate Lymphoid Cells Are Shaped by the Microbiome. Cell. 2016;166(5):1231–1246 e1213. [DOI] [PubMed] [Google Scholar]
- 16.Pokrovskii M, Hall JA, Ochayon DE, et al. Characterization of Transcriptional Regulatory Networks that Promote and Restrict Identities and Functions of Intestinal Innate Lymphoid Cells. Immunity. 2019. [DOI] [PMC free article] [PubMed] [Google Scholar]
- 17.Heng TS, Painter MW, Immunological Genome Project C. The Immunological Genome Project: networks of gene expression in immune cells. Nat Immunol. 2008;9(10):1091–1094. [DOI] [PubMed] [Google Scholar]
- 18.Furness JB. The enteric nervous system and neurogastroenterology. Nat Rev Gastroenterol Hepatol. 2012;9(5):286–294. [DOI] [PubMed] [Google Scholar]
- 19.Muller PA, Koscso B, Rajani GM, et al. Crosstalk between muscularis macrophages and enteric neurons regulates gastrointestinal motility. Cell. 2014;158(2):300–313. [DOI] [PMC free article] [PubMed] [Google Scholar]
- 20.Cardoso V, Chesne J, Ribeiro H, et al. Neuronal regulation of type 2 innate lymphoid cells via neuromedin U. Nature. 2017;549(7671):277–281. [DOI] [PMC free article] [PubMed] [Google Scholar]
- 21.Klose CSN, Mahlakoiv T, Moeller JB, et al. The neuropeptide neuromedin U stimulates innate lymphoid cells and type 2 inflammation. Nature. 2017;549(7671):282–286. [DOI] [PMC free article] [PubMed] [Google Scholar]
- 22.Margolis KG, Gershon MD. Enteric Neuronal Regulation of Intestinal Inflammation. Trends Neurosci. 2016;39(9):614–624. [DOI] [PMC free article] [PubMed] [Google Scholar]
- 23.Zwarycz B, Gracz AD, Rivera KR, et al. IL22 Inhibits Epithelial Stem Cell Expansion in an Ileal Organoid Model. Cell Mol Gastroenterol Hepatol. 2019;7(1):1–17. [DOI] [PMC free article] [PubMed] [Google Scholar]
- 24.Zha JM, Li HS, Lin Q, et al. Interleukin 22 Expands Transit-Amplifying Cells While Depleting Lgr5(+) Stem Cells via Inhibition of Wnt and Notch Signaling. Cell Mol Gastroenterol Hepatol. 2019;7(2):255–274. [DOI] [PMC free article] [PubMed] [Google Scholar]
- 25.Roth BL. DREADDs for Neuroscientists. Neuron. 2016;89(4):683–694. [DOI] [PMC free article] [PubMed] [Google Scholar]
- 26.Conlin VS, Wu X, Nguyen C, et al. Vasoactive intestinal peptide ameliorates intestinal barrier disruption associated with Citrobacter rodentium-induced colitis. Am J Physiol Gastrointest Liver Physiol. 2009;297(4):G735–750. [DOI] [PubMed] [Google Scholar]
- 27.Kohsaka A, Laposky AD, Ramsey KM, et al. High-fat diet disrupts behavioral and molecular circadian rhythms in mice. Cell Metab. 2007;6(5):414–421. [DOI] [PubMed] [Google Scholar]
- 28.Park O, Wang H, Weng H, et al. In vivo consequences of liver-specific interleukin-22 expression in mice: Implications for human liver disease progression. Hepatology. 2011;54(1):252–261. [DOI] [PMC free article] [PubMed] [Google Scholar]
- 29.Smith PM, Howitt MR, Panikov N, et al. The microbial metabolites, short-chain fatty acids, regulate colonic Treg cell homeostasis. Science. 2013;341(6145):569–573. [DOI] [PMC free article] [PubMed] [Google Scholar]
- 30.Mullineaux-Sanders C, Suez J, Elinav E, Frankel G. Sieving through gut models of colonization resistance. Nat Microbiol. 2018;3(2):132–140. [DOI] [PubMed] [Google Scholar]
- 31.McVey Neufeld KA, Perez-Burgos A, Mao YK, Bienenstock J, Kunze WA. The gut microbiome restores intrinsic and extrinsic nerve function in germ-free mice accompanied by changes in calbindin. Neurogastroenterol Motil. 2015;27(5):627–636. [DOI] [PubMed] [Google Scholar]
- 32.McVey Neufeld KA, Mao YK, Bienenstock J, Foster JA, Kunze WA. The microbiome is essential for normal gut intrinsic primary afferent neuron excitability in the mouse. Neurogastroenterol Motil. 2013;25(2):183–e188. [DOI] [PubMed] [Google Scholar]
- 33.Chayvialle JA, Miyata M, Rayford PL, Thompson JC. Release of vasoactive intestinal peptide by distention of the proximal stomach in dogs. Gut. 1980;21(9):745–749. [DOI] [PMC free article] [PubMed] [Google Scholar]
- 34.Harmar AJ, Marston HM, Shen S, et al. The VPAC(2) receptor is essential for circadian function in the mouse suprachiasmatic nuclei. Cell. 2002;109(4):497–508. [DOI] [PubMed] [Google Scholar]
- 35.Nussbaum JC, Van Dyken SJ, von Moltke J, et al. Type 2 innate lymphoid cells control eosinophil homeostasis. Nature. 2013;502(7470):245–248. [DOI] [PMC free article] [PubMed] [Google Scholar]
- 36.Godinho-Silva C, Domingues RG, Rendas M, et al. Light-entrained and brain-tuned circadian circuits regulate ILC3s and gut homeostasis. Nature. 2019;574(7777):254–258. [DOI] [PMC free article] [PubMed] [Google Scholar]
- 37.Eberl G, Littman DR. Thymic origin of intestinal alphabeta T cells revealed by fate mapping of RORgammat+ cells. Science. 2004;305(5681):248–251. [DOI] [PubMed] [Google Scholar]
- 38.Lochner M, Peduto L, Cherrier M, et al. In vivo equilibrium of proinflammatory IL-17+ and regulatory IL-10+ Foxp3+ RORgamma t+ T cells. J Exp Med. 2008;205(6):1381–1393. [DOI] [PMC free article] [PubMed] [Google Scholar]
- 39.Wang H, Yang H, Shivalila CS, et al. One-step generation of mice carrying mutations in multiple genes by CRISPR/Cas-mediated genome engineering. Cell. 2013;153(4):910–918. [DOI] [PMC free article] [PubMed] [Google Scholar]
- 40.Yang H, Wang H, Jaenisch R. Generating genetically modified mice using CRISPR/Cas-mediated genome engineering. Nat Protoc. 2014;9(8):1956–1968. [DOI] [PubMed] [Google Scholar]
- 41.Zhang F, Zarkada G, Han J, et al. Lacteal junction zippering protects against diet-induced obesity. Science. 2018;361(6402):599–603. [DOI] [PMC free article] [PubMed] [Google Scholar]
- 42.Bankhead P, Loughrey MB, Fernandez JA, et al. QuPath: Open source software for digital pathology image analysis. Sci Rep. 2017;7(1):16878. [DOI] [PMC free article] [PubMed] [Google Scholar]
- 43.Caporaso JG, Lauber CL, Walters WA, et al. Ultra-high-throughput microbial community analysis on the Illumina HiSeq and MiSeq platforms. ISME J. 2012;6(8):1621–1624. [DOI] [PMC free article] [PubMed] [Google Scholar]
- 44.Bolyen E, Rideout JR, Dillon MR, et al. Reproducible, interactive, scalable and extensible microbiome data science using QIIME 2. Nat Biotechnol. 2019;37(8):852–857. [DOI] [PMC free article] [PubMed] [Google Scholar]
- 45.Lugering A, Ross M, Sieker M, et al. CCR6 identifies lymphoid tissue inducer cells within cryptopatches. Clin Exp Immunol. 2010;160(3):440–449. [DOI] [PMC free article] [PubMed] [Google Scholar]
- 46.Reynders A, Yessaad N, Vu Manh TP, et al. Identity, regulation and in vivo function of gut NKp46+RORgammat+ and NKp46+RORgammat- lymphoid cells. EMBO J. 2011;30(14):2934–2947. [DOI] [PMC free article] [PubMed] [Google Scholar]
Associated Data
This section collects any data citations, data availability statements, or supplementary materials included in this article.
Supplementary Materials
Data Availability Statement
Source data for quantifications shown in all graphs plotted in the Figures and Extended Data Figures are provided with the paper. The datasets generated in this study are available from the corresponding author, on reasonable request. RNA-seq datasets analysed are publicly available in the Gene Expression Omnibus repository (accession number GSE140502) and 16S-seq datasets analysed are publicly available at BioProject (accession number PRJNA594406).


