Abstract
Objective
To determine prevalence and longitudinal trends in incidence of MS in Møre and Romsdal County, Western Norway, from 1950 to 2018.
Methods
Retrospective longitudinal population-based observational study. All patients diagnosed, or living, with MS in Møre and Romsdal were identified as incident or prevalent cases from local, regional, and national sources. We compiled the data in the Norwegian Multiple Sclerosis Registry and Biobank and used the aggregated data set to calculate incidence and prevalence rates using population measures obtained from Statistics Norway.
Results
On January 1, 2018, the estimated prevalence was 335.8 (95% CI, 314.1–358.5) per 100,000 inhabitants, with a female:male ratio of 2.3. From 1950 through 2017, we observed a considerable (p < 0.001) increase in average annual incidence rates from 2.1 (95% CI, 1.3–3.3) to 14.4 (95% CI, 11.9–17.3) per 100,000. From 2005 through 2017, the incidence among women increased from 17.1 (95% CI, 14.0–20.7) to 23.2 (95% CI, 18.7–28.5) per 100,000, whereas the incidence among men declined from 10.3 (95% CI, 7.9–13.2) to 5.9 (95% CI, 3.4–8.8) per 100,000.
Conclusion
Møre and Romsdal County in Western Norway has the highest prevalence of MS reported in Norway. The incidence has steadily increased since 1950, and during the latest 15 years, we observed opposing trends in sex-specific incidence rates.
Omitting injuries, MS is the most common cause of neurologic disability in young adults.1 The majority of patients experience a relapsing-remitting MS (RRMS) course of the disease following their first clinical attack, as opposed to the primary progressive MS (PPMS) variant, which is characterized by gradual progression from disease onset. Numerous disease-modifying therapies (DMTs) have become available during the last decades, including a recently approved drug for the treatment of PPMS.2 Despite the growing knowledge of immunologic disease mechanisms in MS, and increasing understanding of the interplay between environmental and genetic risk factors, the etiology of the disease remains unknown. Thus, longitudinal investigations, in well-defined populations, applying epidemiologic methods may reveal clues to novel risk factors while simultaneously providing measures needed for estimation of disease burden, resource allocation, and health service planning.3
We aimed to produce a robust estimate of MS prevalence and to examine the time trends of incidence during 7 decades in Møre and Romsdal County, Western Norway.
Methods
Study design
We conducted a retrospective longitudinal population-based observational study, adhering to the 2015 Standards of Reporting of Neurological Disorders statement.4
Setting
Møre and Romsdal County is located in Western Norway at 62° N latitude and 7° E latitude. The total area is 14,467 km2, with islands comprising 11.4% of the area. Neurologic health care services have been provided for at the Department of Neurology at Molde Hospital since 1960 and a neurologic outpatient clinic at Ålesund Hospital since in 1970. Ophthalmologic services and neurophysiologic investigations are, and have been, available at both sites. Agarose gel electrophoresis of CSF has been available since 1972, and isoelectric focusing became available from 2004. Evoked response investigations have been available since 1975 and local access to MRI since 1984. Throughout the study period, we have had access to advanced laboratory services relevant for the differential diagnoses of MS, such as antibody testing for neuromyelitis optica spectrum disorder. Initially, these analyses were performed abroad, but today this service is established at a Norwegian university clinic laboratory. The university clinics also provide second opinion services in difficult and less well-defined cases where the MS diagnosis appears questionable.
The population at risk in 1950 of 191,438 had increased to 266,856 (49.1% women) by January 1, 2018. All together, 11.2% of the population in 2018 constituted immigrants born outside of Norway, primarily natives from Central Europe. According to Statistics Norway, the 3 prevailing immigrant nationalities originated from Poland, Lithuania, and Germany. Non-European immigrants constituted 4.2% of the total population mainly originating from Eritrea, Syria, The Philippines, Thailand, and Somalia. Statistics Norway has provided population figures and data on migration dynamics each year since 1951.5 The National Registry has provided information on place of residence for each patient on prevalence day January 1, 2018. The degree of urbanization in Møre and Romsdal County has steadily increased since 1945. The proportion of inhabitants living in densely populated areas increased from approximately 40% in 1960 to 57% in 1980 and ultimately 72% in 2018.
Between 1950 and 2018, the average net migration rate was −0.65 (range −7.15 to 8.57), meaning that for every 1,000 people in Møre and Romsdal at the beginning of the year, less than 1 person emigrated on average by the end of the year. For the past decade, the net migration rate has been positive, ranging from 0.42 to 8.57.
Source population
Historical data included in the present study comprise data from previously published studies examining the same geographic area from 1950 to 1991.6–8 In addition, we included data from 2 unpublished master's theses at the Faculty of Medicine, Norwegian University of Science and Technology, Trondheim, presented in 2009 and 2011. The main and primary source of information on patients with MS diagnosed in the subsequent years was the medical records and administrative database at all 4 county hospitals, including the 2 neurology outpatient clinics in the county. We obtained the individual case records of patients with MS by searching the databases using the codes for MS in the ninth (340) and 10th (G35) revisions of the International Statistical Classification of Diseases and Related Health Problems. As a supplement, and on an individual basis, hospitals and outpatient clinics in other counties, and the patients themselves, supplied missing information otherwise unattainable. We compiled the merged data in the Norwegian Multiple Sclerosis Registry and Biobank and performed the statistical analyses based on the aggregated data.9 The Norwegian health care system covers all residents through a compulsory membership in the National Insurance Scheme. This ensures universal and equal access to essential care and specialized medical services, including the choice of a primary care physician (PCP), i.e., a general practitioner (GP). Patients who experience symptoms with acute, subacute, or prolonged onset usually seek help from their PCP, which serves as a gatekeeper for further specialist referral, including neurologic services. The neurology outpatient clinics in the county are both located at the public hospitals in the cities of Molde and Ålesund. When MS is suspected, the typical patient trajectory starts at the PCP who refers the patient to a neurologist employed in the specialized public health care system where the diagnosis is made, treatment initiated, and outpatient follow-up established. Throughout the study period, there have been no private neurologic practices in the geographic area of interest.
Participants
All patients ascertained in this study had their diagnosis of MS made by a clinical neurologist in Molde or Ålesund between 1950 and 2018. During this time, 5 different diagnostic criteria, and their respective revisions, have been published.10–17
Patients who did not meet the diagnostic criteria, including those with clinically isolated syndrome (CIS), and patients where there was insufficient information to confirm the diagnosis, were not included. In cases where the diagnosis was not obvious, the first (J.S.W.) and last author (R.M.) reached a consensus whether a patient was eligible for inclusion. We applied a restrictive strategy in equivocal cases to avoid artifactual inflation.
In the principal study from 1966, the criteria of Allison and Millar were applied, whereas the criteria of McAlpine were used in the study from 1991.6,7 Based solely on clinical data, patients were diagnosed as having definite, probable, or possible MS. The 1996 study identified 419 (89 possible) patients with onset of MS between 1950 and 1991.8 At the same time, cases labeled as probable and possible in the 2 previously mentioned studies were reassessed and reclassified in accordance with the McAlpine criteria. In the present study, we reappraised the original case report forms (CRFs) from this work and compared the historical data with any follow-up information and history of disease development available in the patient's electronic medical record. We contacted local and national patient archives for those cases where electronic records did not exist. All records were screened consistently for clinical and paraclinical data, including any evidence of DMT use, results from CSF analyses, and MRI studies. The patients retrieved from the 2 unpublished dissertations were diagnosed between 1988 and October 2010, through retrospective application of the 2005 revision of the McDonald criteria. This resulted in the identification of 699 and 981 patients, respectively. The remaining patients diagnosed in the following years were ascertained using the current revision of the McDonald criteria at that time. In addition to the cases deemed definite and probable according to the older clinical criteria, possible cases were also included in the analyses. The McDonald criteria do not recognize cases of probable MS. However, the criteria permit usage of possible labeling in unsettled cases where patients typically meet some but not all of the required criteria. Renewed clinical evaluation and repeated MRI constitute the typical diagnostic follow-up, which is offered routinely to these patients at our clinic.
For each patient, we recorded a minimum set of data, including mandatory demographics and certain details of the individual diagnostic evaluation. We defined disease onset as the year when a patient first experienced a symptom suggestive of MS. Correspondingly, we defined the time of diagnosis as the year, when a clinical neurologist made the diagnosis of MS.
We categorized patients as having either relapsing-onset MS (RRMS) or progressive-onset MS (PPMS) based on their medical history and findings on the clinical neurologic examination at the time of diagnosis. We did not record data on familial cases or determine the proportion of patients developing secondary progressive MS following an initial RRMS course.
Every entry to the Norwegian Multiple Sclerosis Registry is based on the unique 11-digit national identification number issued to each citizen at birth or when moving to Norway. The first 6 digits of this number equal a person's date of birth (DD/MM/YY). Thus, we avoid duplicate entries when using multiple data sources and any missing data when calculating a patient's age at disease onset and diagnosis.
Measurement
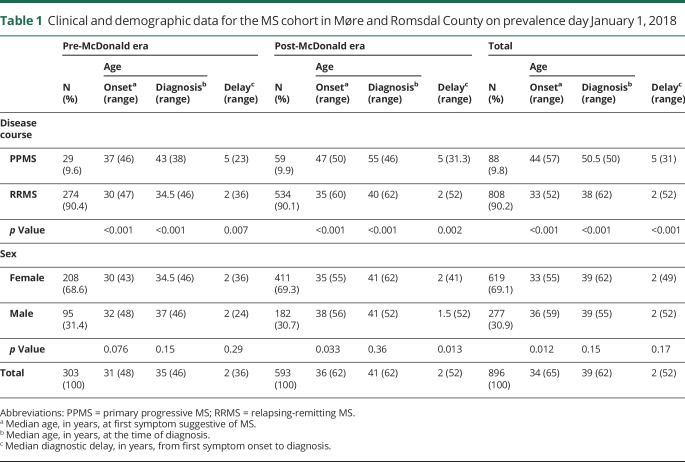
Patients living in Møre and Romsdal County on prevalence day January 1, 2018 were defined as prevalent cases. Deceased patients and nonresidents were excluded from the prevalence cohort. We also excluded patients who did not meet the diagnostic criteria or had other medical conditions that better could explain their symptoms. The clinical and demographic data for the 896 prevalent cases are presented in table 1. The crude prevalence rate was calculated as the total number of patients per 100,000 inhabitants using ascertained cases from 1950 to 2018 as the numerator and the 2018 census on January 1, 266,856, as the denominator.
Table 1.
Clinical and demographic data for the MS cohort in Møre and Romsdal County on prevalence day January 1, 2018
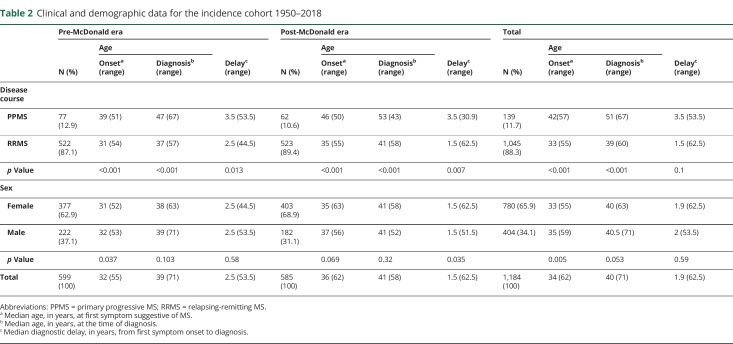
Cases were considered incident if the diagnosis of MS was made by a clinical neurologist in either Molde or Ålesund between 1950 and 2018. Average annual incidence rates were estimated retrospectively for quinquennial intervals, using the average population in each 5-year period as the denominator. The time delay between onset and diagnosis was also calculated (in years) for the same time intervals. The clinical and demographic data for the 1,184 patients constituting the incidence cohort are presented in table 2.
Table 2.
Clinical and demographic data for the incidence cohort 1950–2018
Statistical methods
We calculated the age-adjusted prevalence and incidence rates, using data from both the European standard population of 2013 and the World Health Organization (WHO) world standard population.18,19 The Mann-Whitney test was used for comparing differences in age at onset, age at diagnosis, and diagnostic delay between women, men, RRMS, and PPMS. For all the calculations regarding prevalence and incidence, we assumed an underlying Poisson distribution of the disease. A test for trend in ordered Poisson rates was used to assess the observed change in incidence over time.
Single-year population data, in age groups, have only been available since 1970. However, county censuses undertaken in 1950 and 1960 contained this information. We used linear interpolation based on these 2 censuses to supply the missing population data from 1950 to 1960 and from 1960 to 1970.
Standard protocol approvals, registrations, and patient consents
This study was approved by the Central Regional Committee for Medical and Health Research Ethics, #2015/2024/REK midt.
Data availability
The Norwegian Multiple Sclerosis Registry and Biobank holds ownership of the patient data used in this study. However, any anonymized data can be made available for research purposes on reasonable request to the corresponding author.
Results
Main findings
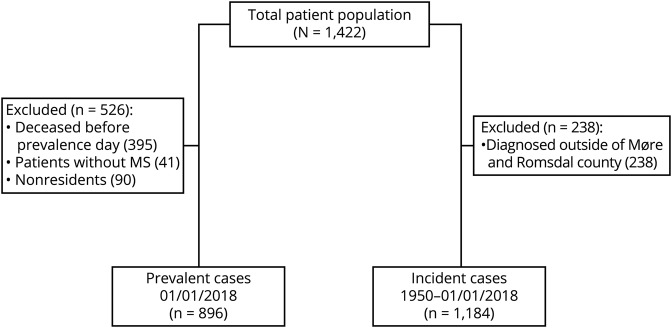
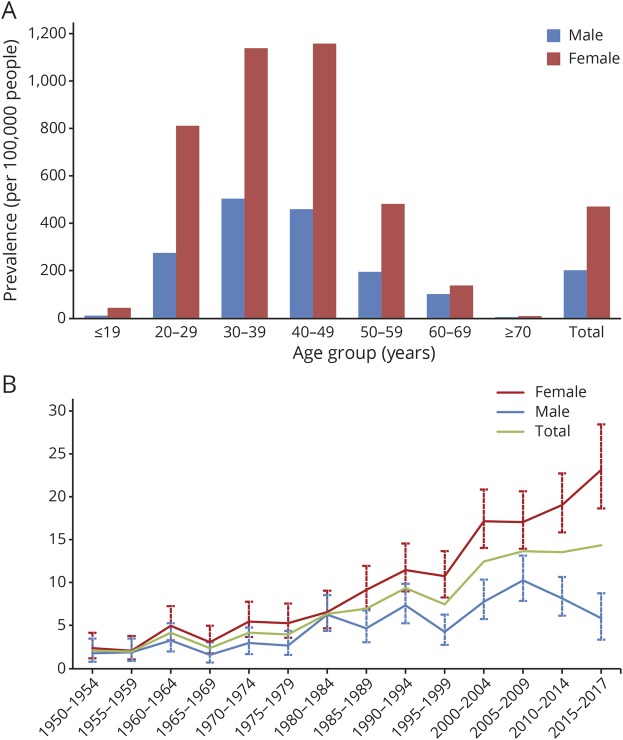
Altogether, we identified 1,422 patients (figure 1), of whom 896 were recognized as prevalent on January 1, 2018, resulting in a crude prevalence of 335.8 (95% CI, 314.1–358.5) per 100,000. Adjusted prevalence was equal to 350.4 per 100,000 for the European standard population and 356.6 per 100,000 for the WHO standard population. For women, we found a prevalence rate of 472.8 (95% CI, 436.4–511.6) per 100,000 and for men 203.8 (95% CI, 180.5–229.2) per 100,000 resulting in a female:male ratio of 2.3. For the age-specific prevalence, rates peaked among women aged 40–49 years and men aged 30–39 years (figure 2A).
Figure 1. Flow diagram illustrating inclusion and exclusion to the prevalence and incidence cohorts.
Figure 2. Age-specific prevalence and incidence of MS in Møre and Romsdal County.
Age-specific prevalence on January 1, 2018 (A), and trends in crude and sex-specific average annual incidence during 1950–2018 in 5-year periods (B).
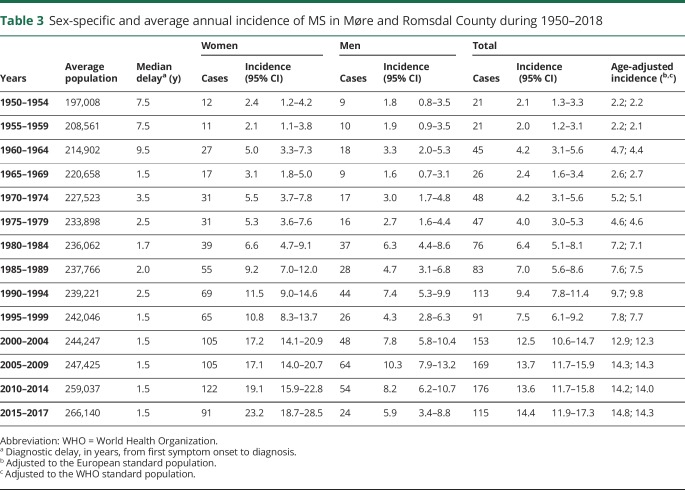
There was almost a sevenfold (p < 0.001) increase in the crude incidence rate from 2.1 (95% CI, 1.3–3.2) per 100,000 during 1950–1954 to 14.4 (95% CI, 11.9–17.3) during 2015–2017 (table 3). For these 2 time periods, the female:male incidence ratio changed from 1.33 to 3.93.
Table 3.
Sex-specific and average annual incidence of MS in Møre and Romsdal County during 1950–2018
Discussion
We have shown a steady increase in the incidence and prevalence of MS in Møre and Romsdal County during almost 7 decades. We report one of the highest prevalence rates, 335.8 per 100,000, recorded to date in Europe.20–22 From 1961 to 2018, there has been more than a 13-fold increase in the prevalence of MS in Møre and Romsdal County.
During the first 3 decades of the study period, the crude incidence of MS remained rather stable, and it did not exceed 10 new cases per 100,000 before the millennial shift. A steady increase could be seen from 2000 and toward the end of the study period. The increment in MS incidence in Møre and Romsdal from 2005 and onward is mainly caused by the increase in incidence among women. The corresponding rates for men have declined during the same period (figure 2B).
Our study is limited by the retrospective design and the application of various diagnostic criteria throughout the study period, which makes direct comparison of incidence rates throughout the study less feasible. There have been repeated surveys on MS in Møre and Romsdal County, and this would presumably raise the attention among GPs and in the general population as well. This could lead to a higher ascertainment probability. With the introduction of DMTs in the county during 1996, MS became a treatable disease. This fact probably contributed to patients, having milder symptom burdens and less disabling disease courses, being brought to attention earlier than previously due to raised expectations for swifter diagnostic resolution among GPs and the public. The fact that diagnostic delay has remained consistent and short from 1995 toward the end of 2017 would also allude to this (table 3).
Cases were recognized as incident at the time of diagnosis, and not at disease onset, as reliable information regarding place of residence at disease onset was unavailable. Thus, it remains plausible that a patient diagnosed in Møre and Romsdal and consequently recognized as incident might have had disease onset outside the county. Conversely, we are unable to account for patients with disease onset in Møre and Romsdal where the diagnosis was made elsewhere. However, and due to the minimal migration flux, this would probably only pertain to a negligible amount of cases. Patients' recollections concerning time of disease onset are subject to recall bias. This could affect our estimation of diagnostic delay, as this variable equals the time gap between the time point a patient remembering having their first symptoms suggestive of MS, and the diagnosis being made.
Unlike many other studies, cases labeled as possible according to the older diagnostic criteria based on clinical data only were included in our analyses. This would affect ascertainment probability and could lead to overestimation if patients initially labeled as possible ultimately did not develop MS. However, all the original CRFs detailing cases originally ascertained by outdated diagnostic criteria have been reviewed and linked with each patient's medical history and results from relevant ancillary investigations. Furthermore, and due to our study's longitudinal design and the stability of the population during the study period, we assume that possible cases with protracted disease courses, for instance, a patient with CIS without any evidence of a second clinical attack for many years, are largely, if not completely accounted for. Previously published work from Møre and Romsdal County showed a notable (p < 0.0001) increase in incidence rates from 1950 to 1991.9 The significance of this increase did, however, not diminish whether possible cases were included. Furthermore, the same authors showed that inclusion of possible cases in the prevalence analyses resulted in an increase of 33.2% and 32.5% for the 1965 and 1985 data, respectively. Thus, the effect size of including cases of equivocal certainty appears to be comparable and consistent over time.
A previously published nationwide study of MS prevalence in Norway pooled data from several registries, including the Norwegian Multiple Sclerosis Registry, and showed that the central health region, which includes Møre and Romsdal County, to have the highest crude prevalence, 249 (95% CI, 238–261) per 100,000.23 This was also confirmed by a report including data from the Norwegian Patient Registry.24 We suspect that the discrepancy in prevalence rates, when comparing our results with these registry-based studies, is caused by methodological differences. First, the method of case ascertainment, not being based on critical reappraisal of clinical and paraclinical individual patient data, is notably different. Second, before the present study and at the time when these studies were conducted, the coverage of the Norwegian Multiple Sclerosis Registry, one of their main data sources, was incomplete. Third, acknowledging that the pooled results are presented regionally, any local differences in prevalence across counties will not be depicted. Our last claim is supported by a previous report from another county (Nord-Trøndelag) located within the same region as Møre and Romsdal where the authors, using a similar study design, but different diagnostic criteria, demonstrated a considerably lower crude prevalence rate of 163.6 (95% CI, 142.2–187.5) per 100,000 in 2000.25
Other Norwegian single-county studies (Buskerud, Hordaland, and Nordland) conducted more recently, have also demonstrated lower prevalence rates compared with our results.26–28 The median diagnostic delay reported in Nord-Trøndelag and Hordaland is comparable to our results, whereas the diagnostic delay in Buskerud and Nordland appears to be somewhat longer.
Comparable prevalence rates as those demonstrated in the present study were recently shown among adults in the Midwestern and Northeastern parts of the United States in a study exploiting administrative health claims data. Depending on the applied methods of adjustment, nationwide prevalence rates of 265.1 and 309.2 per 100,000 could be demonstrated during 2010.29 Another recent study reports an island-wide prevalence of 330 (95% CI, 321–338) per 100,000 on March 31, 2016, in Sardinia, Italy, with regional prevalence rates more than twice as high as those previously reported from mainland Italy.22 However, the authors of this study emphasize the role of genetic factors contributing to a higher burden of immune-mediated diseases among Sardinians, corroborating previous studies.30
The Hordaland study from 2016 demonstrated stable incidence rates over the past 30 years, whereas our data show an increase in crude incidence within the same timeframe.27 In our study, the largest increase in average annual incidence rates between 2 consecutive time periods is seen between 1995–1999 and 2000–2004, from 7.5 to 12.5. We assume that the introduction of the original McDonald criteria of 2001 is the principal factor responsible for this rise. This observation further emphasizes an important point when conducting epidemiologic studies where the diagnostic criteria are changing throughout the study period. That is, the increased diagnostic accuracy of newer criteria. For MS, these criteria have become gradually more dependent on sensitive CSF analyses and advanced MRI, which undoubtedly has contributed to increased diagnostic precision, and probably earlier detection of definite cases. However, the longitudinal design of our study and the scrutinization of individual patient records provided us with extensive follow-up information, particularly valuable for indolent cases and in participants originally ascertained by application of the older diagnostic criteria.
Most recently, and for the past 15 years, the increase in crude incidence is a direct result of an increase in incidence among women. As pointed out by other authors, sex ratio typically exhibits a propensity to increase over time when the same geographic area is investigated repeatedly.31 They provide 3 examples of counties, which serve as an exception to this rule; Møre and Romsdal and Nord-Trøndelag in Norway and Olmsted in Minnesota, United States. However, in the present updated study, an asymmetric distribution between sexes is clearly evident, both for the prevalence numbers and the most recent incidence data. Given stability in the population gene pool, the same authors argue that short-term changes in the incidence of MS are suggestive of etiologic environmental risk factors. The marked increase in incident female:male sex ratio in the 3 latest time periods of our study, from 1.66 during 2005–2009 to 3.93 during 2015–2017, lends support to this notion as we have no reason to assume inequality in the accessibility of health care services in this period. The overall difference in diagnostic delay between men and women was minor for both the prevalence (p = 0.17) and incidence (p = 0.59) cohort. Without complementary data, we are only able to speculate on any contributing environmental risk factors, such as smoking habits, hypovitaminosis D, or obesity, that might be relevant for these observations.
In this study, we show a high point prevalence and increasing incidence of MS in Møre and Romsdal County in Western Norway through almost 7 decades. Improved diagnostic tools, temporal changes in diagnostic criteria, increased public awareness, access to DMTs, and increased survival among patients due to improved symptomatic treatment and prevention of complications are likely contributing factors that in part could explain the observed incline in MS incidence and prevalence, but changes in environmental risk factors during almost 70 years might also play a role. Further studies should seek to elucidate the underlying mechanisms responsible for the observed changes.
Acknowledgment
The authors thank Kjetil Bjørnevik, MD, PhD, and Marianna Cortese, MD, PhD (Harvard T.H. Chan School of Public Health, Boston, MA, USA, and University of Bergen, Bergen, Norway), and Lars Martin Skår (The Norwegian Multiple Sclerosis Registry and Biobank, Department of Neurology, Haukeland University Hospital and University of Bergen, Bergen, Norway) for their assistance in collecting data.
Glossary
- CIS
clinically isolated syndrome
- CRF
case report form
- DMT
disease-modifying therapy
- GP
general practitioner
- PCP
primary care physician
- PPMS
primary progressive MS
- RRMS
relapsing-remitting MS
- WHO
World Health Organization
Appendix. Authors

Study funding
The study was funded by grants from Møre og Romsdal Hospital Trust and an unrestricted grant from Novartis Norge AS.
Disclosure
J.S. Willumsen has received an unrestricted research grant from Novartis. He is funded by Møre og Romsdal Hospital Trust. J.H. Aarseth reports no disclosures. K.-M. Myhr has served on advisory board and received speakers' honoraria, travel funding, and/or unrestricted research grants from Novartis, Biogen, Genzyme, Merck, Almirall, Roche, Teva, and/or the Norwegian MS Society. He is funded by Norwegian Research Council grant 288164. R. Midgard has served on scientific advisory boards for Novartis Norway and Merck and has received travel funding and/or speaker honoraria from Biogen, Novartis, and Sanofi Genzyme. Industry sponsorship: this study is sponsored with an unrestricted grant from Novartis Norge AS. Go to Neurology.org/NN for full disclosures.
References
- 1.Pugliatti M, Rosati G, Carton H, et al. . The epidemiology of multiple sclerosis in Europe. Eur J Neurol 2006;13:700–722. [DOI] [PubMed] [Google Scholar]
- 2.Montalban X, Hauser SL, Kappos L, et al. . Ocrelizumab versus placebo in primary progressive multiple sclerosis. N Engl J Med 2017;376:209–220. [DOI] [PubMed] [Google Scholar]
- 3.Nelson LM, Wallin MT, Marrie RA, et al. . A new way to estimate neurologic disease prevalence in the United States: illustrated with MS. Neurology 2019;92:469–480. [DOI] [PMC free article] [PubMed] [Google Scholar]
- 4.Bennett DA, Brayne C, Feigin VL, et al. . Development of the Standards of Reporting of Neurological Disorders (STROND) checklist: a guideline for the reporting of incidence and prevalence studies in neuroepidemiology. Neurology 2015;85:821–828. [DOI] [PubMed] [Google Scholar]
- 5.StatBank Norway [online]. Available at: ssb.no/en/statbank. Accessed May 30, 2019.
- 6.Presthus J. Multiple sclerosis in More og Romsdal County, Norway. Acta Neurol Scand 1966;42:12–18. [DOI] [PubMed] [Google Scholar]
- 7.Midgard R, Riise T, Nyland H. Epidemiologic trends in multiple sclerosis in More and Romsdal, Norway: a prevalence/incidence study in a stable population. Neurology 1991;41:887–892. [DOI] [PubMed] [Google Scholar]
- 8.Midgard R, Riise T, Svanes C, Kvale G, Nyland H. Incidence of multiple sclerosis in More and Romsdal, Norway from 1950 to 1991. An age-period-cohort analysis. Brain 1996;119:203–211. [DOI] [PubMed] [Google Scholar]
- 9.Myhr KM, Grytten N, Torkildsen O, Wergeland S, Bo L, Aarseth JH. The Norwegian Multiple Sclerosis Registry and Biobank. Acta Neurol Scand 2015;132:24–28. [DOI] [PubMed] [Google Scholar]
- 10.Allison RS, Millar JH. Prevalence of disseminated sclerosis in Northern Ireland. Ulster Med J 1954;23:1–27. [PMC free article] [PubMed] [Google Scholar]
- 11.McAlpine D. The benign form of multiple sclerosis. A study based on 241 cases seen within three years of onset and followed up until the tenth year or more of the disease. Brain 1961;84:186–203. [DOI] [PubMed] [Google Scholar]
- 12.Schumacher GA, Beebe G, Kibler RF, et al. . Problems of experimental trials of therapy in multiple sclerosis: Report by the panel on the evaluation of experimental trials of therapy in multiple sclerosis. Ann N Y Acad Sci 1965;122:552–568. [DOI] [PubMed] [Google Scholar]
- 13.Poser CM, Paty DW, Scheinberg L, et al. . New diagnostic criteria for multiple sclerosis: guidelines for research protocols. Ann Neurol 1983;13:227–231. [DOI] [PubMed] [Google Scholar]
- 14.McDonald WI, Compston A, Edan G, et al. . Recommended diagnostic criteria for multiple sclerosis: guidelines from the International Panel on the diagnosis of multiple sclerosis. Ann Neurol 2001;50:121–127. [DOI] [PubMed] [Google Scholar]
- 15.Polman CH, Reingold SC, Edan G, et al. . Diagnostic criteria for multiple sclerosis: 2005 revisions to the “McDonald Criteria”. Ann Neurol 2005;58:840–846. [DOI] [PubMed] [Google Scholar]
- 16.Polman CH, Reingold SC, Banwell B, et al. . Diagnostic criteria for multiple sclerosis: 2010 revisions to the McDonald criteria. Ann Neurol 2011;69:292–302. [DOI] [PMC free article] [PubMed] [Google Scholar]
- 17.Thompson AJ, Banwell BL, Barkhof F, et al. . Diagnosis of multiple sclerosis: 2017 revisions of the McDonald criteria. Lancet Neurol 2018;17:162–173. [DOI] [PubMed] [Google Scholar]
- 18.Eurostat. Revision of the European Standard Population [online]. Available at: ec.europa.eu/eurostat/documents/3859598/5926869/KS-RA-13-028-EN.PDF/e713fa79-1add-44e8-b23d-5e8fa09b3f8f. Accessed May 30, 2019. [Google Scholar]
- 19.WHO. World Standard Population [online]. Available at: apps.who.int/healthinfo/statistics/mortality/whodpms/definitions/pop.htm. Accessed May 30, 2019. [Google Scholar]
- 20.Kingwell E, Marriott JJ, Jette N, et al. . Incidence and prevalence of multiple sclerosis in Europe: a systematic review. BMC Neurol 2013;13:128. [DOI] [PMC free article] [PubMed] [Google Scholar]
- 21.Visser EM, Wilde K, Wilson JF, Yong KK, Counsell CE. A new prevalence study of multiple sclerosis in Orkney, Shetland and Aberdeen city. J Neurol Neurosurg Psychiatry 2012;83:719–724. [DOI] [PubMed] [Google Scholar]
- 22.Urru SA, Antonelli A, Sechi GM; MS Working Group. Prevalence of multiple sclerosis in Sardinia: a systematic cross-sectional multi-source survey. Mult Scler 2020;26:372–380. [DOI] [PubMed] [Google Scholar]
- 23.Berg-Hansen P, Moen SM, Harbo HF, Celius EG. High prevalence and no latitude gradient of multiple sclerosis in Norway. Mult Scler 2014;20:1780–1782. [DOI] [PubMed] [Google Scholar]
- 24.Grytten N, Torkildsen O, Myhr KM. Time trends in the incidence and prevalence of multiple sclerosis in Norway during eight decades. Acta Neurol Scand 2015;132:29–36. [DOI] [PMC free article] [PubMed] [Google Scholar]
- 25.Dahl OP, Aarseth JH, Myhr KM, Nyland H, Midgard R. Multiple sclerosis in Nord-Trondelag County, Norway: a prevalence and incidence study. Acta Neurol Scand 2004;109:378–384. [DOI] [PubMed] [Google Scholar]
- 26.Simonsen CS, Edland A, Berg-Hansen P, Celius EG. High prevalence and increasing incidence of multiple sclerosis in the Norwegian county of Buskerud. Acta Neurol Scand 2017;135:412–418. [DOI] [PubMed] [Google Scholar]
- 27.Grytten N, Aarseth JH, Lunde HM, Myhr KM. A 60-year follow-up of the incidence and prevalence of multiple sclerosis in Hordaland County, Western Norway. J Neurol Neurosurg Psychiatry 2016;87:100–105. [DOI] [PMC free article] [PubMed] [Google Scholar]
- 28.Benjaminsen E, Olavsen J, Karlberg M, Alstadhaug KB. Multiple sclerosis in the far north--incidence and prevalence in Nordland County, Norway, 1970–2010. BMC Neurol 2014;14:226. [DOI] [PMC free article] [PubMed] [Google Scholar]
- 29.Wallin MT, Culpepper WJ, Campbell JD, et al. . The prevalence of MS in the United States: a population-based estimate using health claims data. Neurology 2019;92:e1029–e1040. [DOI] [PMC free article] [PubMed] [Google Scholar]
- 30.Rosati G, Aiello I, Pirastru MI, et al. . Epidemiology of multiple sclerosis in Northwestern Sardinia: further evidence for higher frequency in Sardinians compared to other Italians. Neuroepidemiology 1996;15:10–19. [DOI] [PubMed] [Google Scholar]
- 31.Koch-Henriksen N, Sorensen PS. The changing demographic pattern of multiple sclerosis epidemiology. Lancet Neurol 2010;9:520–532. [DOI] [PubMed] [Google Scholar]
Associated Data
This section collects any data citations, data availability statements, or supplementary materials included in this article.
Data Availability Statement
The Norwegian Multiple Sclerosis Registry and Biobank holds ownership of the patient data used in this study. However, any anonymized data can be made available for research purposes on reasonable request to the corresponding author.


