Abstract
Objective
To test the hypothesis that the pattern of serum biomarkers of disease activity and disability in myelin oligodendrocyte glycoprotein antibody–associated disease (MOGAD) will be different from those in neuromyelitis optica spectrum disorder (NMOSD) with anti–aquaporin-4 antibodies (AQP4-Abs).
Methods
Using ultrasensitive single-molecule array assays, we measured neurofilament light chain (NfL), glial fibrillary acidic protein (GFAP), and tau in the sera of consecutive patients with MOGAD (n = 16) and NMOSD with AQP4-Ab (n = 33). Serum biomarker levels were compared between patients in relapse and remission states, and correlations between the levels of these biomarkers and Expanded Disability Status Scale (EDSS) scores were analyzed within each group.
Results
In the MOGAD group, the serum tau level was higher in a relapse state than in a remission state (relapse vs remission: 0.5 [0.4–0.5] vs 0.2 [0.1–0.3] pg/mL, p = 0.027). Both serum levels of NfL and tau correlated with the EDSS score (NfL: r = 0.684, p = 0.003; tau: r = 0.524, p = 0.045). Meanwhile, in the NMOSD group, serum NfL and GFAP levels were higher in a relapse state than in a remission state (relapse vs remission: NfL, 34.8 [12.2–62.3] vs 13.0 [11.3–20.0] pg/mL, p = 0.010; GFAP, 253.8 [150.6–303.0] vs 104.4 [93.9–127.9] pg/mL, p = 0.016). Only the serum GFAP level correlated with the EDSS score (r = 0.485, p = 0.012).
Conclusion
The pattern of serum biomarkers of disease activity and disability in MOGAD showed a distinct feature from those in NMOSD with AQP4-Ab, which implicates different pathogeneses between the 2 diseases.
Myelin oligodendrocyte glycoprotein (MOG) is expressed at the surfaces of myelin sheaths and oligodendrocytes.1 Anti-MOG antibodies (MOG-Abs) were initially reported in a subgroup of seronegative neuromyelitis optica spectrum disorder (NMOSD).2 However, neuropathologic findings of MOG-Abs cases showed confluent demyelination with oligodendrocytopathy, distinct from those of NMOSD with anti–aquaporin-4 antibodies (AQP4-Abs), known as astrocytopathy.1,3 MOG-Ab–associated disease (MOGAD) was recently proposed as a distinct CNS demyelinating disease rather than a subgroup of seronegative NMOSD.4
Serum biomarkers for MOGAD have rarely been investigated. Because of distinct pathogenesis of the 2 diseases, we hypothesized that the pattern of serum biomarkers of disease activity and disability in MOGAD would be different from those in NMOSD with AQP4-Abs. To test this hypothesis, we investigated serum levels of neurofilament light chain (NfL), glial fibrillary acidic protein (GFAP), and tau in patients with MOGAD and NMOSD.
Methods
We prospectively recruited consecutive patients with MOGAD, CNS demyelinating syndromes associated with MOG-Abs,2,3 and those with NMOSD with AQP4-Abs, according to international consensus criteria (2015). Patients visited Asan Medical Center (Seoul, South Korea) between July 2018 and February 2019; AQP4-Abs and MOG-Abs were confirmed twice (>1:40 titer) by a commercial fixed cell-based assay (Euroimmun, Lübeck, Germany). Patients were simultaneously enrolled and sampled when they visited the hospital during the study period, regardless of the presence of clinical events. The Expanded Disability Status Scale (EDSS) score was evaluated at the enrollment. We only included patients who experienced clinical relapses in the 2 preceding years, so we could balance the patients' clinical statuses between the 2 diseases. We defined the relapse state as the presence of clinical relapse 2 months before enrollment/sampling. Serum biomarker levels were compared between patients with and without relapse to examine whether the biomarkers reflected recent disease activity.
Serum concentrations of NfL, GFAP, and tau (total tau) were measured in duplicate using a Simoa HD-1 Analyzer (Quanterix, Billerica, MA) by an investigator blinded to the clinical information.
Analysis of covariance was conducted for serum biomarker comparisons after age and EDSS score adjustments. Receiver operating characteristic (ROC) curve analysis to determine the cutoff value for differentiating relapse state in each disease was performed. Pearson correlation coefficients were calculated to describe correlations between the log-transformed serum biomarker levels and clinical variables (age and EDSS score) within each disease. Variables with 2-tailed p < 0.05 were considered significant. All statistical analyses were performed with SPSS version 21.0 software. This study was approved by the institutional review board, and written informed consent was obtained from all participants.
Data availability
Anonymized data will be available on requests.
Results
Baseline characteristics
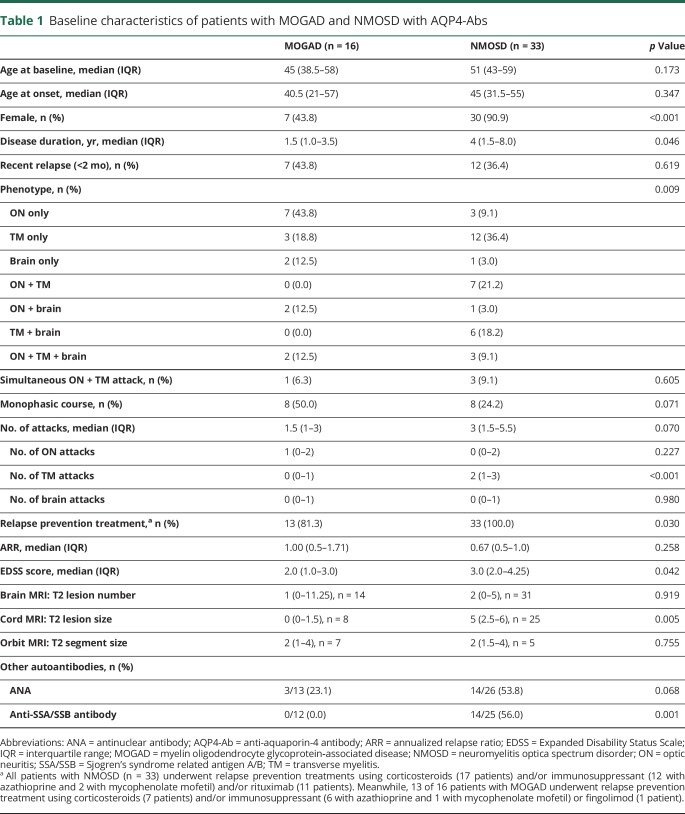
Among 418 patients who underwent MOG and APQ4-Ab testing, 19 showed positive results for MOG-Abs, and 63 were positive for AQP4-Abs. We excluded 3 and 30 patients in each respective group who had experienced relapses more than 2 years previously. Finally, 16 patients in the MOGAD group and 33 in the NMOSD group were included (figure e-1, links.lww.com/NXI/A228). The number of days from the last relapse to blood sampling was comparable between the 2 groups (median [interquartile range], MOGAD: 90 [11.75–189.25] vs NMOSD: 128 [37.5–402] days, p = 0.117). Baseline characteristics are presented in table 1.
Table 1.
Baseline characteristics of patients with MOGAD and NMOSD with AQP4-Abs
Serum biomarker levels
Serum NfL and tau levels were comparable in patients with MOGAD and NMOSD (MOGAD vs NMOSD: NfL, 10.7 [7.7–17.5] vs 15.2 [12.1–24.8] pg/mL, p = 0.363; tau, 0.4 [0.2–0.5] vs 0.5 [0.4–0.8] pg/mL, p = 0.066; figure 1, A and E), whereas the serum GFAP level was significantly lower in patients with MOGAD (MOGAD vs NMOSD: 90.2 [59.9–116.1] vs 123.1 [95.3–234.1] pg/mL, p = 0.020; figure 1C). In subgroup analysis, according to their clinical status, the trend of higher GFAP levels in the NMOSD group than in the MOGAD group was also observed in both relapse and remission state (table e-1, links.lww.com/NXI/A229).
Figure 1. Comparison of serum biomarkers in patients with MOGAD and NMOSD with AQP4-Ab.
(A and B) Serum NfL levels, (C and D) serum GFAP levels, and (E and F) serum tau levels were compared between patients with MOGAD and NMOSD with AQP4-Abs. In panels A, C, and E, all samples from each group were included. In panels B, D, and F, each group was subdivided into relapse and remission states. The line in the center represents the median. The whiskers indicate the interquartile range. The p values were obtained via analysis of covariance, adjusted for age and Expanded Disability Status Scale score. *p < 0.05. AQP4-Abs = anti-aquaporin-4 antibodies; GFAP = glial fibrillary acidic protein; MOGAD = myelin oligodendrocyte glycoprotein antibody–associated disease; NfL = neurofilament light chain; NMOSD = neuromyelitis optica spectrum disorder.
Disease activity
In patients with MOGAD, the serum tau level was higher in relapse than in remission (relapse vs remission: 0.5 [0.4–0.5] vs 0.2 [0.1–0.3] pg/mL, p = 0.027; figure 1F), but the serum NfL and GFAP levels were comparable (NfL, 10.2 [7.4–22.9] vs 10.9 [7.7–16.3] pg/mL, p = 0.836; GFAP, 102.5 [87.1–142.0] vs 68.4 [58.9–115.0] pg/mL, p = 0.260; figure 1, B and D). In patients with NMOSD, the serum NfL and GFAP levels were higher in a relapse than remission state (NfL, 34.8 [12.2–62.3] vs 13.0 [11.3–20.0] pg/mL, p = 0.010; GFAP, 253.8 [150.6–303.0] vs 104.4 [93.9–127.9] pg/mL, p = 0.016; figure 1, B and D), but serum tau levels were comparable (0.5 [0.1–1.0] vs 0.5 [0.4–0.8] pg/mL, p = 0.563; figure 1F).
The ROC analysis revealed an area under the curve of 0.813 for serum GFAP in patients with NMOSD and 0.875 for serum tau in patients with MOGAD. Serum GFAP levels ≥128.55 pg/mL suggested a relapse state in the NMOSD group (sensitivity: 75.0%, specificity: 77.8%), whereas serum tau levels ≥0.37 pg/mL suggested a relapse state in the MOGAD group (sensitivity: 85.7%, specificity: 87.5%).
Disease disability
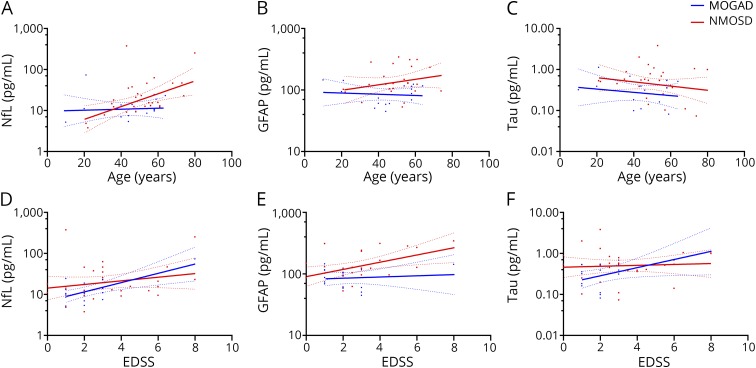
We evaluated correlations between serum biomarkers and clinical variables (age and EDSS score). In the MOGAD group, no biomarkers showed significant correlations with age (NfL: r = 0.068, p = 0.802; GFAP: r = −0.097, p = 0.720; tau: r = −0.194, p = 0.489; figure 2, A–C). Serum NfL and tau levels correlated with the EDSS score (NfL: r = 0.684, p = 0.003; tau: r = 0.524, p = 0.045; figure 2, D and F), but the serum GFAP level did not (r = 0.107, p = 0.693; figure 2E).
Figure 2. Correlation of serum biomarkers with age and EDSS score.
Correlation between age and serum levels of (A) NfL, (B) GFAP, and (C) tau in patients with MOGAD or NMOSD with anti–aquaporin-4 antibodies (AQP4-Abs). Correlation of the serum level with (D) NfL, (E) GFAP, and (F) tau with the EDSS score in patients with MOGAD or NMOSD with AQP4-Abs. The dotted lines indicate 95% CIs. EDSS = Expanded Disability Status Scale; GFAP = glial fibrillary acidic protein; MOGAD = myelin oligodendrocyte glycoprotein antibody–associated disease; NfL = neurofilament light chain; NMOSD = neuromyelitis optica spectrum disorder.
In the NMOSD group, only serum NfL levels correlated with age (NfL: r = 0.504, p = 0.004; GFAP: r = 0.251, p = 0.217; tau: r = −0.192, p = 0.300; figure 2, A–C). The serum GFAP levels significantly increased with the EDSS score (r = 0.485, p = 0.012; figure 2E), but the serum NfL and tau levels did not correlate with the EDSS score (NfL: r = 0.220, p = 0.234; tau: r = 0.068, p = 0.716; figure 2, D and F). The adjustment for sex and treatment status did not affect the statistical significance of these correlations (tables e-2 and e-3, links.lww.com/NXI/A229).
Discussion
In the MOGAD group, the serum tau level was higher in relapse than in remission; the serum NfL and tau levels correlated with the EDSS score. In the NMOSD group, the serum NfL and GFAP levels were higher in relapse than in remission; the serum GFAP level correlated with the EDSS score.
Tau is an abundant microtubule-associated protein in neurons.5 In addition to NfL, tau has been proposed as another axonal damage biomarker. However, the results of tau as a biomarker for MS are disputable.6,7 In this study, we showed serum tau acted as a MOGAD biomarker. Because tau is also located in oligodendrocytes, playing crucial roles in oligodendrocyte process extension and myelination,5 we assumed that MOG-Abs targeted the MOG at the oligodendrocyte process and released tau from the process itself. The neuropathologic findings of MOGAD, which showed relative preservation of axons and astrocytes, supported the finding of stable NfL and GFAP following relapses.1,3
NfL and GFAP are considered to represent neuroaxonal and astrocyte damage, respectively. Previous studies reported that serum NfL increased with the EDSS score in patients with MS, NMOSD, and MOGAD.8–10 We confirmed that serum NfL correlated with the EDSS score of patients with MOGAD and showed a tendency to increase alongside the EDSS score of patients with NMOSD; however, we could not achieve statistical significance, likely due to the small number of patients in our study. We also confirmed that the serum GFAP level reflected recent disease activity and correlated with the EDSS score of patients with NMOSD.10
Our biomarker analysis reinforced the pathophysiology of MOGAD and NMOSD. Serum tau and GFAP reflected oligodendrocytopathy by MOG-Ab and astrocytopathy by AQP4-Ab in each of the 2 diseases, respectively. NfL reflected secondary axonal injury and, as such, acted as a common biomarker for both diseases.
Several limitations should be noted. We assessed patients of a single ethnicity from a single center, which implies a lack of generalizability. Longitudinal follow-up data to verify the clinical value of these biomarkers are also lacking. The results should be interpreted cautiously because the number of included patients was small.
The pattern of serum biomarkers of disease activity and disability in MOGAD showed a distinct feature from those in NMOSD with AQP4-Ab, which implicates different pathogeneses between the 2 diseases. Furthermore, our study indicated that the serum tau level may play a role as a biomarker in patients with MOGAD.
Glossary
- AQP4-Ab
aquaporin-4 antibody
- EDSS
Expanded Disability Status Scale
- GFAP
glial fibrillary acidic protein
- MOG
myelin oligodendrocyte glycoprotein
- MOG-Ab
MOG antibody
- MOGAD
MOG-Ab–associated disease
- NfL
neurofilament light chain
- NMOSD
neuromyelitis optica spectrum disorder
- ROC
receiver operating characteristic
Appendix. Authors


Study funding
This study was supported by grants from the Ministry of Science and ICT, South Korea (NRF-2018R1C1B6008884, NRF-2018M3A9E8066249), Ministry of Health & Welfare, South Korea (HI18C2383), and Asan Institute for Life Science (2019-0830, 2019-0851), Asan Medical Center, Seoul, South Korea.
Disclosure
H. Kim, E.-J. Lee, S. Kim, L.-K. Choi, K. Kim, H.W. Kim, K.-K. Kim, and Y.-M. Lim report no disclosures. Go to Neurology.org/NN for full disclosures.
References
- 1.Peschl P, Bradl M, Höftberger R, Berger T, Reindl M. Myelin oligodendrocyte glycoprotein: deciphering a target in inflammatory demyelinating diseases. Front Immunol 2017;8:529. [DOI] [PMC free article] [PubMed] [Google Scholar]
- 2.Dos Passos GR, Oliveira LM, da Costa BK, et al. . MOG-IgG-associated optic neuritis, encephalitis, and myelitis: lessons learned from neuromyelitis optica spectrum disorder. Front Neurol 2018;9:217. [DOI] [PMC free article] [PubMed] [Google Scholar]
- 3.Reindl M, Waters P. Myelin oligodendrocyte glycoprotein antibodies in neurological disease. Nat Rev Neurol 2019;15:89–102. [DOI] [PubMed] [Google Scholar]
- 4.Juryńczyk M, Jacob A, Fujihara K, Palace J. Myelin oligodendrocyte glycoprotein (MOG) antibody-associated disease: practical considerations. Pract Neurol 2019;19:187–195. [DOI] [PubMed] [Google Scholar]
- 5.LoPresti P. Tau in oligodendrocytes takes neurons in sickness and in Health. Int J Mol Sci 2018;19:2408. [DOI] [PMC free article] [PubMed] [Google Scholar]
- 6.Guimaraes I, Cardoso MI, Sa MJ. Tau protein seems not to be a useful routine clinical marker of axonal damage in multiple sclerosis. Mult Scler 2006;12:354–356. [DOI] [PubMed] [Google Scholar]
- 7.Islas-Hernandez A, Aguilar-Talamantes HS, Bertado-Cortes B, et al. . BDNF and tau as biomarkers of severity in multiple sclerosis. Biomark Med 2018;12:717–726. [DOI] [PubMed] [Google Scholar]
- 8.Mariotto S, Ferrari S, Gastaldi M, et al. . Neurofilament light chain serum levels reflect disease severity in MOG-Ab associated disorders. J Neurol Neurosurg Psychiatry 2019;90:1293–1296. [DOI] [PubMed] [Google Scholar]
- 9.Kuhle J, Kropshofer H, Haering DA, et al. . Blood neurofilament light chain as a biomarker of MS disease activity and treatment response. Neurology 2019;92:e1007–e1015. [DOI] [PMC free article] [PubMed] [Google Scholar]
- 10.Watanabe M, Nakamura Y, Michalak Z, et al. . Serum GFAP and neurofilament light as biomarkers of disease activity and disability in NMOSD. Neurology 2019;93:e1299–e1311. [DOI] [PubMed] [Google Scholar]
Associated Data
This section collects any data citations, data availability statements, or supplementary materials included in this article.
Data Availability Statement
Anonymized data will be available on requests.


