Abstract
Objective
To establish cytometry profiles associated with disease stages and immunotherapy in MS.
Methods
Demographic/clinical data and peripheral blood samples were collected from 227 patients with MS and 82 sex- and age-matched healthy controls (HCs) enrolled in a cross-sectional study at 4 European MS centers (Spain, Italy, Germany, and Norway). Flow cytometry of isolated peripheral blood mononuclear cells was performed in each center using specifically prepared antibody-cocktail Lyotubes; data analysis was centralized at the Genoa center. Differences in immune cell subsets were assessed between groups of untreated patients with relapsing-remitting or progressive MS (RRMS or PMS) and HCs and between groups of patients with RRMS taking 6 commonly used disease-modifying drugs.
Results
In untreated patients with MS, significantly higher frequencies of Th17 cells in the RRMS population compared with HC and lower frequencies of B-memory/B-regulatory cells as well as higher percentages of B-mature cells in patients with PMS compared with HCs emerged. Overall, the greatest deviation in immunophenotype in MS was observed by treatment rather than disease course, with the strongest impact found in fingolimod-treated patients. Fingolimod induced a decrease in total CD4+ T cells and in B-mature and B-memory cells and increases in CD4+ and CD8+ T-regulatory and B-regulatory cells.
Conclusions
Our highly standardized, multisite cytomics data provide further understanding of treatment impact on MS immunophenotype and could pave the way toward monitoring immune cells to help clinical management of MS individuals.
Individual interactions between inflammatory, demyelinating, and degenerative processes underlying MS determine a large heterogeneity in clinical course and treatment response1,2,e2 (links.lww.com/NXI/A199). In addition to clinical and imaging data, characterization of immune cell alterations occurring during the disease and in response to treatment provides help in better understanding MS pathogenesis and the mechanism of action of drugs.3–6
Changes in immune cell subsets in peripheral blood mononuclear cells (PBMCs) have been proposed as surrogate biomarkers of activity to monitor treatment response in MS and help in treatment decision.7–9 Immunophenotyping studies of patients with MS have focused on alterations in composition and function of T- or B-cell subsets,10–12 but comprehensive studies are lacking and present discrepancies.13 Although a few studies comparing the effect of different disease-modifying treatments (DMTs) on immune cells are available, reproducibility of reliable findings is lacking, possibly due to technical issues including the use of different flow cytometry parameters and monoclonal antibodies defining cell subpopulations.13 Other limitations are represented by immune system variations including time-dependent changes, interindividual modifications, and heritable and nonheritable influences such as microbial and environmental factors14 and by small groups of patients with different disease characteristics.
To overcome technical difficulties, large multisite studies are preferable, but concerns have been raised about the accuracy and consistency of sample processing. A strict standardization of assays is indeed essential to obtain accurate measurement of variations in the immunologic profile. Although several international consortia have been created to standardize immunophenotyping by flow cytometry,15,16 multicentric studies are still lacking.
Here, we present cytomics data obtained through a cross-sectional study within the European Sys4MS project, which uses a systems medicine approach combining integrative omics, imaging, and clinical data to develop algorithms that can be used in clinical practice toward prognosis and treatment management. We have set up a reliable methodology for highly standardized multisite PBMC processing and flow cytometry acquisition and analysis and applied such methodology to establish cytometry profiles possibly associated with disease course and/or response to treatment in a relatively large cohort of patients. We observed differences in both T- and B-cell subsets related to disease phase in untreated patients; monitoring of the effect on immune cells induced by DMTs pointed to fingolimod (FINGO) as the drug with the greatest impact on relevant subpopulations, in particular effector and regulatory T and B cells.
Methods
Study population
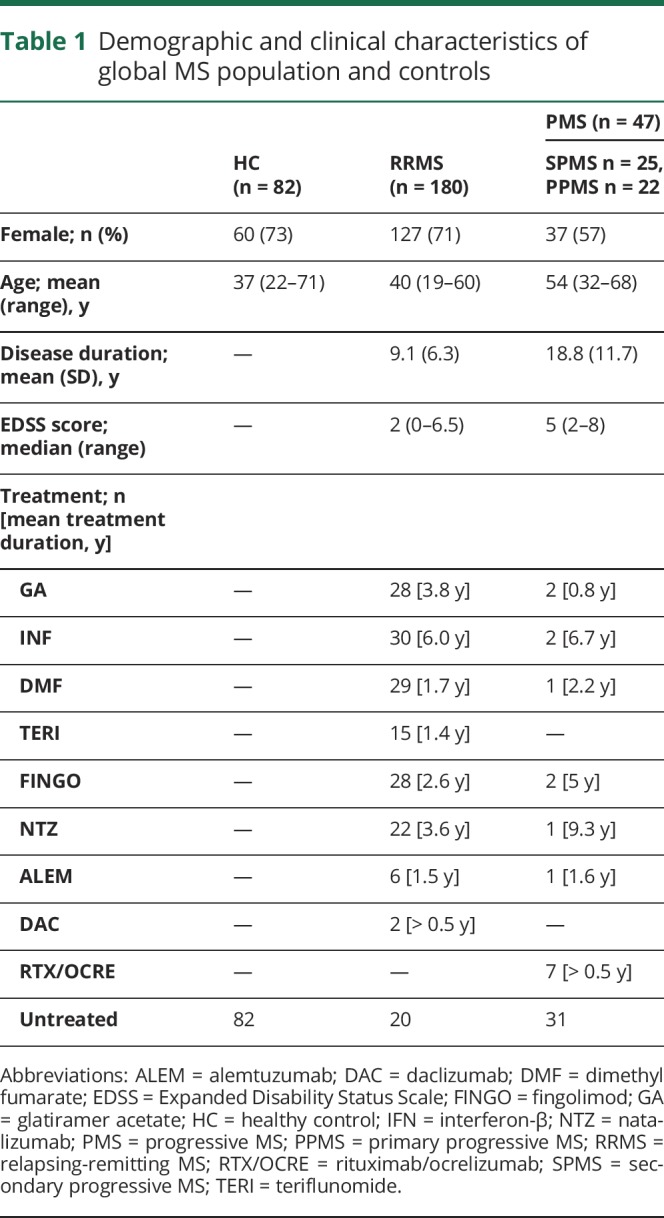
A total of 227 patients with MS (180 relapsing-remitting MS [RRMS] and 47 progressive MS [PMS], including 25 secondary and 22 primary PMS) and 82 sex- and age-matched healthy controls (HCs) were prospectively enrolled between October 2016 and August 2017 at 4 European MS centers (44 patients and 12 HCs from Hospital Clinic of Barcelona, Spain; 51 patients and 25 HCs from Oslo University Hospital, Norway; 41 patients and 22 HCs from Charité-Universitaetsmedizin Berlin, Germany; 91 patients and 23 HCs from Ospedale Policlinico San Martino, Genoa, Italy). All patients underwent collection of demographic data, clinical history, peripheral blood samples, and assessment of the Expanded Disability Status Scale (EDSS) score. Demographic/clinical data regarding the global population are reported in table 1. See supplemental material (links.lww.com/NXI/A199) for inclusion criteria.
Table 1.
Demographic and clinical characteristics of global MS population and controls
Standard protocol approvals, registrations, and patient consents
The Sys4MS project was approved by the institutional review board of University of Genoa, University of Oslo, Charité-Universitaetsmedizin, and Hospital Clinic of Barcelona. Patients provided signed informed consent before their enrollment on the study according to the Declaration of Helsinki.
Standardization of blood processing and flow cytometry acquisition and analysis
The multicentric study was set up to ensure the highest standardization at all levels and consequently reduce possible bias: standard operating procedures were followed by all 4 centers for PBMC isolation and flow cytometry acquisition of data; use of Lyotubes (BD Biosciences, Milan, Italy, Cat. No. 625148) from a single batch by all centers; use of identical type of flow cytometer equipment and software in all centers; and centralized analysis of the data from all centers. See supplemental material (links.lww.com/NXI/A199) and figure e-1 (links.lww.com/NXI/A200) for details of the antibody panels of the Lyotubes and relevant flow cytometry procedures and analysis.
Statistics
Analyses were performed using SPSS 22.0, GraphPad Prism 8.0, and R 3.5.0. Differences in CD3/CD4 subpopulations in T-reg vs T-eff tubes and between centers were assessed by the t test and analysis of variance (ANOVA), respectively. For all subgroup analyses, demographic differences between groups were analyzed using the χ2 test, Mann-Whitney/Kruskal-Wallis test, independent samples t test, and ANOVA where appropriate. Comparisons of cell frequencies between untreated patients with RRMS, untreated patients with PMS, and HCs, as well as across groups of patients with RRMS treated with different drugs, untreated patients with RRMS, and HCs, were assessed by analysis of covariance (ANCOVA), adjusting for age and sex. When comparing untreated patients with RRMS vs untreated patients with PMS, disease duration and EDSS score were added to the covariates listed above. A p value ≤0.05 was considered significant. In addition, significance levels after Bonferroni correction (to adjust for multiple testing) are provided. Principal component (PC) analysis was used to show the distribution of the populations and reduce the dimensionality, considering all the variables together. Data were visualized using t-distributed Stochastic Neighbor Embedding (t-SNE),17 a nonlinear data reduction algorithm that enables the visualization of high-dimensional data represented as 2-dimensional maps, which preserve the original spacing of the data sets.
Data availability
Codified data are available through the MultipleMS EU project and database (multiplems.eu) on registration.
Results
Strict standardization permitted reliable results from a multicentric cohort
To verify that there was no significant drift with time in the behavior of the flow cytometry equipment, or in the batch of Lyotubes used in each center, we performed a linear regression analysis. As shown in figure e-2 (links.lww.com/NXI/A201), the coefficients of determination r2 indicated a very poor correlation between time (x-axis) and tube content (y-axis), with the regression line slopes being close to 0. These data confirm that there was very little variation in the behavior of the equipment and Lyotubes in the different centers with time.
Because the same CD3+CD4+ broad cell population could be identified in both T-reg and T-eff tubes, we assessed the data obtained for this population in both tubes to monitor reproducibility between tubes in each center and across the 4 centers (figure e-3, links.lww.com/NXI/A202). There were no differences in CD3+CD4+ T-cell frequencies in HCs or patients with MS between the T-reg and T-eff tubes when the data from each center were assessed separately (figure e-3A), nor when T-reg and T-eff tubes were compared across centers (figure e-3B). Altogether, these data point to the high reliability of the data resulting from strict standardization of the multicentric study.
Untreated patients with MS show differences in T and B cells according to disease course
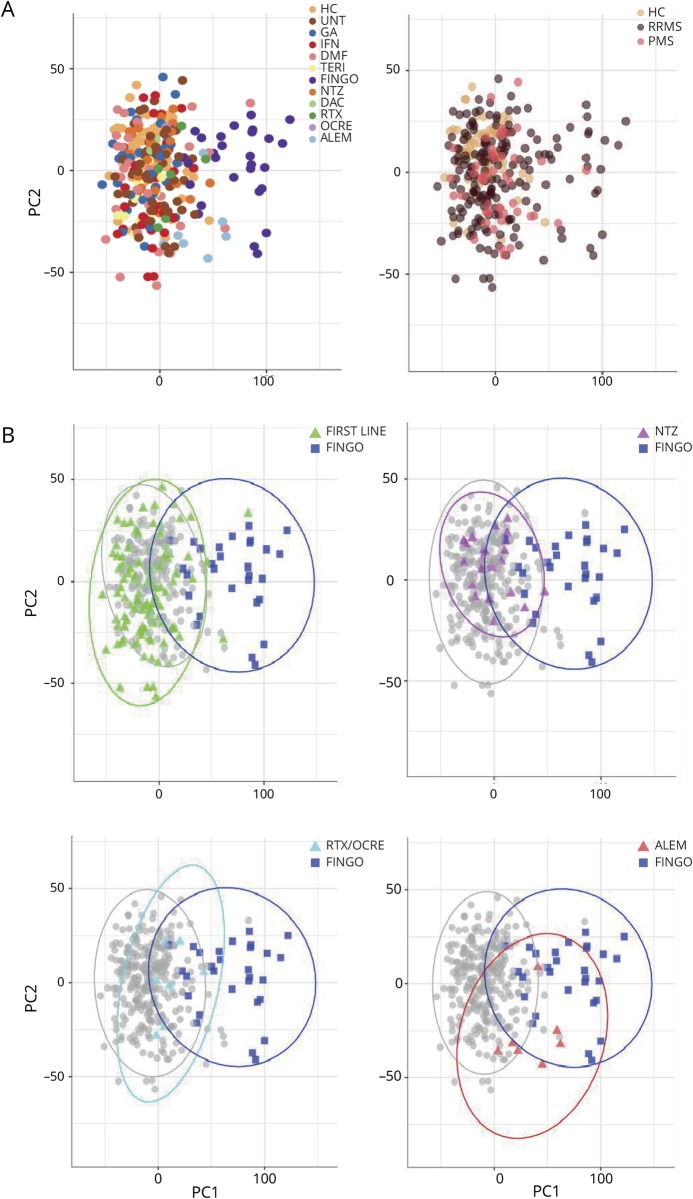
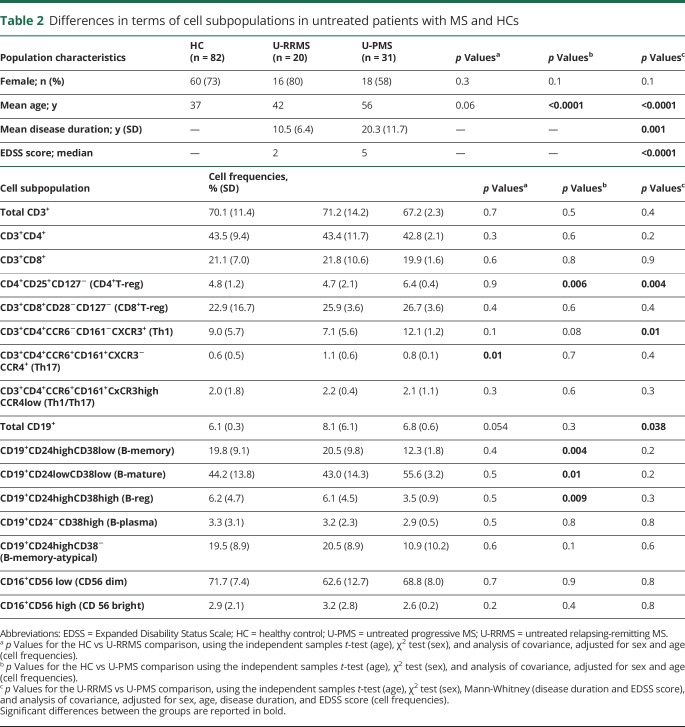
As a prerequisite to exploring differences in terms of immune cells across the whole population, we applied a PC analysis including all the lymphocyte subpopulations studied (figure 1). By plotting the first and second PCs, we obtained a meaningful representation of the data variance, whereby the first and second PCs explained the 34.4% and 13.8% of the variance, respectively. As we observed a stronger deviation in the immunologic profile of patients with MS in relation to treatment than to disease phenotype (figure 1A), our initial analysis focused on untreated patients and HCs to determine possible differences in patients with RRMS or PMS without the influence of therapy. Data are reported in table 2. As previously reported,4,12 significantly higher frequencies of Th17 cells in the untreated RRMS population compared with HC (p = 0.01) emerged; Th17 cells did not significantly differ in the PMS group compared with HCs or with patients with RRMS. Frequencies of Th1 classic cells were higher in patients with PMS compared with patients with RRMS (p = 0.01), but not compared with HCs. No difference in the Th1/Th17 cells emerged between groups. Among the CD4+ cells, we also observed increased frequencies in CD4+CD25+CD127− (CD4+ T-reg) in patients with PMS compared with patients with RRMS (p = 0.004) or HCs (p = 0.006). Frequency of CD4+ T-reg cells was similar between RRMS and HC. None of the CD8+ T-cell populations differed with disease phenotype.
Figure 1. Principal component analysis showing population distribution according to phenotype and treatment.
Representation of the data variance (PC1 explaining the 34.4% and PC2 13.8% of the variance, respectively). The weights of PC1 and PC2 are reported in the supplemental material file (links.lww.com/NXI/A199). This figure represents the same scattered plot, where (A) shows population distribution according to treatment (left panel) and to disease phenotype (right panel), and (B) shows the 95% confidence ellipses for different drugs, and in particular, immunomodulatory/first-line-treated (GA, IFN, DMF, and TERI) patients and FINGO-treated patients (upper left panel), antimigratory-treated (NTZ) patients and FINGO-treated patients (upper right panel), anti–CD20-treated (RTX/OCRE) patients and FINGO-treated patients (lower left panel), and anti–CD52-treated (ALEM) patients and FINGO-treated patients (lower right panel). ALEM = alemtuzumab; DAC = daclizumab; DMF = dimethyl fumarate; FINGO = fingolimod; GA = glatiramer acetate; HC = healthy control; IFN = interferon-β; NTZ = natalizumab; OCRE = ocrelizumab; PMS = progressive MS; RRMS = relapsing-remitting MS; RTX = rituximab; TERI = teriflunomide; UNT = untreated patients.
Table 2.
Differences in terms of cell subpopulations in untreated patients with MS and HCs
Analysis of total CD19+ cells showed an increased frequency in patients with RRMS compared with patients with PMS (p = 0.038). However, further investigation showed robust immunologic changes in B-cell subpopulations in patients with PMS. In particular, lower frequencies in CD19+CD24high cells, both CD38low (B-memory) or CD38high (B-reg), and higher values of CD19+CD24lowCD38low (B-mature) were evident in patients with PMS compared with HCs (p = 0.004, p = 0.009, and p = 0.01, respectively); no significant differences in these subpopulations were observed between untreated patients with PMS and untreated patients with RRMS. None of the differences described above survived multiple testing comparison (none of the p values reached Bonferroni corrected for 16 variables across 3 groups: p < 0.001).
Impact of treatment on immune cell frequencies
After assessing the immunologic differences related to disease course, we investigated the effect of treatment. Overall, the strongest impact on immune cells seemed attributable to FINGO (figure 1). Indeed, PC analysis showed a segregation of FINGO-treated patients compared with all the others, even when they were grouped according to the drugs' mechanism of action (immunomodulatory first-line drugs: glatiramer acetate (GA)/interferon-β (IFN)/dimethyl fumarate (DMF)/teriflunomide (TERI); antimigratory drug (other than FINGO): natalizumab (NTZ); anti-CD20: rituximab/ocrelizumab (RTX/OCRE); and anti-CD52: alemtuzumab (ALEM) monoclonal antibodies, figure 1B).
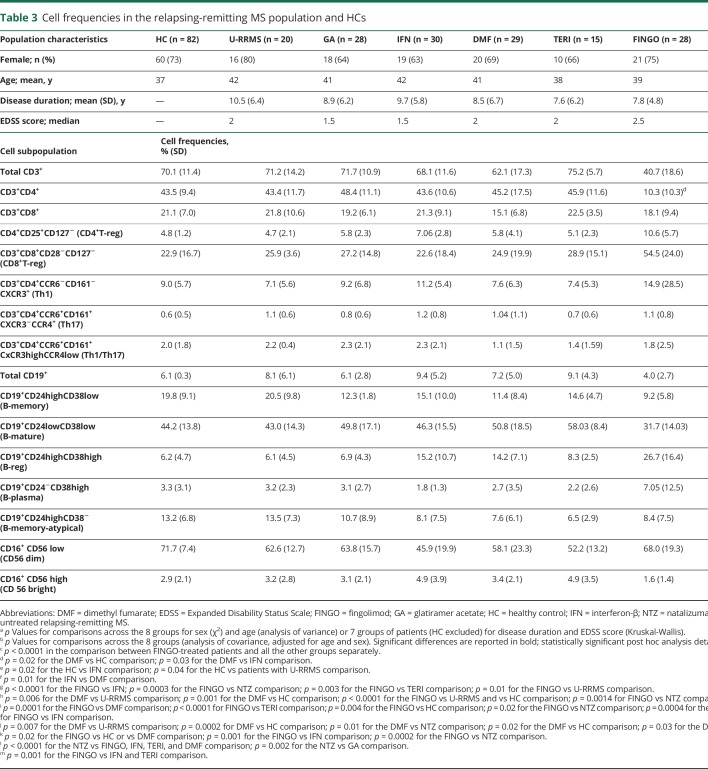
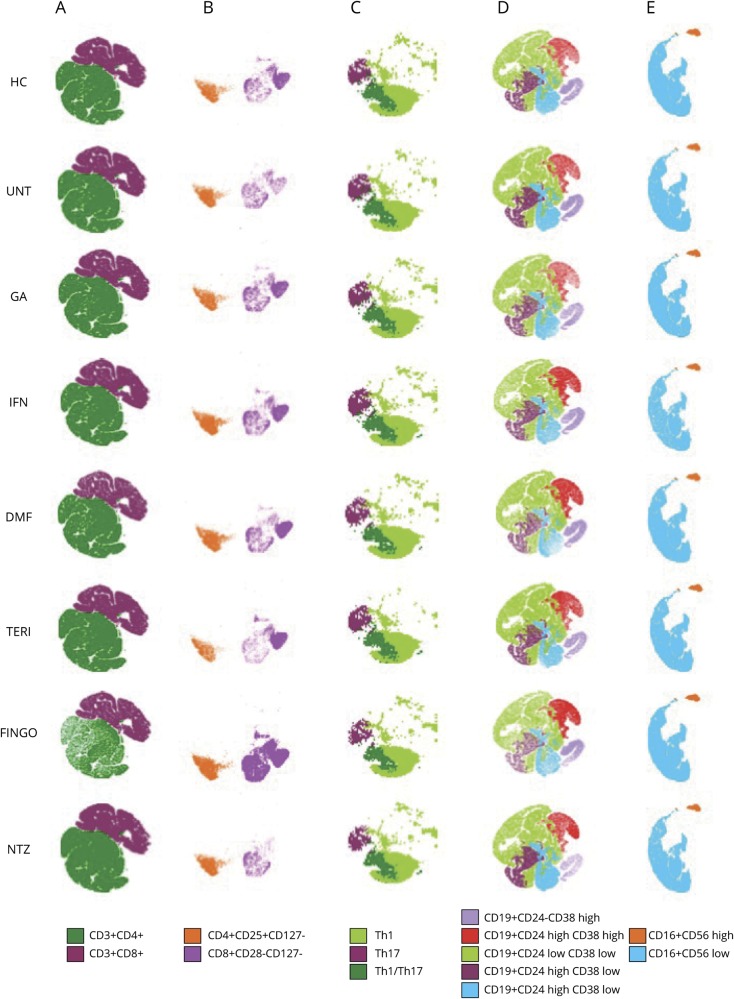
At the level of single immune cell populations, we assessed differences induced by treatments only in patients with RRMS, as they represented a more homogeneous population (same disease course, no differences in terms of the mean disease duration or EDSS score; table 3). Because only a few patients with RRMS were taking ALEM (n = 6) or daclizumab (n = 2), we excluded these patients from this analysis. Thus, we only considered patients with RRMS who were under treatment with the 6 DMTs most commonly used in these cohorts (GA, IFN, DMF, TERI, FINGO, and NTZ), untreated RRMS, and HC. The frequencies of the different cell subpopulations for each group and ANCOVA results are reported in table 3. A post hoc analysis confirmed FINGO being the drug with the strongest impact on different cell subpopulations, as described below and shown in figure 2 (depicted by t-SNE algorithm). Bonferroni correction for multiple comparison was applied for the 16 variables across the 8 groups (p < 0.0004).
Table 3.
Cell frequencies in the relapsing-remitting MS population and HCs
Figure 2. T-distributed Stochastic Neighbor Embedding (t-SNE) representation of the immunologic profiles of healthy controls and patients with relapsing-remitting MS under different disease-modifying treatments.
Representations, as depicted by t-SNE algorithm (n = 600,000 cells), of (A) total CD4+ and CD8+ T cells; (B) T-reg cells; (C) T-eff cells; (D) CD19+ B cells; and (E) NK cells. DMF = dimethyl fumarate; FINGO = fingolimod; GA = glatiramer acetate; HC = healthy control; IFN = interferon-β; NTZ = natalizumab; TERI = teriflunomide; UNT = untreated patients.
DMTs and T cells: downregulation of CD3+CD4+ cells and upregulation of CD4+ and CD8+T-reg cells in FINGO-treated patients
Data are presented in table 3 and Figure 2, A–C. FINGO-treated patients had lower frequencies in total CD4+ T cells (p < 0.0001 for FINGO vs each other group); no effect of FINGO on total CD8+ T cells emerged. CD8+ T-cell frequencies were slightly reduced in DMF-treated compared with IFN-treated patients (p = 0.03) and HCs (p = 0.02), but this difference did not survive the multiple testing comparison. We observed a clear increase in both CD4+ (CD4+CD25+CD127−) and CD8+ (CD8+CD28−CD127−) T-reg cell frequencies in FINGO-treated patients compared with each other group (p < 0.0001). No effect was observed in the FINGO-treated population in terms of Th1, Th17, and Th1/17 cells. Th17 cells were lower in HCs compared with IFN-treated patients (p = 0.03), whereas Th1/Th17 cells were higher in IFN-treated vs DMF-treated patients (p = 0.01), but these differences did not survive multiple comparisons.
DMTs and B cells: upregulation of B-reg and downregulation of B-memory and B-mature cell frequencies in FINGO-treated patients
Data are presented in table 3 and figure 2D. Patients treated with anti-CD20 were excluded from this analysis because they have almost no B cells. We observed reduced frequencies of total CD19+ cells in FINGO-treated compared with untreated, IFN-, NTZ- or TERI-treated patients (p = 0.01, p < 0.0001, p = 0.0003, and p = 0.003, respectively). Only FINGO vs IFN and NTZ survived multiple testing comparison. Frequencies of CD19+CD24highCD38high B-reg cells were higher in FINGO-treated patients (p < 0.0001 compared with each other group), in DMF-treated patients compared with HCs (p = 0.0002), untreated (p = 0.007) or NTZ-treated (p = 0.01) patients, and in the IFN-treated group compared with HCs (p < 0.0001), untreated (p = 0.001), or NTZ- and GA-treated (p = 0.001 and p = 0.002, respectively) patients. Comparison between DMF- and IFN-treated populations survived multiple testing comparison only vs HC. Frequencies of CD19+CD24highCD38low B-memory cells were lower in the FINGO-treated patients vs HCs (p < 0.0001) and vs untreated (p < 0.0001) and NTZ-treated (p = 0.0014) patients, the latter not surviving multiple testing comparison. Nominal significance was also reached in the DMF-treated group, with lower frequencies of B-memory cells vs untreated patients and HCs (p = 0.006 and p = 0.001, respectively). A significant increase in CD19+CD24highCD38− B-memory-atypical cells in NTZ-treated patients compared with FINGO-, IFN-, TERI-, and DMF-treated patients (p < 0.0001 for all the comparisons) emerged; nominal significance was also observed in the NTZ vs GA comparison (p = 0.002). The FINGO-treated group also showed reduced frequencies of CD19+CD24lowCD38low mature B cells compared with DMF- (p = 0.0001) and TERI-treated (p < 0.0001) patients, reaching nominal significance in the comparison with HCs (p = 0.004), NTZ- (p = 0.02), GA- (p = 0.0004), and IFN-treated (p = 0.01) patients. Last, CD19+CD24−CD38high plasma cells were higher in the FINGO-treated group compared with DMF- (p = 0.02), IFN- (p = 0.001), NTZ- (p = 0.0002) treated patients, or HCs (p = 0.01), with only the comparison with NTZ surviving multiple testing comparison.
No evident impact of treatment in terms of NK cells, either CD56dim or CD56bright, was observed (table 3 and figure 2E). Nominal significance was reached in the comparison of CD56bright NK cells for FINGO-treated (1.6%) vs IFN-treated (4.9%, p = 0.001) or TERI-treated (4.9%, p = 0.001) patients, but none of the comparisons survived multiple testing analysis.
Discussion
Characterization of immunologic changes occurring during MS and in response to DMTs could affect the choice of the most appropriate therapy.7 The impact of MS drugs on the immune system differs in terms of rapidity, selectivity, magnitude, and durability, resulting in short- and long-term effects differently affecting immune cell subsets. The gold standard of therapy for autoimmune diseases such as MS is the eradication of autoreactive cells and restoration of immune tolerance resulting in the control of effector/pathogenic/autoreactive cells by regulatory networks. Characterization of the impact of DMTs on the immune system not only helps to better understand their mechanisms of action but has also given insights into the immunopathogenesis of MS.3 A clear example comes from the use of B-cell depleting drugs, which demonstrated, beyond antibody-dependent functions, unexpected antibody-independent roles for B cells.18 Accordingly, studies addressing comprehensively the impact of DMTs on large cohorts of patients with MS and taking advantage of robust and reproducible methodological approaches are of pivotal importance.
Altered levels and/or functional abnormalities in T or B cells have already been reported in patients with MS.12,19–21 However, previous studies are generally characterized by several limitations, including the focus on particular restricted immune cell subsets, small groups of patients mainly treated with a single DMT,11,22–31 different disease characteristics, lack of inclusion of controls, and difficult standardization of sample processing.5,13,15,16 In this study, we have undertaken a large multicentric analysis of the immunologic profile of T and B cells in a cohort of 227 patients with MS at different disease stages treated with different DMTs and 82 HCs. We show that our highly standardized approach provided reliable results, compensating the paucity of reproducible findings in large and multicentric cohorts.5,16
Using this standardized reliable methodology, we have compared single-cell subpopulations between groups of patients with untreated RRMS or PMS and HCs (to evaluate immunologic features at different MS phases without the confound of immunomodulatory therapy exposure) and assessed differences induced by 6 commonly used DMTs with different mechanism of action.
Although the strongest immune deviation in patients with MS appeared to be induced by treatments rather than by disease course, we observed some differences in single immune cell subpopulations also in untreated patients. In particular, untreated patients with RRMS showed higher frequencies of Th17 cells compared with HCs. Although elevated Th17 cells have been reported across the whole spectrum of MS phenotypes, being particularly indicative of an active inflammatory process,12,32 we only observed differences between RRMS and HC, but not between PMS and HC or RRMS; this discrepancy32 could be related to the smaller number of patients with PMS included in our study and to the fact that our analyses were corrected for both age and sex, as well as for disease duration and EDSS score, when comparing RRMS and PMS. We also observed increased frequencies of CD4+T-reg cells in patients with PMS compared with patients with RRMS and HCs; CD4+CD25+CD127low/–FoxP3 have been reported to be lowest in RRMS, but to recover in the later secondary PMS phase.4,33 Although we did not evaluate FoxP3 expression associated with CD4+ T-reg cells, the monitoring of CD4+CD25+CD127− T cells is equivalent with the analysis of CD4+CD25+CD127low/–FoxP3 T cells,4 and our results suggest that CD4+ T-reg cell frequencies increase in the progressive phases of the disease, but remain stable in the initial relapsing phase. In untreated patients with PMS, a deviation in the frequencies of B-cell subpopulations was also observed compared with HCs, with a decrease of B-memory and B-reg cells and an increase of the B-mature arm. This is particularly interesting as the first DMT affecting disability progression in PMS is a B cell–depleting agent (ocrelizumab).34
When we compared the effect of treatments on immune cells of patients included in this study, the strongest impact was observed in the FINGO-treated patients. Our results confirm and strengthen those of a previous study,10 where FINGO had been shown to induce the greatest changes in the peripheral immune system compared with other drugs in the study. In line with previous findings, we observed a decrease in total CD4+ T cells in patients treated with FINGO; significant decreases were also observed in these patients for total CD19+ B cells and more particularly mature and memory B cells. We also observed a clear increase in both CD4+ and CD8+ T-reg cells as well as in B-reg cells in FINGO-treated patients. These findings support previous findings suggesting a role for FINGO in restoring regulatory networks possibly impaired in MS.27,28,35,36
Contradictory data on the effect of FINGO treatment on Th17 cells have been reported.9,27,28,36 Thus, opposite results were obtained in some longitudinal studies, with FINGO upregulating9 or downregulating27 this T-cell subset. In a cross-sectional study, a decrease in Th17 cells was observed.28 In contrast, on par with another study,36 we did not observe any overall difference in Th17 cell frequency in FINGO-treated patients. This could be due to the use of different and/or fewer surface markers used to define this T-cell subset.9,27,28,36
Other DMTs had an impact on immune cell profile. Thus, as already reported, CD8+ T cells31,37 and B-reg and B-memory cells11,25 were affected by DMF treatment. The limited use, in our cohort of patients, of DMTs that more recently entered the market in Europe did not allow us to obtain enough information on B cell–depleting agents and on cladribine.
The mode of action of FINGO on immune cells is believed to be antimigratory, related to their expression of sphingosine-1-phosphate receptors, whereby FINGO treatment would prevent their egress from lymphoid tissue and their migration into the CNS.38 Of interest, NTZ, a recombinant humanized anti-α4-integrin antibody preventing immune cells to cross the blood-brain barrier, affected immune cell levels, especially atypical memory B cells, albeit to a lesser extent than FINGO. It should be noted that in contrast to most other studies, our data were obtained through comparison between several DMTs at a cross-sectional level, rather than through a longitudinal study of the effect of 1 drug. In this context, the mode of action of FINGO might not be strictly accounted for by its antimigratory effect. Recent studies suggest other possible, adjunctive mechanisms, whereby FINGO would suppress lymphopoiesis,39 and through blocking of the S1P1 receptors on T cells could also lead to the sequestration of T cells in the bone marrow,40 thereby reducing circulating deleterious T cells and consequently neuroinflammation.
Altogether, the results of our highly standardized study, which compares the immunophenotype changes in patients with MS undergoing several widely used treatments rather than longitudinal monitoring of cell subtypes in patients under a single treatment type, strengthen and add to previous findings. They also suggest that immunomonitoring by flow cytometry, as an adjunct to clinical and imaging data, could deepen our knowledge about the mechanism of action of DMTs. It appears particularly interesting for FINGO, whose impact on the immune system suggests that its effects might go beyond the well-known antimigratory effect. Further highly standardized studies that include longitudinal data and encompass larger cohorts of patients treated with each DMT could provide proof of concept toward the additional use of immunophenotype monitoring in treatment management.
Acknowledgment
This work was supported by the European Commission (ERACOSYSMED ERA-Net program, Sys4MS project, id:43), Instituto de Salud Carlos III, Spain (AC1500052), the Italian Ministry of Health (WFR-PER-2013-02361136), the German Ministry of Science (Deutsches Teilprojekt B “Förderkennzeichen: 031L0083B”), and the Norwegian Research Council (project 257955). The authors thank E. Carpi, I. Mo, and F. Kropf for their technical and/or help with patients at Genoa and Oslo centers and all the participating patients with MS and healthy individuals.
Glossary
- ALEM
alemtuzumab
- ANCOVA
analysis of covariance
- ANOVA
analysis of variance
- DMF
dimethyl fumarate
- DMT
disease-modifying treatment
- EDSS
Expanded Disability Status Scale
- FINGO
fingolimod
- GA
glatiramer acetate
- HC
healthy control
- IFN
interferon-β
- NTZ
natalizumab
- PBMC
peripheral blood mononuclear cell
- PC
principal component
- PMS
progressive MS
- RRMS
relapsing-remitting MS
- RTX/OCRE
rituximab/ocrelizumab
- TERI
teriflunomide
- t-SNE
t-distributed Stochastic Neighbor Embedding
Appendix. Authors
Study funding
This work was supported by the European Commission (ERACOSYSMED ERA-Net program, Sys4MS project, id:43), Instituto de Salud Carlos III, Spain (AC1500052), the Italian Ministry of Health (WFR-PER-2013-02361136), the German Ministry of Science (Deutsches Teilprojekt B “Förderkennzeichen: 031L0083B”), and the Norwegian Research Council (project 257955).
Disclosure
M. Cellerino and F. Ivaldi report no disclosures. M. Pardini received research support from Novartis and Nutricia and honoraria from Merk and Novartis. G. Rotta is an employee of BD Biosciences Italy. G. Vila reports no disclosures. P. Bäcker-Koduah is funded by the DFG Excellence grant to FP (DFG exc 257) and is a junior scholar of the Einstein foundation. T. Berge has received unrestricted research grants from Biogen and Sanofi-Genzyme. A. Laroni received grants from FISM and Italian Ministry of Health and received honoraria or consultation fees from Biogen, Roche, Teva, Merck, Genzyme, and Novartis. C. Lapucci, G. Novi, G. Boffa, E. Sbragia, and S. Palmeri report no disclosures. S. Asseyer received a conference grant from Celgene. E. Høgestøl received honoraria for lecturing from Merck and Sanofi-Genzyme. C. Campi and M. Piana report no disclosures. M. Inglese received research grants from the NIH, DOD, NMSS, FISM, and Teva Neuroscience and received honoraria or consultation fees from Roche, Merck, Genzyme, and Biogen. F. Paul received honoraria and research support from Alexion, Bayer, Biogen, Chugai, Merck Serono, Novartis, Genzyme, MedImmune, Shire, and Teva and serves on scientific advisory boards of Alexion, MedImmune, and Novartis. He has received funding from Deutsche Forschungsgemeinschaft (DFG Exc 257), Bundesministerium für Bildung und Forschung (Competence Network Multiple Sclerosis), the Guthy-Jackson Charitable Foundation, EU Framework Program 7, and the National Multiple Sclerosis Society of the United States. H.F. Harbo received travel support, honoraria for advice, or lecturing from Biogen Idec, Sanofi-Genzyme, Merck, Novartis, Roche, and Teva and unrestricted research grants from Novartis and Biogen. P. Villoslada received consultancy fees and holds stocks from Bionure Farma SL, Spiral Therapeutics Inc, Health Engineering SL, QMenta Inc, and Attune Neurosciences Inc. N. Kerlero de Rosbo reports no disclosures. A. Uccelli received grants and contracts from FISM, Novartis, Biogen, Merck, Fondazione Cariplo, and Italian Ministry of Health and received honoraria or consultation fees from Biogen, Roche, Teva, Merck, Genzyme, and Novartis. Go to Neurology.org/NN for full disclosures.
References
- 1.Thompson AJ, Baranzini SE, Geurts J, Hemmer B, Ciccarelli O. Multiple sclerosis. Lancet 2018;391:1622–1636. [DOI] [PubMed] [Google Scholar]
- 2.Krieger SC, Cook K, De Nino S, Fletcher M. The topographical model of multiple sclerosis: a dynamic visualization of disease course. Neurol Neuroimmunol Neuroinflamm 2016;3:e279 doi: 10.1212/NXI.0000000000000279. [DOI] [PMC free article] [PubMed] [Google Scholar]
- 3.Martin R, Sospedra M, Rosito M, Engelhardt B. Current multiple sclerosis treatments have improved our understanding of MS autoimmune pathogenesis. Eur J Immunol 2016;46:2078–2090. [DOI] [PubMed] [Google Scholar]
- 4.Jones AP, Kermode AG, Lucas RM, Carroll WM, Nolan D, Hart PH. Circulating immune cells in multiple sclerosis. Clin Exp Immunol 2017;187:193–203. [DOI] [PMC free article] [PubMed] [Google Scholar]
- 5.Willis JC, Lord GM. Immune biomarkers: the promises and pitfalls of personalized medicine. Nat Rev Immunol 2015;15:323–329. [DOI] [PubMed] [Google Scholar]
- 6.Kalincik T, Manouchehrinia A, Sobisek L, et al. . Towards personalized therapy for multiple sclerosis: prediction of individual treatment response. Brain 2017;140:2426–2443. [DOI] [PubMed] [Google Scholar]
- 7.Pardo G, Jones DE. The sequence of disease-modifying therapies in relapsing multiple sclerosis: safety and immunologic considerations. J Neurol 2017;264:2351–2374. [DOI] [PMC free article] [PubMed] [Google Scholar]
- 8.Jaye DL, Bray RA, Gebel HM, Harris WA, Waller EK. Translational applications of flow cytometry in clinical practice. J Immunol 2012;188:4715–4719. [DOI] [PubMed] [Google Scholar]
- 9.Teniente-Serra A, Grau-Lopez L, Mansilla MJ, et al. . Multiparametric flow cytometric analysis of whole blood reveals changes in minor lymphocyte subpopulations of multiple sclerosis patients. Autoimmunity 2016;49:219–228. [DOI] [PubMed] [Google Scholar]
- 10.Dooley J, Pauwels I, Franckaert D, et al. . Immunologic profiles of multiple sclerosis treatments reveal shared early B cell alterations. Neurol Neuroimmunol Neuroinflamm 2016;3:e240 doi: 10.1212/NXI.0000000000000240. [DOI] [PMC free article] [PubMed] [Google Scholar]
- 11.Staun-Ram E, Najjar E, Volkowich A, Miller A. Dimethyl fumarate as a first- vs second-line therapy in MS: focus on B cells. Neurol Neuroimmunol Neuroinflamm 2018;5:e508 doi: 10.1212/NXI.0000000000000508. [DOI] [PMC free article] [PubMed] [Google Scholar]
- 12.Durelli L, Conti L, Clerico M, et al. . T-helper 17 cells expand in multiple sclerosis and are inhibited by interferon-beta. Ann Neurol 2009;65:499–509. [DOI] [PubMed] [Google Scholar]
- 13.Roep BO, Buckner J, Sawcer S, Toes R, Zipp F. The problems and promises of research into human immunology and autoimmune disease. Nat Med 2012;18:48–53. [DOI] [PubMed] [Google Scholar]
- 14.Davis MM, Brodin P. Rebooting human immunology. Annu Rev Immunol 2018;36:843–864. [DOI] [PMC free article] [PubMed] [Google Scholar]
- 15.Finak G, Langweiler M, Jaimes M, et al. . Standardizing flow cytometry immunophenotyping analysis from the human immunoPhenotyping consortium. Sci Rep 2016;6:20686. [DOI] [PMC free article] [PubMed] [Google Scholar]
- 16.Maecker HT, McCoy JP, Nussenblatt R. Standardizing immunophenotyping for the human immunology project. Nat Rev Immunol 2012;12:191–200. [DOI] [PMC free article] [PubMed] [Google Scholar]
- 17.van der Maaten L, Hinton G. Visualizing data using t-SNE. J Mach Learn Res 2008;9:2579–2605. [Google Scholar]
- 18.Li R, Patterson KR, Bar-Or A. Reassessing B cell contributions in multiple sclerosis. Nat Immunol 2018;19:696–707. [DOI] [PubMed] [Google Scholar]
- 19.Duddy M, Niino M, Adatia F, et al. . Distinct effector cytokine profiles of memory and naive human B cell subsets and implication in multiple sclerosis. J Immunol 2007;178:6092–6099. [DOI] [PubMed] [Google Scholar]
- 20.Viglietta V, Baecher-Allan C, Weiner HL, Hafler DA. Loss of functional suppression by CD4+CD25+ regulatory T cells in patients with multiple sclerosis. J Exp Med 2004;199:971–979. [DOI] [PMC free article] [PubMed] [Google Scholar]
- 21.Jelcic I, Al Nimer F, Wang J, et al. . Memory B cells activate brain-homing, autoreactive CD4(+) T cells in multiple sclerosis. Cell 2018;175:85–100.e23. [DOI] [PMC free article] [PubMed] [Google Scholar]
- 22.Chiarini M, Serana F, Zanotti C, et al. . Modulation of the central memory and Tr1-like regulatory T cells in multiple sclerosis patients responsive to interferon-beta therapy. Mult Scler 2012;18:788–798. [DOI] [PubMed] [Google Scholar]
- 23.Ireland SJ, Guzman AA, O'Brien DE, et al. . The effect of glatiramer acetate therapy on functional properties of B cells from patients with relapsing-remitting multiple sclerosis. JAMA Neurol 2014;71:1421–1428. [DOI] [PMC free article] [PubMed] [Google Scholar]
- 24.Klotz L, Eschborn M, Lindner M, et al. . Teriflunomide treatment for multiple sclerosis modulates T cell mitochondrial respiration with affinity-dependent effects. Sci Transl Med 2019;11. [DOI] [PubMed] [Google Scholar]
- 25.Lundy SK, Wu Q, Wang Q, et al. . Dimethyl fumarate treatment of relapsing-remitting multiple sclerosis influences B-cell subsets. Neurol Neuroimmunol Neuroinflamm 2016;3:e211 doi: 10.1212/NXI.0000000000000211. [DOI] [PMC free article] [PubMed] [Google Scholar]
- 26.Stüve O, Marra CM, Jerome KR, et al. . Immune surveillance in multiple sclerosis patients treated with natalizumab. Ann Neurol 2006;59:743–747. [DOI] [PubMed] [Google Scholar]
- 27.Serpero LD, Filaci G, Parodi A, et al. . Fingolimod modulates peripheral effector and regulatory T cells in MS patients. J Neuroimmune Pharm 2013;8:1106–1113. [DOI] [PMC free article] [PubMed] [Google Scholar]
- 28.Mehling M, Lindberg R, Raulf F, et al. . Th17 central memory T cells are reduced by FTY720 in patients with multiple sclerosis. Neurology 2010;75:403–410. [DOI] [PubMed] [Google Scholar]
- 29.Baker D, Herrod SS, Alvarez-Gonzalez C, Zalewski L, Albor C, Schmierer K. Both cladribine and alemtuzumab may effect MS via B-cell depletion. Neurol Neuroimmunol Neuroinflamm 2017;4:e360 doi: 10.1212/NXI.0000000000000360. [DOI] [PMC free article] [PubMed] [Google Scholar]
- 30.Gross CC, Ahmetspahic D, Ruck T, et al. . Alemtuzumab treatment alters circulating innate immune cells in multiple sclerosis. Neurol Neuroimmunol Neuroinflamm 2016;3:e289 doi: 10.1212/NXI.0000000000000289. [DOI] [PMC free article] [PubMed] [Google Scholar]
- 31.Spencer CM, Crabtree-Hartman EC, Lehmann-Horn K, Cree BA, Zamvil SS. Reduction of CD8(+) T lymphocytes in multiple sclerosis patients treated with dimethyl fumarate. Neurol Neuroimmunol Neuroinflamm 2015;2:e76 doi: 10.1212/NXI.0000000000000076. [DOI] [PMC free article] [PubMed] [Google Scholar]
- 32.Romme Christensen J, Börnsen L, Ratzer R, et al. . Systemic inflammation in progressive multiple sclerosis involves follicular T-helper, Th17- and activated B-cells and correlates with progression. PLoS One 2013;8:e57820. [DOI] [PMC free article] [PubMed] [Google Scholar]
- 33.Venken K, Hellings N, Broekmans T, Hensen K, Rummens JL, Stinissen P. Natural naive CD4+CD25+CD127low regulatory T cell (Treg) development and function are disturbed in multiple sclerosis patients: recovery of memory Treg homeostasis during disease progression. J Immunol 2008;180:6411–6420. [DOI] [PubMed] [Google Scholar]
- 34.Montalban X, Hauser SL, Kappos L, et al. . Ocrelizumab versus placebo in primary progressive multiple sclerosis. N Engl J Med 2017;376:209–220. [DOI] [PubMed] [Google Scholar]
- 35.Grützke B, Hucke S, Gross CC, et al. . Fingolimod treatment promotes regulatory phenotype and function of B cells. Ann Clin Transl Neurol 2015;2:119–130. [DOI] [PMC free article] [PubMed] [Google Scholar]
- 36.Sato DK, Nakashima I, Bar-Or A, et al. . Changes in Th17 and regulatory T cells after fingolimod initiation to treat multiple sclerosis. J Neuroimmunol 2014;268:95–98. [DOI] [PubMed] [Google Scholar]
- 37.Fleischer V, Friedrich M, Rezk A, et al. . Treatment response to dimethyl fumarate is characterized by disproportionate CD8+ T cell reduction in MS. Mult Scler 2018;24:632–641. [DOI] [PubMed] [Google Scholar]
- 38.Massberg S, von Andrian UH. Fingolimod and sphingosine-1-phosphate--modifiers of lymphocyte migration. N Engl J Med 2006;355:1088–1091. [DOI] [PubMed] [Google Scholar]
- 39.Blaho VA, Galvani S, Engelbrecht E, et al. . HDL-bound sphingosine-1-phosphate restrains lymphopoiesis and neuroinflammation. Nature 2015;523:342–346. [DOI] [PMC free article] [PubMed] [Google Scholar]
- 40.Chongsathidkiet P, Jackson C, Koyama S, et al. . Sequestration of T cells in bone marrow in the setting of glioblastoma and other intracranial tumors. Nat Med 2018;24:1459–1468. [DOI] [PMC free article] [PubMed] [Google Scholar]
Associated Data
This section collects any data citations, data availability statements, or supplementary materials included in this article.
Data Availability Statement
Codified data are available through the MultipleMS EU project and database (multiplems.eu) on registration.


