

Abstract
The intrinsically low spatial resolution of positron emission tomography (PET) leads to image quality degradation and inaccurate image-based quantitation. Recently developed supervised super-resolution (SR) approaches are of great relevance to PET but require paired low- and high-resolution images for training, which are usually unavailable for clinical datasets. In this paper, we present a self-supervised SR (SSSR) technique for PET based on dual generative adversarial networks (GANs), which precludes the need for paired training data, ensuring wider applicability and adoptability. The SSSR network receives as inputs a low-resolution PET image, a high-resolution anatomical magnetic resonance (MR) image, spatial information (axial and radial coordinates), and a high-dimensional feature set extracted from an auxiliary CNN which is separately-trained in a supervised manner using paired simulation datasets. The network is trained using a loss function which includes two adversarial loss terms, a cycle consistency term, and a total variation penalty on the SR image. We validate the SSSR technique using a clinical neuroimaging dataset. We demonstrate that SSSR is promising in terms of image quality, peak signal-to-noise ratio, structural similarity index, contrast-to-noise ratio, and an additional no-reference metric developed specifically for SR image quality assessment. Comparisons with other SSSR variants suggest that its high performance is largely attributable to simulation guidance.
Keywords: super-resolution, self-supervised, CNN, GAN, PET, multimodality imaging
1. Introduction
Positron emission tomography (PET) is a 3D functional imaging modality that uses exogenous radio-labeled contrast agents, referred to as radiotracers, to map the biodistribution of physiological processes and parameters. One of the key hurdles toward accurate quantitation using PET is its intrinsically poor spatial resolution [1]. A number of remedial strategies have been proposed to address this challenge. Of these, some model the point spread function (PSF) of the PET scanner within the image reconstruction framework [2, 3], while others perform image-domain corrections either set up as a partial volume correction problem [4, 5, 6] or an image deblurring problem [7, 8, 9, 10]. Recent advances in deep learning, particularly convolutional neural networks (CNNs), have ushered in a wide variety of novel super-resolution (SR) imaging techniques. SR imaging refers to the task of converting a low-resolution (LR) image to a high-resolution (HR) one. Seminal CNN-based SR models featured lightweight (shallower) networks [11] with some architectures performing the upsampling from the LR to the HR domain via a convolutional layer [12, 13]. Later efforts involving deeper CNN architectures, such as the very deep SR (VDSR) [14], led to substantial performance gains. While these CNN-based SR techniques tend to outperform classical deblurring and SR methods by large margins, it should be noted that they are based on supervised learning and consequently require matched LR-HR image pairs for training.
Our previous work on the resolution recovery of PET images includes both a (classical) penalized deconvolution approach based on joint entropy [15, 10] and a deep supervised learning approach inspired by the VDSR [9, 16]. An attractive feature of this latter approach is that it enables mapping from the image domain of legacy scanners to that of newer state-of-the-art scanners that exhibit greatly-enhanced image resolution. However, due to its supervised learning format, it requires paired LR and HR training samples with both images corresponding to the same human subject under similar scan settings. PET scans involve substantial overhead in terms of scan time, cost, and patient irradiation. This need for dual scans on LR and HR scanners is a major bottleneck in clinical settings and greatly limits the practical utility of VDSR and similar supervised SR techniques.
The need for paired LR-HR images for training could be a bottleneck even in the natural image processing domain as it necessitates the capture of the same image at different resolution scales. This has motivated a pursuit for unsupervised SR (USR) or self-supervised SR (SSSR) models, which are better equipped to deal with most real-world scenarios. The zero-shot SR network [17], for example, estimates a degradation kernel from a single test image. However, its requirement for network retraining for individual test images poses a computational burden in the validation and application phases. With the advent of state-of-the-art generative adversarial network (GAN) architectures, there is increasing interest in SR techniques that rely on weak supervision, i.e., using unpaired LR and HR images. One such GAN-based technique uses sub-pixel convolutions [18]. Following the success of image-to-image translation using the CycleGAN [19], which uses two generator and discriminator pairs, newer SSSR techniques have used two cycleGAN modules to learn the LR-HR mapping for natural images [20, 21]. Specific to the domain of facial landmark localization, a GAN-based approach was developed to simultaneously super-resolve facial images and detect landmarks from them [22]. These new networks are promising and tend to outperform classical single-image SR techniques [23, 24, 25].
For clinical imaging applications, it is usually infeasible to obtain the “ground-truth” HR counterparts for LR PET scans of human subjects. While paired LR-HR images are difficult to acquire, there is wider availability of unpaired LR and HR images (e.g., populations derived from distinct cohorts, with the same scanner, image acquisition, and image reconstruction settings being used for the same cohort). Additionally, each individual imaging modality leads to unique image characteristics that tend to be quite distinct from those of natural images, thereby hindering the direct application of image processing techniques developed for and validated on natural images. This has led to the emergence of domain-specific USR or SSSR techniques for medical modalities such as computed tomography (CT) [26], magnetic resonance imaging (MRI) [27], and ultrasound [28]. This paper addresses challenges unique to PET imaging and presents an SSSR technique based on dual GANs that is able to perform PET resolution recovery without requiring paired training samples.
The key methodological novelties of this work are as follows: (1) simulation guidance to boost SR performance in clinical datasets, (2) spatial inputs to account for the spatially-variant nature of image resolution in PET, (3) anatomical inputs to incorporate HR anatomical information, and (4) HR-to-LR mapping via generator pretraining which offers additional feature guidance for SR. The significance of our method lies in its immense value for data harmonization without requiring ground-truth training data and without sacrificing resolution in large multi-center studies [29], e.g., those connected to vast image repositories such as the Alzheimer’s Disease Neuroimaging Initiative (ADNI) and The Cancer Imaging Archive (TCIA). Without SR capabilities, data harmonization is typically performed by image degradation (e.g., by blurring HR images to match the resolution of the lowest-resolution images in the dataset), which is a suboptimal approach. To our knowledge, PET image mapping across two scanner domains based on unpaired training data is a previously unexplored area in the PET imaging field.
In Section 2, we present the underlying network architecture. In Section 3, we describe the clinical and simulation datasets and the training and validation steps. In Section 4, we present clinical results comparing the performance of the multiple SSSR variants with a range of reference approaches. Finally, in Section 5, we summarize this work and discuss its strengths and limitations.
2. Theory
2.1. Overview
The CycleGAN architecture [19], which consists of two generator-discriminator pairs, is particularly effective at image-to-image translation in an unpaired setting for training. Our SSSR network architecture for PET is broadly inspired by the CycleGAN in that it consists of two coupled GANs with one generator-discriminator pair performing LR-to-HR mapping and another generator-discriminator pair responsible for the reverse mapping. CycleGAN, however, is not directly applicable to SR imaging. Previously reported SR imaging techniques that rely on unpaired data have used dual CycleGANs leading to substantially higher computational burden [20, 21]. A key distinguishing aspect of our work is the use of a separately-trained VDSR network based on paired simulation datasets [16]. This simulation guidance, as we will demonstrate subsequently, enables us to generate SR images using dual GANs without requiring more expensive bi-cycle [21] or cycle-in-cycle structures [20].
Unlike uniformly-blurred natural images, PET images are blurred in a spatially-variant manner [2, 30]. We, therefore, accommodate spatial location details as inputs to assist the SR process. In light of the cylindrical symmetry of PET scanners, two spatial input channels are used, one containing the axial coordinates and the other containing the radial coordinates. Most PET scanners come equipped with anatomical imaging capabilities in the form of CT or MR to complement the functional information in PET with structural information. The anatomical counterparts of PET images typically have much higher resolution. To facilitate SR image recovery, we utilize HR features from MR images derived from an additional anatomical input channel. These additional inputs are vital for super-resolving PET images. The spatially-variant nature of spatial resolution in PET makes the resolution recovery problem quite different from that for MR or CT. Additionally, our network learns structural similarities between PET and MR images and uses this information to assist the SR image recovery.
As illustrated in Figure 1, the first GAN contains a generator G1 : LR → HR with three subnetworks. The subnetwork (G11) accepts as inputs the LR PET image, an HR MR image, and radial and axial location information. The subnetwork (G12) receives as input the output of the second last layer of the VDSR network (a 20-layer CNN architecture for SR), which plays the role of a fixed feature extractor. The VDSR network is separately trained using paired simulation data based on supervised learning. It receives the same input as G11. The outputs of G11 and G12 are concatenated and then fused through a third subnetwork G13, which produces the final SSSR image.
Figure 1:

GAN architecture for SR imaging with patch-level multi-channel inputs (LR PET, HR MR, and radial and axial location details for voxels) which outputs an SR PET image patch.
Since the VDSR network is trained using only simulation data, its output for clinical data inputs is expected to be artifact-ridden. Utilizing the output of this 20-layer CNN’s penultimate layer (a higher-dimensional feature set) instead of its final image as an auxiliary input to the SSSR network ensures more effective information capture. Additionally, while the SSSR network utilizes information derived from the imperfect VDSR network, it uses this in conjunction with features derived directly from the clinical data.
The discriminator D1 verifies the SR output () by comparing it with an unpaired HR image sample (). Similar to the CycleGAN architecture, the SR image is mapped back to the LR domain using a second generator G2 : HR → LR. A second discriminator D2 verifies this blurry image, denoted in Figure 1 as LR′ and mathematically as , by comparing it with the original LR image, . G2 is pretrained using LR and HR simulation image pairs and spatial information, with the LR images generated by applying the measured spatially-variant point spread function (SVPSF) of the scanner [10] to the HR images.
While LR-to-HR mapping is an ill-posed problem, HR-to-LR mapping in PET involves a spatially-variant blurring operation that can be measured and modeled in either image or sinogram domains. As part of our previous work, we have modeled and measured the spatially-variant point spread function (SVPSF) for individual scanners [10]. We use this knowledge to guide the training of the generator G2. Though it is possible to entirely replace G2 with the SVPSF blurring operator. However, our experiments clearly suggested that despite the feasibility of the latter approach, using a generator neural network for LR-to-HR mapping offers distinct advantages. Specifically, G2 serves to do more than simple LR-to-HR mapping and provides additional features guidance to the overall network as will be demonstrated via comparisons with an alternative network where G2 is replaced by an SVPSF blurring operator. We consider G2 pretraining using domain-specific knowledge an additional contribution of this paper.
2.2. Loss Functions
The overall loss function for training the generator G1 includes two adversarial losses ( and ), a cycle consistency loss , and a total variation penalty .
Here λa, λc, and λt are hyperparameters. These loss functions are described below.
2.2.1. Adversarial Loss
The adversarial losses are utilized for marginal matching [31] and incentivize the generated images to obey empirical distributions in the source and target domains. We employed two adversarial losses ( and ) which were adopted from the Least Squares GAN [32]. These least-squares adversarial losses tend to be free of the vanishing gradient problem that often accompanies regular GANs with sigmoid cross-entropy loss functions. While training the generator G1, we express the adversarial loss functions as:
| (1) |
| (2) |
where and are the SSSR (synthetic HR) and blurry synthetic LR images respectively and c is the value that the generator sets for the discriminator to accept the SSSR images.
While training the discriminators D1 and D2, we express the adversarial loss functions as:
| (3) |
| (4) |
where and are unpaired HR and LR PET images respectively, and a and b are the labels for the real ( and ) and fake ( and ) images respectively. It should be noted that the and are produced by the generator (hence considered “fake” in GAN terminology) while and belong to the datasets (and thus considered “real”).
For a least-squares loss function, the parameters, a, b, and c are selected such that the Pearson χ2 divergence between the probability distribution from the generator and the probability distribution from the data is minimized. Though these values are not uniquely determined, it has been shown [32] that they are constrained by the equations a−c = 1 and a−b = 2. In our work, we vary the range of a from 0.7 to 1.2, thus effectively constraining b and c.
2.2.2. Cycle Consistency Loss
The cycle consistency loss computes an L2-norm error in the LR domain. The cycle consistency loss is critical as previous works [33], [19] have found that the adversarial loss alone is insufficient to ensure that a learned function is able to transform an input source image to a target output image. The cycle consistency loss imposes shared latent space constraints and thus urges the source content to be preserved during cycle reconstruction mapping, i.e., . This loss is computed as:
| (5) |
2.2.3. Total Variation Penalty
The total variation loss has a denoising impact on image deblurring algorithms but with an edge preservation [34] effect and has been shown to alleviate conspicuous artifacts that may occur in GAN-synthesized images. The total variation penalty is computed as:
| (6) |
3. Methods
3.1. Network Architecture
The SSSR network is implemented and trained on PyTorch using an NVIDIA GTX 1080 Ti graphics card. In the generators G1 and G2, each convolutional layer, except for the last ones, is followed by a leaky rectified linear unit (ReLU). The subnetworks G11 and G12 have only 2 convolutional layers with their outputs concatenated and fused through the third subnetwork G13, which has 6 convolutional layers. A detailed representation of G1 and G2 is shown in Figure 2. The original VDSR network contains 20 convolutional layers. Each layer is followed by a leaky ReLU. The SSSR network removes the last layer and uses the output of the 19th layer from the VDSR network. D1 and D2 contain 9 convolutional and 3 fully-connected layers. Each convolutional layer is followed by a batch normalization layer (BN), a dropout layer (to prevent overfitting), and a leaky ReLU. Each fully-connected layer, except for the last one, is followed by a dropout layer and a leaky ReLU. To avoid sparse gradients, convolutional layers with stride 2 were adopted instead of using max-pooling layers [35]. A detailed representation of D1 and D2 is shown in Figure 3.
Figure 2:

Network architecture of G1 and G2. Each convolutional layer box shows the parameters in the format Conv(number of filters, filter size, stride, padding).
Figure 3:

Network architecture of D1 and D2. Each convolutional layer box shows the parameters in the format Conv(number of filters, filter size, stride, padding). In each fully-connected (FC) layer box, the only parameter is the number of filters.
3.2. Network Inputs
As mentioned in Section 2, the multi-channel input consists of an LR PET image, an HR MR image, and spatial (radial and axial) coordinates. We trained the SSSR network using 2D transverse patches from 3D brain images. To do this, we split the 3D images of size 192 × 192 × 128 × 4 into 128 192 × 192 × 4 slices (4 input channels). The input intensities were normalized into the range [0,1]. Data augmentation was achieved by randomly rotating the inputs by 1 to 360◦ and randomly cropping them to the size of 96 × 96 × 4.
3.3. Network Training
To compute the network weights, training was performed for 1000 epochs using the following sequential order: {G1,D1,D2}. The loss function for G1 was minimized by applying the Adam solver [36], while that for D1 and D2 was minimized using stochastic gradient descent. G1, D1, and D2 shared the same learning rate, which was set to 0.0002 and decreased by 1.5 × 10⁻⁷ at every epoch. The batch sizes of G1 and G2 were set to 10, and the batch sizes of D1 and D2 were set to 20.
3.4. Data Description
The SSSR network was trained using unpaired clinical LR and HR PET images. The HR PET images used are all based on the Siemens HRRT, a high-resolution dedicated brain PET scanner. The LR PET images corresponded to the Siemens ECAT EXACT HR+, an older but popular scanner model [37].
3.4.1. Clinical Data for SSSR Training and Validation
A total of 30 HRRT scans were obtained from the ADNI database (http://adni.loni.usc.edu/), of which 18 were used for training the SSSR network, while the remaining 12 were used for validation. The size of all HRRT PET images used were 192 × 192 × 128.
Similar to CycleGAN, the training data were equally split into two new training datasets. Each of the two training datasets had 9 subjects, while the validation dataset had 12 subjects. For the HR PET image samples, the 30 HRRT scans were all smoothed by a 2.4 mm full width at half maximum (FWHM) Gaussian filter. The LR PET images were computed by blurring the HRRT scans by the HR+ spatially-variant PSF measured in the image domain by placing point sources at multiple radial and axial locations inside the scanner bore [10]. G1 was trained using the LR images from the first training dataset. D1 was trained using the HR images from the second training dataset and the SR images that G1 generated. D2 was trained with the LR images from the first training dataset and the synthetic LR (LR’) images generated by G2. For validation, G1 was tested using the paired LR and HR images from the validation dataset.
3.4.2. Simulation Data for VDSR and G2 Pretraining
The VDSR and G2 networks were pretrained using paired, simulated LR and HR PET images. While VDSR performs LR-to-HR mapping, G2 performs the reverse (HR-to-LR) mapping. The input and target image sets were therefore distinct for training the two networks. All pretraining was based on the BrainWeb digital phantom (http://brainweb.bic.mni.mcgill.ca/brainweb/). 20 distinct human brain atlases were used to generate a set of simulated HR PET images, one of which is shown in Figure 4. Further details on the simulations may be found in our previous publication [16]. The geometric models of the HRRT and HR+ scanners were used to generate sinograms, which were corrupted by Poisson noise. Image reconstruction was performed using ordered subsets expectation maximization (OSEM). The HRRT reconstruction results were smoothed using a 2.4 mm FWHM Gaussian filter to generate the HR PET images. The reconstructed HR+ PET images were blurred using the spatially-variant HR+ PSF to generate the LR PET images. These paired images along with spatial and anatomical inputs were then used for VDSR and G2 pretraining.
Figure 4:

Transverse image slices from one of the 20 BrainWeb digital phantoms showing: A) HR PET, B) LR PET, C) HR MR, D) SR PET from the VDSR network.
4. Results
4.1. Reference Approaches
To evaluate the proposed SSSR framework, we compared the performance of the following techniques, which span partial volume correction, penalized deconvolution, supervised SR, and SSSR (multiple variants):
- Region-based voxel-wise (RBV) correction: The RBV technique [6] is a voxel-based extension of the popular geometric transfer matrix (GTM) method [4], a popular partial volume correction technique used in PET. It computes the corrected image from an upsampled blurry image of the same size, as follows:
Here is the approximate, spatially-invariant PSF, ⊙ and ⊘ represent Hadamard (entrywise) multiplication and division respectively, ⊗ represents 3D convolution, NROI = 2 represents the two gray and white matter anatomical regions-of interest (ROIs), pi is a binary mask for the ith ROI (pij = 1 if voxel j belongs to ROI i, 0 otherwise), and gi is the GTM-corrected intensity for the ith ROI[4].(7) - Spatially-variant deconvolution with a total variation (TV) penalty: For an unknown SR PET image vectorized as and a scanner-reconstructed LR PET image , the least-squares cost function for data fidelity is:
Here N and n are the respective numbers of voxels in the SR/HR and LR images and represents a blurring and downsampling operation based on the measured spatially-variant PSF of the scanner [10]. The two deconvolution techniques used as reference in this paper seek to minimize a composite cost function, ΦPSF + βΦreg, where β is a regularization parameter and Φreg is a regularization penalty function. The TV penalty is defined as:(8)
where Δk (k = 1,2, or 3) are finite difference operators along the three Cartesian coordinate directions [10].(9) - Spatially-variant deconvolution with an MR-based joint entropy (JE) penalty: This uses the deconvolution framework in (8). Given an HR MR image, denoted by a vector , the JE penalty is defined as [10]:
Here and are intensity histogram vectors based on the PET and MR images respectively and M is the number of intensity bins [10].(10) VDSR: This is a previously validated, CNN-based SR model that is trained in a supervised manner with paired training samples [16]. The model is a modified version on the VDSR network [14] with anatomical and spatial inputs supplementing the LR PET input channel.
Lin et al. [18]: This is a state-of-the-art SR technique that uses unpaired training samples like our method but developed for and validated on natural images. Our initial experiments with this approach showed poor performance of this method in its original, unmodified form which uses a Lanczos kernel for HR-to-LR mapping. To make it more competitive and to ensure a fair comparison, we made two major changes to this technique: (1) we replaced the inbuilt Lanczos interpolation step by our pretrained generator network G2 for HR-to-LR mapping and (2) we used 4-channel inputs similar to the proposed method.
SSSR network with SVPSF used for HR-to-LR mapping (SSSR-SVPSF): This variant of the proposed SSSR approach was implemented so as to be able to assess the contribution of using a pretrained generator G2 for HR-to-LR mapping. The SSSR-SVPSF network is similar to the proposed SSSR network but with G2 replaced by a spatially-variant 2D convolution step based on the measured image-domain SVPSF of the PET scanner [10].
SSSR without simulation guidance (SSSR-NoSim): This variant of the proposed SSSR approach was implemented so as to be able to assess the contribution of simulation guidance to overall SR performance. This SSSR-NoSim network is similar to the proposed SSSR network but lacks the extra inputs based on the simulation-based VDSR network.
SSSR network with simulation guidance (SSSR-Sim): This is the proposed SSSR network that features additional inputs from a VDSR network separately trained using simulation data generated using the BrainWeb phantom.
4.2. Evaluation Metrics
Conventional metrics for image-quality assessment rely on the knowledge of the “ground truth” used as a reference. This could be pose challenges for medical applications, particularly for self-supervised scenarios, where the ground truth may not be available for the validation dataset. To evaluate the SSSR technique, we therefore uses a mix of reference-based metrics and reference-free metrics described below:
4.2.1. Reference-Based Evaluation
We assess the image quality of the super-resolved PET images via two conventional and popular metrics in image processing and computed vision, namely the peak signal-to-noise ratio (PSNR) and the structural similarity index (SSIM). In the metric definitions provided below, we denote the true and estimated images as x and respectively. We use the notation μx and σx respectively for the mean and standard deviation of x. The PSNR is the ratio of the maximum signal power to noise power and is defined as:
| (11) |
where the root-mean-square error (RMSE) is defined as:
| (12) |
The SSIM is a well-accepted measure of perceived image quality and is defined as:
| (13) |
Here c1 and c2 are parameters stabilizing the division operation.
4.2.2. Reference-Free Evaluation
As the rationale for constructing an SSSR methodology is the dearth of available reference ground-truth images, we also evaluate SR images via two reference-free metrics. The first of these is the contrast-to-noise ratio (CNR), a widely used figure-of-merit for PET image quality assessment. The CNR for a target ROI and a reference ROI is defined as:
| (14) |
In this work, the gray matter ROI is treated as the target and the white matter ROI as the reference.
In addition, we employed a second reference-free metric for SR images (NRM-SR) which was specifically developed for SR image evaluation with the intent of detecting potential SR-based artifacts [38]. NRM-SR exploits three statistical features to quantify artifacts and evaluate the quality of SR images. These features capture local and global frequency as well as spatial frequency features. The features are then modeled on independent regression forests and regressed on perceptual scores to predict SR image quality.
4.3. Performance Comparison
Figure 5 and Figure 6 show transverse slices and corresponding magnified areas of these slices derived from the HR MR, LR PET, HR PET, and the outputs of the eight methods described in Section 4.1. The PSNR, SSIM, CNR, and NRM-SR, which are the quantitative figures-of-merit used in this study, are presented in Table 1.
Figure 5:

Transverse image slices from a human subject showing: A) HR MR, B) LR PET, C) HR PET, D) RBV, E) TV, F) JE, G) VDSR, H) Lin et al. [18], I) SSSR-SVPSF (G2 replaced by SVPSF), J) SSSR-NoSim (no simulation guidance), and K) SSSR-Sim (the proposed method with simulation guidance). The red box in the MR image indicates the region that is magnified for closer inspection in Figure 6.
Figure 6:
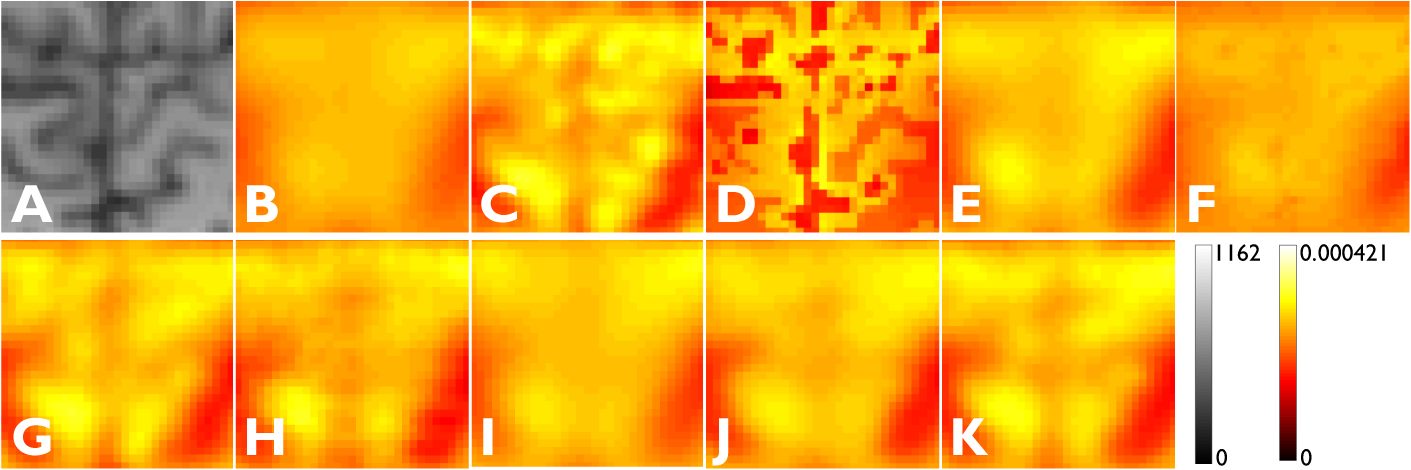
Magnified subimages corresponding to the red box shown in Figure 5: A) HR MR, B) LR PET, C) HR PET, D) RBV, E) TV, F) JE, G) VDSR, H) Lin et al. [18], I) SSSR-SVPSF (G2 replaced by SVPSF), J) SSSR-NoSim (no simulation guidance), and K) SSSR-Sim (the proposed method with simulation guidance).
Table 1:
Comparison of different SR imaging methods for PET
| Metric | LR | HR | RBV | TV | JE | VDSR | Lin et al. [18] | SSSR-SVPSF | SSSR-NoSim | SSSR-Sim |
|---|---|---|---|---|---|---|---|---|---|---|
| PSNR | 29.65 | ∞ | 30.52 | 33.26 | 33.47 | 37.21 | 34.13 | 34.17 | 34.70 | 35.57 |
| SSIM | 0.873 | 1.000 | 0.712 | 0.915 | 0.917 | 0.961 | 0.931 | 0.926 | 0.933 | 0.941 |
| CNR | 0.154 | 0.455 | 0.236 | 0.262 | 0.238 | 0.405 | 0.306 | 0.299 | 0.302 | 0.341 |
| NRM-SR | 2.302 | 2.676 | 2.6693 | 2.449 | 2.616 | 2.743 | 2.581 | 2.547 | 2.553 | 2.642 |
As expected, VDSR, a supervised technique, steadily outperformed all methods from the self-supervised family. The latter approaches, however, exhibited substantial improvement over classical deblurring and partial volume correction not only in terms of image quality but also in terms of quantitation via the reference-based metrics PSNR and SSIM. Within the self-supervised family of methods tested (including all SSSR variants and Lin et al. [18]), SSSR-Sim is visually the sharpest and also leads to higher PSNR and SSIM. Of note are its clear qualitative and quantitative advantages over the variants SSSR-SVPSF and SSSR-NoSim. This clearly indicates that the incorporation of simulation-based VDSR features and G2 pretraining greatly increase the proposed network’s accuracy. Overall, among the self-supervised family of methods, Lin et al. [18] and SSSR-SVPSF exhibited comparable performance. SSSR-NoSim is a more competitive approach than Lin et al. [18] and SSSR-SVPSF, while SSSR-Sim is the clear winner in the self-supervised category.
Among the reference-free metrics, CNR leads to relative performance trends across all the compared methods that are broadly similar to the PSNR trends. NRM-SR, however, is less predictable. While it suggests the strongest performance for VDSR, RBV, JE, and SSSR-Sim are close contenders for second place. This can be attributed to the fact that the NRM-SR measure is higher for methods that more effectively incorporate anatomical information. While all other metrics seem to suggest that network-based methods vastly outperform non-network-based ones, the NRM-SR outcome is an aberrant one. It should be noted that a reference-free metric such as NRM-SR is unconstrained by a reference image and may lead to the SR image earning a score higher than HR image as is the case with VDSR image.
5. Discussion
We have developed a self-supervised technique for super-resolving PET images which obviates the need for paired inputs for training and therefore promises wide practical utility. The method was validated using clinical data. While PSNR and SSIM are the predominantly used image quality assessment metrics for image processing and computer vision, these metrics are not always well-aligned with human perceptual assessment [39]. They tend to be sensitive to noise and thus perhaps are more suggestive of denoising performance than deblurring performance, the latter being our aim. As the rationale for designing a self-supervised methodology is the absence of ground-truth images, we extend the image quality assessment to include two reference-free metrics. Not unexpectedly, supervised learning using VDSR led to the best performance for all metrics. But our proposed algorithm SSSR-Sim was a clear winner among all classical and self-supervised approaches, including partial volume correction, penalized deconvolution, and a state-of-the-art SSSR technique developed for and validated on natural images. SR is particularly important for a functional/physiological imaging modality such as PET, for which the resolution limitations tend to be more severe than anatomical modalities such as MR or CT. The ability to generate SR images without paired training datasets makes our method particularly useful for clinical practice.
Self-supervised learning is a fundamentally difficult problem. A key characteristic of our network is the incorporation of high-dimensional features from a VDSR network trained using simulation data. To test the utility of this specific modification, we compared our network (SSSR-Sim) with a simpler network that does not use simulation-based features (SSSR-NoSim). The latter resembles the CycleGAN architecture. Our results show that the simulation-based features are vital for ensuring high performance in self-supervised mode. Simulation guidance to achieve SR is, therefore, an important contribution of this work.
Another distinctive feature of the proposed method is LR-to-HR mapping via generator pretraining using simulation data prepared via blurring with the measured SVPSF of the PET scanner. To determine the relative efficacy of a generator network over a classical blurring operator, we compared our network (SSSR-Sim) with a similar network that replaces the generator G2 by SVPSF blurring (SSSR-SVPSF). Our results show that the pretrained generator serves to do more than simple LR-to-HR mapping and provides additional features guidance to the overall network. G2 pretraining using domain-specific knowledge is therefore yet another important and novel contribution of this paper.
Our evaluations using the reference-free metric NRM-SR led to an interesting outcome. Our results showed that methods like RBV and JE that rely heavily on MR guidance tend to benefit disproportionately and outperform several network-based methods when adjudicated via NRM-SR. This result is suggestive of the inadequacy of any single metric to adjudge specific algorithms and the need for designing clinically meaningful task-based metrics. The development of such a metric for SR PET imaging is our intended future task.
It should also be noted that the demonstrated SSSR performance is specific to inputs with noise and blur levels similar to those used in training. Our future work will characterize the performance of these networks when input noise levels are varied. Due to the computational overhead of training two GANs, we resorted to 2D convolutions instead of 3D, a scenario that is sub-optimal. Finally, this proof-of-concept study was based on a small cohort. As future work, we will perform more extensive validation using a larger dataset. Despite these limitations, given the fundamental need for self-supervised approaches while dealing with clinical datasets, we envision wide applicability of our method in the clinical domain.
6. Acknowledgments
This work was supported in part by the NIH grant K01AG050711.
References
- [1].Rahmim A, Qi J, Sossi V, Resolution modeling in PET imaging: theory, practice, benefits, and pitfalls, Med. Phys 40 (6) (2013) 064301. [DOI] [PMC free article] [PubMed] [Google Scholar]
- [2].Alessio AM, Kinahan PE, Lewellen TK, Modeling and incorporation of system response functions in 3-D whole body PET, IEEE Trans. Med. Imaging 25 (7) (2006) 828–837. [DOI] [PubMed] [Google Scholar]
- [3].Panin VY, Kehren F, Michel C, Casey M, Fully 3-D PET reconstruction with system matrix derived from point source measurements, IEEE Trans. Med. Imaging 25 (7) (2006) 907–921. [DOI] [PubMed] [Google Scholar]
- [4].Rousset OG, Ma Y, Evans AC, Correction for partial volume effects in PET: principle and validation, J. Nucl. Med 39 (5) (1998) 904–911. [PubMed] [Google Scholar]
- [5].Soret M, Bacharach SL, Buvat I, Partial-volume effect in PET tumor imaging, J. Nucl. Med 48 (6) (2007) 932–945. [DOI] [PubMed] [Google Scholar]
- [6].Thomas BA, Erlandsson K, Modat M, Thurfjell L, Vandenberghe R, Ourselin S, Hutton BF, The importance of appropriate partial volumecorrection for PET quantification in Alzheimer’s disease, Eur. J. Nucl. Med. Mol. Imaging 38 (6) (2011) 1104–1119. [DOI] [PubMed] [Google Scholar]
- [7].Boussion N, Cheze Le Rest C, Hatt M, Visvikis D, Incorporation of wavelet-based denoising in iterative deconvolution for partial volume correction in whole-body PET imaging, Eur. J. Nucl. Med. Mol. Imaging 36 (7) (2009) 1064–1075. [DOI] [PubMed] [Google Scholar]
- [8].Yan J, Lim JC, Townsend DW, MRI-guided brain PET image filtering and partial volume correction, Phys. Med. Biol 60 (3) (2015) 961–976. [DOI] [PubMed] [Google Scholar]
- [9].Song T-A, Chowdhury S, Kim K, Gong K, El Fakhri G, Li Q, Dutta J, Super-resolution PET using a very deep convolutional neural network, in: Proc. IEEE Nucl. Sci. Symp. Med. Imag. Conf, IEEE, 2018. [Google Scholar]
- [10].Song T-A, Yang F, Chowdhury S, Kim K, Johnson K, El Fakhri G, Li Q, Dutta J, PET image deblurring and super-resolution with an MR-based joint entropy prior, IEEE Trans. Comput. Imaging 5 (4) (2019) 530–539. [DOI] [PMC free article] [PubMed] [Google Scholar]
- [11].Dong C, Loy CC, He K, Tang X, Image super-resolution using deep convolutional networks, IEEE Trans. Pattern Anal. Mach. Intell 38 (2) (2016) 295–307. [DOI] [PubMed] [Google Scholar]
- [12].Dong C, Loy CC, Tang X, Accelerating the super-resolution convolutional neural network, in: Computer Vision - ECCV 2016, Vol. 9906, 2016, pp. 391–407. [Google Scholar]
- [13].Shi W, Caballero J, Huszár F, Totz J, Aitken AP, Bishop R, Rueckert D, Wang Z, Real-time single image and video super-resolution using an efficient sub-pixel convolutional neural network, Proc. IEEE Comput. Soc. Conf. Comput. Vis. Pattern Recognit (2016) 1874–1883. [Google Scholar]
- [14].Kim J, Kwon Lee J, Mu Lee K, Accurate image super-resolution using very deep convolutional networks, in: Proc. IEEE Comput. Soc. Conf. Comput. Vis. Pattern Recognit, 2016, pp. 1646–1654. [Google Scholar]
- [15].Dutta J, El Fakhri G, Zhu X, Li Q, PET point spread function modeling and image deblurring using a PET/MRI joint entropy prior, in: Proc. IEEE Int. Symp. Biomed. Imaging, IEEE, 2015, pp. 1423–1426. [Google Scholar]
- [16].Song T-A, Chowdhury S, Yang F, Dutta J, Super-resolution PET imaging using convolutional neural networks, IEEE Trans. Comput. Imaging 6 (1) (2020) 518–528. [DOI] [PMC free article] [PubMed] [Google Scholar]
- [17].Shocher A, Cohen N, Irani M, Zero-Shot Super-Resolution Using Deep Internal Learning, in: Proc. IEEE Comput. Soc. Conf. Comput. Vis. Pattern Recognit, 2018, pp. 3118–3126. [Google Scholar]
- [18].Lin G, Wu Q, Chen L, Qiu L, Wang X, Liu T, Chen X, Deep unsupervised learning for image super-resolution with generative adversarial network, Signal Process. Image Commun 68 (2018) 88–100. [Google Scholar]
- [19].Zhu J-Y, Park T, Isola P, Efros AA, Unpaired image-to-image translation using cycle-consistent adversarial networks, in: Proc. IEEE Int. Conf. Comput. Vis, 2017, pp. 2223–2232. [Google Scholar]
- [20].Yuan Y, Liu S, Zhang J, Zhang Y, Dong C, Lin L, Unsupervised image super-resolution using cycle-in-cycle generative adversarial networks, in: Proc. IEEE Comput. Soc. Conf. Comput. Vis. Pattern Recognit. Workshops, 2018, pp. 814–823. [Google Scholar]
- [21].Zhao T, Ren W, Zhang C, Ren D, Hu Q, Unsupervised degradation learning for single image super-resolution, CoRR abs/1812.04240 arXiv: 1812.04240. [Google Scholar]
- [22].Bulat A, Tzimiropoulos G, Super-FAN: Integrated facial landmark localization and super-resolution of real-world low resolution faces in arbitrary poses with GANs, in: Proc. IEEE Comput. Soc. Conf. Comput. Vis. Pattern Recognit, 2017, pp. 109–117. [Google Scholar]
- [23].Keys R, Cubic convolution interpolation for digital image processing, IEEE Trans. Acoust. Speech Signal Process 29 (6) (1981) 1153–1160. [Google Scholar]
- [24].Sun J, Xu Z, Shum H, Image super-resolution using gradient profile prior, Proc. IEEE Comput. Soc. Conf. Comput. Vis. Pattern Recognit (2008) 1–8. [Google Scholar]
- [25].Kim KI, Kwon Y, Single-image super-resolution using sparse regression and natural image prior, IEEE Trans. Pattern Anal. Mach. Intell 32 (6) (2010) 1127–1133. [DOI] [PubMed] [Google Scholar]
- [26].You C, Li G, Zhang Y, Zhang X, Shan H, Li M, Ju S, Zhao Z, Zhang Z, Cong W, et al. , CT super-resolution GAN constrained by the identical, residual, and cycle learning ensemble (GAN-CIRCLE), IEEE Trans. Med. Imaging 39 (1) (2020) 188–203. [DOI] [PMC free article] [PubMed] [Google Scholar]
- [27].Mahapatra D, Bozorgtabar B, Garnavi R, Image super-resolution using progressive generative adversarial networks for medical image analysis, Comput. Med. Imaging Graph 71 (2019) 30–39. [DOI] [PubMed] [Google Scholar]
- [28].Lu J, Liu W, Unsupervised super-resolution framework for medical ultrasound images using dilated convolutional neural networks, in: Proc. IEEE Int. Conf. Image Vis. Comput., IEEE, 2018, pp. 739–744. [Google Scholar]
- [29].Joshi A, Koeppe RA, Fessler JA, Reducing between scanner differences in multi-center PET studies, Neuroimage 46 (1) (2009) 154–159. [DOI] [PMC free article] [PubMed] [Google Scholar]
- [30].Cloquet C, Sureau FC, Defrise M, Van Simaeys G, Trotta N, Goldman S, Non-Gaussian space-variant resolution modelling for list-mode reconstruction, Phys. Med. Biol 55 (17) (2010) 5045–5066. [DOI] [PubMed] [Google Scholar]
- [31].Goodfellow I, Pouget-Abadie J, Mirza M, Xu B, Warde-Farley D, Ozair S, Courville A, Bengio Y, Generative adversarial nets, in: Ghahramani Z, Welling M, Cortes C, Lawrence ND, Weinberger KQ (Eds.), Adv. Neural Inf. Process. Syst, 2014, pp. 2672–2680. [Google Scholar]
- [32].Mao X, Li Q, Xie H, Lau RYK, Wang Z, Smolley SP, On the Effectiveness of Least Squares Generative Adversarial Networks, IEEE Trans. Pattern Anal. Mach. Intell 41 (2017) 2947–2960. [DOI] [PubMed] [Google Scholar]
- [33].Tzeng E, Hoffman J, Saenko K, Darrell T, Adversarial discriminative domain adaptation, in: Proc. IEEE Comput. Soc. Conf. Comput. Vis. Pattern Recognit, 2017, pp. 2962–2971. [Google Scholar]
- [34].Rudin LI, Osher S, Fatemi E, Nonlinear total variation based noise removal algorithms, Physica D 60 (1) (1992) 259–268. [Google Scholar]
- [35].Radford A, Metz L, Chintala S, Unsupervised representation learning with deep convolutional generative adversarial networks, arXiv preprint arXiv:1511.06434 [Google Scholar]
- [36].Kingma D, Ba J, Adam: A method for stochastic optimization, arXiv preprint arXiv:1412.6980 [Google Scholar]
- [37].van Velden FH, Kloet RW, van Berckel BN, Buijs FL, Luurtsema G, Lammertsma AA, Boellaard R, HRRT versus HR+ human brain PET studies: an interscanner test-retest study, J. Nucl. Med 50 (5) (2009) 693–702. [DOI] [PubMed] [Google Scholar]
- [38].Ma C, Yang C-Y, Yang X, Yang M-H, Learning a no-reference quality metric for single-image super-resolution, Comput. Vis. Image Underst 158 (2017) 1–16. [Google Scholar]
- [39].Zhang R, Isola P, Efros AA, Shechtman E, Wang O, The unreasonable effectiveness of deep features as a perceptual metric, Proc. IEEE Comput. Soc. Conf. Comput. Vis. Pattern Recognit (2018) 586–595. [Google Scholar]