Abstract
Streptozotocin treatment has emerged as an alternative model of sporadic Alzheimer’s disease (SAD). Streptozotocin-induced alterations in iron and calcium levels reflect magnetic susceptibility changes, while susceptibility distribution in the cerebral regions has not been reported yet. This study aimed to investigate susceptibility distribution in the limbic system after streptozotocin administration to cynomolgus monkeys for exploring informative SAD biomarkers. Quantitative susceptibility mapping (QSM) using 7T magnetic resonance imaging (MRI) was utilized to quantitatively compare the susceptibility distributions in monkeys with sporadic Alzheimer disease and age-matched healthy controls. Compared to healthy controls, overall susceptibility values differed in the SAD models. Notable substantial susceptibility changes were observed in the hypothalamus with a 4.38-time decrease (AD: −47.45±12.19 ppb, healthy controls: 14.02±9.51 ppb) and in the posterior parts of the corpus callosum with a 2.83-times increase (AD: 31.49±15.90 ppb; healthy controls: 11.13±4.02 ppb). These susceptibility alterations may reflect neuronal death, and could serve as key biomarkers in the SAD. These results may be useful for specifying AD pathologies such as cognitive and non-cognitive symptoms.
Keywords: Alzheimer’s disease (AD), quantitative susceptibility mapping (QSM), streptozotocin, ultra-high field, magnetic resonance imaging (MRI)
Introduction
Sporadic Alzheimer’s disease (SAD) comprises the majority of Alzheimer’s disease (AD) cases with approximately 90% of the total AD population and represents late-onset AD in patients over 65 years of age (1). The etiology of this disease, which differs from that of the hereditary form, involves multifactorial factors consisting of both the presence of the apolipoprotein E gene and environmental exposure (1); thus, the understanding of the AD pathogenesis remains incomplete. Streptozotocin (STZ)-treated animal models have been emerging as an alternative for interpreting SAD (2,3). Models based on STZ administration and human AD have comparable symptoms such as neuronal loss, oxidative stress, excessive iron deposition, and glucose hypometabolism (3-6). However, the deleterious STZ effects in the brain are mostly confined to the hippocampus or cerebral cortex (5,7), whereas the advent of AD is closely associated with dysfunction of the limbic system (LS) that causes structural and metabolic changes (6,8-13). Therefore, disorders in the LS induced by STZ administration should be investigated to better reveal the correlation of this model with human AD pathology.
STZ administration increases iron and calcium depositions in specific brain regions, such as the hippocampus and cerebral cortex (5,7). The increased iron and calcium levels have been suggested to be early key AD biomarkers that differentiate AD patients from healthy volunteers (1,10,12,14). However, most studies in STZ-treated animals have focused on immunochemical analyses to show the presence of iron and calcium depositions. The STZ-induced alterations in iron and calcium levels reflect magnetic susceptibility changes, while the susceptibility distribution in the LS has not been reported in this model yet. Quantitative susceptibility mapping (QSM) is a useful method to detect susceptibility changes in cerebral regions (15). QSM has been used to determine susceptibility distributions with high accuracy (15,16) and has produced better results to identify cerebral region abnormalities at early AD stages than grey matter volume measurements (10). Additionally, an ultra-high-field magnetic resonance imaging (MRI) can measure even subtle susceptibility changes since the sensitivity of the magnetic susceptibility detection is directly proportional to the magnetic field strength of the MRI (16). Hence, the application of QSM at 7T MRI in STZ-treated animals may provide meaningful information about SAD by directly measuring biomolecular changes.
Non-human primate experiments have played pivotal roles for neurological disorders such as AD and Parkinson's disease because of the similarities of these animals with humans in genetic, morphological, and physiological aspects (17). STZ administration to experimental animals causes AD symptoms that resemble those in the human brain, especially excessive iron and calcium accumulations (2,3,5), which have been found in STZ-treated monkeys with amyloid-beta accumulations and tauopathy through immunohistochemistry (7). This leads to significant magnetic susceptibility alterations, suggesting as an early biomarker for AD diagnosis (10,12). Using QSM, magnetic susceptibility properties in the brain are differentiated between the calcium formation with negative susceptibility and the iron accumulation with positive susceptibility (10,12,15). This study aimed to explore informative SAD biomarkers through QSM. Our findings showed susceptibility changes that substantially differ between healthy controls and STZ-treated animals, in specific regions of the LS.
Methods
Preparation of the AD model by STZ administration
Four age-matched cynomolgus monkeys (Macaca fascicularis) were chosen to quantitatively evaluate the magnetic susceptibility in the brain. The animals were classified into the following groups: healthy (n=2) and STZ-treated monkeys (n=2). All procedures were approved by the Institutional Animal Care and Use Committee of the Korea Research Institute of Bioscience and Biotechnology (Approval No. KRIBB-AEC-14018).
MRI acquisitions
All animals were scanned using a whole-body 7T MRI (Achieva, Philips, Best, Netherlands) with a 32-channel phased-array head coil (Nova Medical, MA, USA). The monkeys were initially anesthetized with ketamine (0.5 mg/kg, intramuscular injection), followed by maintenance with 2% isoflurane and 99.9% oxygen (2 L/min) during the examination. To maintain their body temperature, they were covered with a blanket, and the pulse was consistently monitored using a peripheral gating instrument. For the QSM, three-dimensional (3D) multi-gradient echo was acquired with flow compensation. The scan parameters of the multi-gradient echo were as follows: TR =90 ms, echo time (TE) =4.6/9.0/13.4/17.8 ms, number of echoes =4, FOV = (100×100×52) mm3, voxel size = (0.297×0.297×1) mm3, slab thickness =52 mm (whole-brain coverage with the axial planes), flip angle =22 degrees, water-fat shift = 1.78 Hz/pixel, number of averages =2, and total acquisition time =49 min 33 s. To generate mask images for QSM, 3D T1-weighted (T1w) images were also acquired with the following conditions: TR =9 ms, TE =4.5 ms, inversion time =1,200 ms, FOV = (100×100×52) mm3, voxel size = (0.297×0.297×1) mm3, slab thickness =52 mm, flip angle =6 degrees, water-fat shift =4.68 Hz/pixel, number of averages =10, and total acquisition time =26 min 58 s.
Reconstruction and registration of susceptibility values
The QSM values were reconstructed using the software package STI Suite (18). This reconstruction process consisted of the following three steps: (I) Laplacian phase unwrapping, (II) iterative harmonic phase removal using the Laplacian operator (iHARPERELLA) for background phase removal, and (III) least-square orthogonal and right-triangular decomposition (LSQR) for field-to-susceptibility inversion. Mask images for background removal were generated using the automated brain extraction tool which is one of the Oxford Centre for Functional MRI of the Brain software libraries (FSL, http://www.fmrib.ox.ac.uk/fsl) (19). The mask images were eroded to include the cerebral parenchyma only using MATLAB (MathWorks, MA, USA). A templated primate brain, INIA19 and NeuroMap (20), was employed to consistently measure the susceptibility values in identical regions of all animals. The reconstructed QSMs and the T1w images were registered to the primate brain atlases using 3D Slicer (https://www.slicer.org/) (21). Finally, the susceptibility values in the cerebral regions of the LS (i.e., hippocampus, thalamus, hypothalamus, cingulate gyrus, and corpus callosum) were averaged within each region. The susceptibility values in STZ-treated AD animals were quantified as mean and standard deviation and compared to those of the healthy controls (HC).
Results
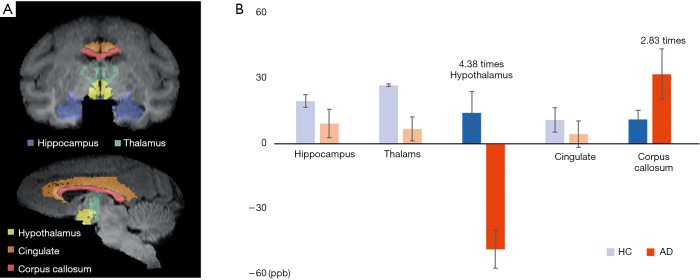
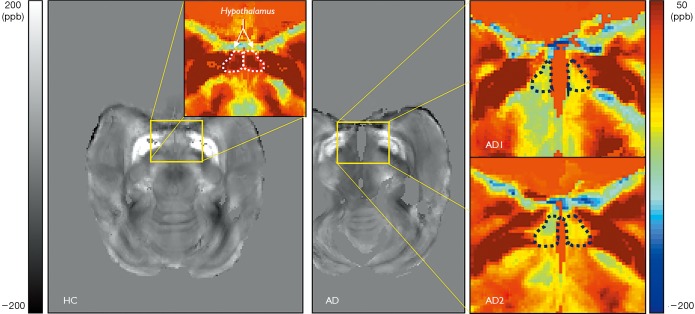
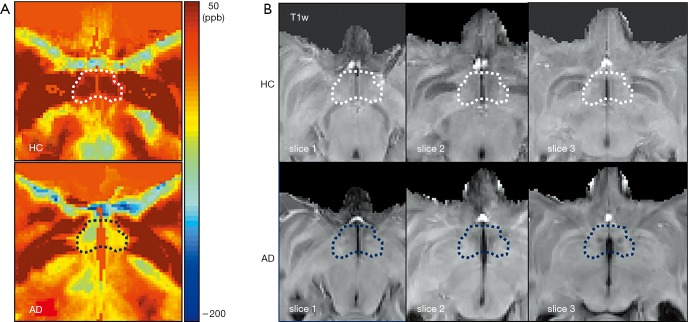
Using QSM, the susceptibility values were determined to compare magnetic susceptibilities in the LS of AD and HC animals. Overall, there were magnetic susceptibility differences in the AD and healthy control animals. Notable STZ-induced magnetic susceptibility changes were found in the hypothalamus and corpus callosum (Figure 1). In the hypothalamus, the magnetic susceptibility in AD animals decreased substantially, by approximately 4.38 times, in comparison to the healthy controls (AD: −47.45±12.19 ppb; healthy controls: 14.02±9.51 ppb). Because alterations in QSM values indicate the sources that induce cytoskeletal damage and neuronal death (1,10,12), the hypothalamic changes were scrutinized with the color-coded QSM images and volumetric measurements using T1w images. The anatomical boundaries of the hypothalamus in the QSM color-map become unclear in AD models (Figure 2). The hypothalamic volume decreased by approximately 18% (AD: 142.39±21.92 mm3; healthy controls: 174.23±4.69 mm3), which was exhibited by dark spots due to decreased signal intensity in AD models (Figure 3). The anatomical atrophy in the AD is in good agreement with the previous studies (8,9).
Figure 1.
Intergroup differences of the averaged QSM values in the LS. (A) Masked images of the limbic regions using the templated primate brain (22) overlaid on T1-weighted images. The susceptibility within each region was averaged. (B) Substantial differences in susceptibility were observed in the hypothalamus (decreased by 11.5 times) and corpus callosum (increased by 4.4 times) of AD animals in comparison to HC. HC, healthy control; AD, Alzheimer’s disease; LS, limbic system; QSM, quantitative susceptibility mapping.
Figure 2.
Reconstructed QSM images performed on 7T MRI using 4-echo gradient echo sequences (GREs) in gray scale and the corresponding enlarged QSMs in color scale (yellow boxes). The hypothalamus of the HC appears in an almond shape (outlined by white dotted lines). In AD, the shape gets unclear (dark blue dotted lines), and the regional QSM values are decreased. QSM, quantitative susceptibility mapping; HC, healthy control; AD, Alzheimer’s disease.
Figure 3.
Comparison of the hypothalamus shape between quantitative susceptibility mapping and T1w images. (A) The boundary of the hypothalamus (dotted lines, white in HC, dark blue in AD) is less marked in AD compared to HC. (B) The hypothalamic region of AD models, especially on slices 2 and 3 (dark blue dotted lines), shows decreased signal intensity on T1w images compared to that of the HC. The ventricle size is slightly enlarged with AD. HC, healthy control; AD, Alzheimer’s disease; T1w, T1-weighted image.
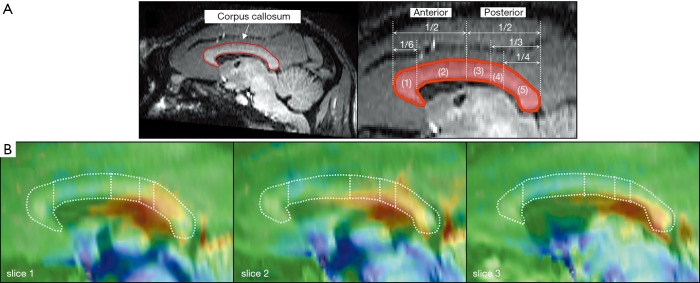
We found substantially increased susceptibility, approximately 2.83 times, in the corpus callosum of the AD model (AD: 31.49±15.90 ppb; healthy controls: 11.13±4.02 ppb). The corpus callosum can be divided into five subregions according to Hofer’s classification (22). The 3D QSM and T1w images were reformatted to the sagittal plane to find regions of abnormal iron accumulation, as well as to better visualize the corpus callosum region. Compared to HC, an excessive iron deposition was observed in the AD model in the posterior parts of the corpus callosum (Figure 4), which comprises the posterior body, isthmus, and splenium (Figure 5). This result agrees well with those of previous studies in terms of abnormal iron deposition in subregions of the corpus callosum (22-25). All magnetic susceptibilities in the LS are summarized in Table 1.
Figure 4.
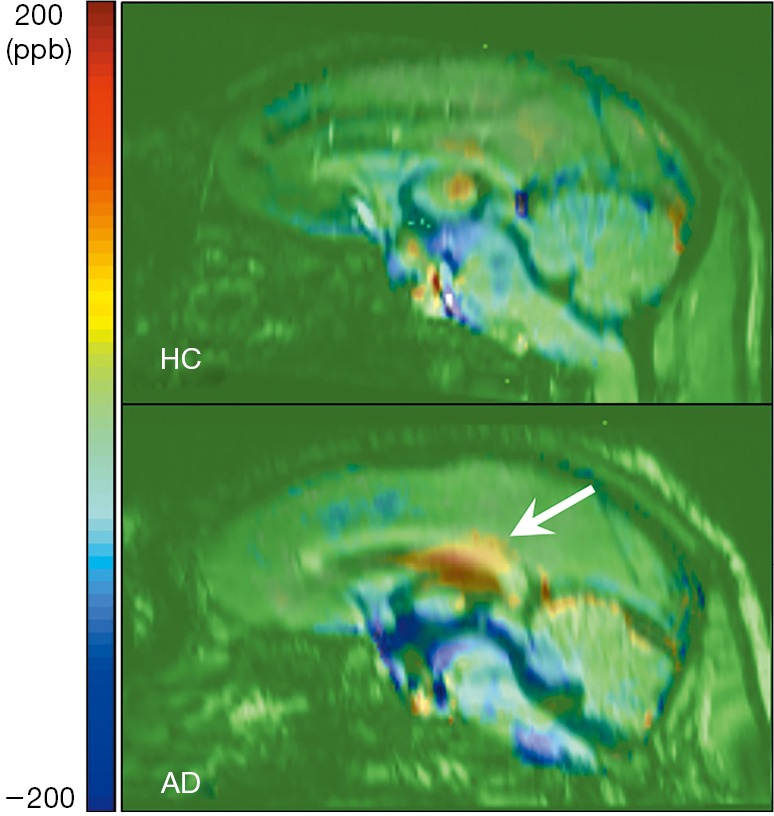
Sagittal quantitative susceptibility mapping images overlaid on T1-weighted images which were reformatted using the axial images. In AD, iron deposition in the posterior area of the corpus callosum is increased compared to HC (white arrow). HC, healthy control; AD, Alzheimer’s disease.
Figure 5.
Shape of the corpus callosum and susceptibility differences in AD versus healthy control. (A) The corpus callosum (red line) is divided into five subregions according to Hofer’s classification (22): [1] genu, [2] anterior body, [3] posterior body, [4] isthmus, and [5] splenium. (B) Quantitative susceptibility mapping images overlaid on T1-weighted images. In AD, the iron deposition in the posterior body of the corpus callosum (white dotted line) is increased compared to the healthy control. AD, Alzheimer’s disease.
Table 1. Averaged QSM values for each anatomical region of the limbic system (mean ± standard deviation).
| Anatomical regions | HC (ppb) | AD (ppb) |
|---|---|---|
| Hippocampus | 19.35±2.85 | 9.23±6.38 |
| Thalamus | 26.46±0.57 | 6.75±5.41 |
| Hypothalamus | 14.02±9.51 | −47.45±12.19 |
| Cingulate | 10.81±5.49 | 4.46±5.97 |
| Corpus callosum | 11.13±4.02 | 31.49±15.90 |
The hypothalamus exhibited a considerable decrease in negative susceptibility changes. The increased susceptibility was notable in the corpus callosum of those with AD. Magnetic susceptibility values are provided in parts per billion (ppb). HC, healthy controls; AD, Alzheimer’s disease.
Discussion
To the best of our knowledge, the present study is the first to measure magnetic susceptibility in STZ-treated animals using QSM on 7T MRI. Our findings reveal substantial susceptibility differences in specific brain regions of AD animals compared to HC, especially decreased susceptibility values in the hypothalamus and increased susceptibility levels in the posterior parts of the corpus callosum, including the posterior body, the isthmus, and the splenium. The negative susceptibility values in the hypothalamus may have been due to calcium accumulation caused by the STZ cytotoxicity-induced immune response. The increased susceptibility values in the corpus callosum may have been caused by excessive iron accumulation, which could be induced by degraded myelination related to oligodendrocyte abnormalities.
This study showed that in STZ-treated AD animals (I) the susceptibility was approximately 4.38 times lower than that in the HC, (II) the hypothalamic volume reduced by about 18% and with unclear anatomical boundary (Figure 3). This notable result implies the occurrence of calcium accumulation in response to excessive inflammation, suggesting that the negative susceptibility values could be a key marker for the assessment of early AD stages. For normal inflammatory process, calcium ions are transported to the intracellular space after antigen receptor stimulation (26). However, administration of infectious and exogenous substances amplifies calcium signaling, leading to excessive inflammatory response (27). The disturbance in calcium homeostasis leads to mitochondrial and endoplasmic reticulum stress mediated by reactive oxygen species, ultimately causing apoptosis (28). Excessive microglial activation, calcium accumulation, and cell loss have been observed in the hippocampus and cerebral cortex of STZ-treated rodents (5). Moreover, in human AD subjects with diabetes mellitus, calcium depositions have been found in the hippocampus and thalamus using QSM (12). These results support our findings and indicate that the decreased susceptibility changes in the hypothalamus could be a prodrome of AD pathology since assessments of AD-induced susceptibility changes using QSM have been considered to detect cerebral abnormalities than cerebral volume measurements (10). However, additional efforts using immunohistochemical methods are needed to identify the calcium depositions in the hypothalamus of non-human primates.
STZ-treated animals and individuals with AD have comparable pathological symptoms (2-7). Decreases in hypothalamic volume have been observed in previous human AD studies using MRI (8,9), which is consistent with observations in our study. The atrophy gradually develops 4–5 years before the onset of dementia (9). The time course of the symptom is fairly similar to that of glucose hypometabolism in the cerebrum (29), which is a well-known early symptom in AD (6). This has been consistently observed in STZ-injected monkeys regardless of the disease severity (6). Interestingly, the rapidly developing neuroinflammation considerably precedes glucose metabolism disorder (29). This implies that, in the hypothalamus, decreased susceptibility by calcium accumulation can be a valuable biomarker in the preclinical stages using a non-invasive approach. Conversely, the efficiency of glucose metabolism measurements using positron emission tomography (PET) with 18F-labeled fluoro-2-deoxyglucose (FDG) may be diminished for the diagnosis of early AD. This may be attributed to the advantages of a 7T MRI that increases the sensitivity to susceptibility changes, as well as the image resolution due to a superior signal-to-noise ratio (16). Although additional efforts are needed to ascertain the relationship between susceptibility changes in QSM and glucose homeostasis alterations in FDG-PET, a reduced fiber integrity in the hypothalamus was in AD patients positively correlated with changes in glucose metabolism in a multimodal study combining FDG-PET with diffusion tensor imaging (30). Therefore, the negative susceptibility in the hypothalamus may be useful as an important biomarker for pre-symptomatic AD diagnosis.
Another finding of the present study is that 2.83 times higher susceptibility values were observed in parts of the corpus callosum, which comprises the posterior body, the isthmus, and splenium (Figures 4,5). The highlighted regions in Figure 5 are in accordance with findings in previous studies using QSM and immunohistochemical staining for phosphorylated tau (22). The iron deposition affects oligodendrocyte functions by reducing gene expression and by increasing oxidative stress (31,32). The oligodendroglia disturbances lead to loss of myelin integrity, identified as vesicles containing degraded myelin in the corpus callosum of AD patients (33) and rodents (34). Several studies in AD patients (23,24) as well as in animal models of AD (25) found that the fractional anisotropy measured by diffusion tensor imaging is decreased in the corpus callosum. Furthermore, fully destroyed myelination has resulted in increased magnetic susceptibility more than zero in white matter lesions, which myelin and iron staining have proven to be iron accumulations (35). Moreover, abnormalities such as demyelination and oligodendrocyte loss have been found in the corpus callosum of AD rodents through immunohistochemistry staining (34). These results support the findings of the present study and indicate that iron overload in AD models could reflect neuronal impairments due to demyelination related to oligodendrocyte damage.
The deleterious effects of STZ administration on the LS presented with simultaneous positive and negative changes in magnetic susceptibility. These alterations may represent excessive iron and calcium depositions, which have been considered typical changes in AD hypotheses (1,14). Although calcium accumulation due to the neuroinflammatory response may occur before the iron depositions are triggered (29), further studies are needed to reveal the hypothesis that better explains SAD symptoms based on the following aspects: (I) increase the number of the SAD prototypes for statistical validation because the results of the present study are preliminary, (II) perform the longitudinal study of susceptibility changes using QSM in order to investigate the earlier biomarker for SAD between calcium and iron accumulation in STZ-treated monkeys, (III) identify the relationship between magnetic susceptibility and its cell formation using immunohistochemical analysis, (IV) perform a clinical trial in human subjects using the above biomarkers.
In conclusion, we investigated magnetic susceptibility changes in STZ-treated monkeys, an AD model, using QSM performed on 7T MRI. We observed substantially decreased and increased susceptibility levels in the hypothalamus and the corpus callosum, respectively. The substantial susceptibility alterations may represent neuronal damages, thus leading to cerebral dysfunction. Therefore, the assessment of negative and/or positive susceptibility changes using QSM on 7T MRI could help to specify Alzheimer’s pathologies such as cognitive or non-cognitive symptoms.
Acknowledgments
Funding: This research was supported by a National Research Council of Science & Technology (NST) grant of the Korean government (MSIP, No. CPS-18-02-KBSI) and by the Korea Basic Science Institute grant (T39240 and C010300).
Ethical Statement: All procedures were approved by the Institutional Animal Care and Use Committee of the Korea Research Institute of Bioscience and Biotechnology (Approval No. KRIBB-AEC-14018).
Open Access Statement: This is an Open Access article distributed in accordance with the Creative Commons Attribution-NonCommercial-NoDerivs 4.0 International License (CC BY-NC-ND 4.0), which permits the non-commercial replication and distribution of the article with the strict proviso that no changes or edits are made and the original work is properly cited (including links to both the formal publication through the relevant DOI and the license). See: https://creativecommons.org/licenses/by-nc-nd/4.0/.
Footnotes
Conflicts of Interest: The authors have no conflicts of interest to declare.
References
- 1.Dorszewska J, Prendecki M, Oczkowska A, Dezor M, Kozubski W. Molecular Basis of Familial and Sporadic Alzheimer's Disease. Curr Alzheimer Res 2016;13:952-63. 10.2174/1567205013666160314150501 [DOI] [PubMed] [Google Scholar]
- 2.Grieb P. Intracerebroventricular streptozotocin injections as a model of Alzheimer’s disease: in search of a relevant mechanism. Mol Neurobiol 2016;53:1741-52. 10.1007/s12035-015-9132-3 [DOI] [PMC free article] [PubMed] [Google Scholar]
- 3.Kamat PK, Kalani A, Rai S, Tota SK, Kumar A, Ahmad AS. Streptozotocin intracerebroventricular-induced neurotoxicity and brain insulin resistance: A therapeutic intervention for treatment of sporadic Alzheimer’s disease (sAD)-like pathology. Mol Neurobiol 2016;53:4548-62. 10.1007/s12035-015-9384-y [DOI] [PubMed] [Google Scholar]
- 4.Bathina S, Srinivas N, Das UN. Streptozotocin produces oxidative stress, inflammation and decreases BDNF concentrations to induce apoptosis of RIN5F cells and type 2 diabetes mellitus in Wistar rats. Biochem Biophys Res Commun 2017;486:406-13. 10.1016/j.bbrc.2017.03.054 [DOI] [PubMed] [Google Scholar]
- 5.Biswas J, Gupta S, Verma DK, Gupta P, Singh A, Tiwari S, Goswami P, Sharma S, Singh S. Involvement of glucose related energy crisis and endoplasmic reticulum stress: Insinuation of streptozotocin induced Alzheimer's like pathology. Cell Signal 2018;42:211-26. 10.1016/j.cellsig.2017.10.018 [DOI] [PubMed] [Google Scholar]
- 6.Heo JH, Lee SR, Lee ST, Lee KM, Oh JH, Jang DP, Chang KT, Cho ZH. Spatial distribution of glucose hypometabolism induced by intracerebroventricular streptozotocin in monkeys. J Alzheimers Dis 2011;25:517-23. 10.3233/JAD-2011-102079 [DOI] [PubMed] [Google Scholar]
- 7.Yeo HG, Lee Y, Jeon CY, Jeong KJ, Jin YB, Kang P, Kim SU, Kim JS, Huh JW, Kim YH. Characterization of cerebral damage in a monkey model of Alzheimer’s disease induced by intracerebroventricular injection of streptozotocin. J Alzheimers Dis 2015;46:989-1005. 10.3233/JAD-143222 [DOI] [PubMed] [Google Scholar]
- 8.Callen DJ, Black SE, Caldwell CB, Grady CL. The influence of sex on limbic volume and perfusion in AD. Neurobiol Aging 2004;25:761-70. 10.1016/j.neurobiolaging.2003.08.011 [DOI] [PubMed] [Google Scholar]
- 9.Hall AM, Moore RY, Lopez OL, Kuller L, Becker JT. Basal forebrain atrophy is a presymptomatic marker for Alzheimer's disease. Alzheimers Dement 2008;4:271-9. 10.1016/j.jalz.2008.04.005 [DOI] [PMC free article] [PubMed] [Google Scholar]
- 10.Kim HG, Park S, Rhee HY, Lee KM, Ryu CW, Rhee SJ, Lee SY, Wang Y, Jahng GH. Quantitative susceptibility mapping to evaluate the early stage of Alzheimer's disease. Neuroimage Clin 2017;16:429-38. 10.1016/j.nicl.2017.08.019 [DOI] [PMC free article] [PubMed] [Google Scholar]
- 11.Li X, Wang H, Tian Y, Zhou S, Li X, Wang K, Yu Y. Impaired White Matter Connections of the Limbic System Networks Associated with Impaired Emotional Memory in Alzheimer's Disease. Front Aging Neurosci 2016;8:250. 10.3389/fnagi.2016.00250 [DOI] [PMC free article] [PubMed] [Google Scholar]
- 12.Park M, Moon WJ, Moon Y, Choi JW, Han SH, Wang Y. Region-specific susceptibility change in cognitively impaired patients with diabetes mellitus. PLoS One 2018;13:e0205797. 10.1371/journal.pone.0205797 [DOI] [PMC free article] [PubMed] [Google Scholar]
- 13.Pini L, Pievani M, Bocchetta M, Altomare D, Bosco P, Cavedo E, Galluzzi S, Marizzoni M, Frisoni GB. Brain atrophy in Alzheimer's Disease and aging. Ageing Res Rev 2016;30:25-48. 10.1016/j.arr.2016.01.002 [DOI] [PubMed] [Google Scholar]
- 14.Alzheimer's Association Calcium Hypothesis Workgroup Calcium Hypothesis of Alzheimer's disease and brain aging: A framework for integrating new evidence into a comprehensive theory of pathogenesis. Alzheimers Dement 2017;13:178-82.e17. 10.1016/j.jalz.2016.12.006 [DOI] [PubMed] [Google Scholar]
- 15.Wang Y, Liu T. Quantitative susceptibility mapping (QSM): decoding MRI data for a tissue magnetic biomarker. Magn Reson Med 2015;73:82-101. 10.1002/mrm.25358 [DOI] [PMC free article] [PubMed] [Google Scholar]
- 16.van der Zwaag W, Schafer A, Marques JP, Turner R, Trampel R. Recent applications of UHF-MRI in the study of human brain function and structure: a review. NMR Biomed 2016;29:1274-88. 10.1002/nbm.3275 [DOI] [PubMed] [Google Scholar]
- 17.Emborg ME. Nonhuman Primate Models of Neurodegenerative Disorders. ILAR J 2017;58:190-201. 10.1093/ilar/ilx021 [DOI] [PMC free article] [PubMed] [Google Scholar]
- 18.Li W, Avram AV, Wu B, Xiao X, Liu C. Integrated Laplacian-based phase unwrapping and background phase removal for quantitative susceptibility mapping. NMR Biomed 2014;27:219-27. 10.1002/nbm.3056 [DOI] [PMC free article] [PubMed] [Google Scholar]
- 19.Jenkinson M, Beckmann CF, Behrens TE, Woolrich MW, Smith SM. FSL. Neuroimage 2012;62:782-90. 10.1016/j.neuroimage.2011.09.015 [DOI] [PubMed] [Google Scholar]
- 20.Rohlfing T, Kroenke CD, Sullivan EV, Dubach MF, Bowden DM, Grant K, Pfefferbaum A. The INIA19 template and NeuroMaps atlas for primate brain image parcellation and spatial normalization. Front Neuroinform 2012;6:27. 10.3389/fninf.2012.00027 [DOI] [PMC free article] [PubMed] [Google Scholar]
- 21.Fedorov A, Beichel R, Kalpathy-Cramer J, Finet J, Fillion-Robin JC, Pujol S, Bauer C, Jennings D, Fennessy F, Sonka M. 3D Slicer as an image computing platform for the Quantitative Imaging Network. Magn Reson Imaging 2012;30:1323-41. 10.1016/j.mri.2012.05.001 [DOI] [PMC free article] [PubMed] [Google Scholar]
- 22.O'Callaghan J, Holmes H, Powell N, Wells JA, Ismail O, Harrison IF, Siow B, Johnson R, Ahmed Z, Fisher A, Meftah S, O'Neill MJ, Murray TK, Collins EC, Shmueli K, Lythgoe MF. Tissue magnetic susceptibility mapping as a marker of tau pathology in Alzheimer's disease. Neuroimage 2017;159:334-45. 10.1016/j.neuroimage.2017.08.003 [DOI] [PMC free article] [PubMed] [Google Scholar]
- 23.Choe BY, Seoung YH, Kim HM, Cho SB, Hong SW, Kim HG, Woo DC. Evaluation of the Corpus Callosum of Patient with Alzheimer s Disease by Using Magnetic Resonance Diffusion Tensor Imaging. J Korean Phys Soc 2010;57:1257-62. 10.3938/jkps.57.1257 [DOI] [Google Scholar]
- 24.Demey I, Ventrice F, Rojas G, Somale V, Zubiri V. Alzheimer’s disease dementia involves the corpus callosum and the cingulum: A diffusion tensor imaging study. Neurology 2015. DOI: https://doi.org/. 10.1016/j.jalz.2015.06.368 [DOI] [Google Scholar]
- 25.Sahara N, Perez PD, Lin WL, Dickson DW, Ren Y, Zeng H, Lewis J, Febo M. Age-related decline in white matter integrity in a mouse model of tauopathy: an in vivo diffusion tensor magnetic resonance imaging study. Neurobiol Aging 2014;35:1364-74. 10.1016/j.neurobiolaging.2013.12.009 [DOI] [PMC free article] [PubMed] [Google Scholar]
- 26.Feske S. Calcium signalling in lymphocyte activation and disease. Nat Rev Immunol 2007;7:690-702. 10.1038/nri2152 [DOI] [PubMed] [Google Scholar]
- 27.Ribeiro CMP. The role of intracellular calcium signals in inflammatory responses of polarised cystic fibrosis human airway epithelia. Drugs R D 2006;7:17-31. 10.2165/00126839-200607010-00002 [DOI] [PubMed] [Google Scholar]
- 28.Görlach A, Bertram K, Hudecova S, Krizanova O. Calcium and ROS: A mutual interplay. Redox Biol 2015;6:260-71. 10.1016/j.redox.2015.08.010 [DOI] [PMC free article] [PubMed] [Google Scholar]
- 29.Calsolaro V, Edison P. Neuroinflammation in Alzheimer's disease: current evidence and future directions. Alzheimers Dement 2016;12:719-32. 10.1016/j.jalz.2016.02.010 [DOI] [PubMed] [Google Scholar]
- 30.Cross DJ, Anzai Y, Petrie EC, Martin N, Richards TL, Maravilla KR, Peskind ER, Minoshima S. Loss of olfactory tract integrity affects cortical metabolism in the brain and olfactory regions in aging and mild cognitive impairment. J Nucl Med 2013;54:1278-84. 10.2967/jnumed.112.116558 [DOI] [PMC free article] [PubMed] [Google Scholar]
- 31.Heidari M, Johnstone DM, Bassett B, Graham RM, Chua AC, House MJ, Collingwood JF, Bettencourt C, Houlden H, Ryten M, Olynyk JK, Trinder D, Milward EA. Brain iron accumulation affects myelin-related molecular systems implicated in a rare neurogenetic disease family with neuropsychiatric features. Mol Psychiatry 2016;21:1599-607. 10.1038/mp.2015.192 [DOI] [PMC free article] [PubMed] [Google Scholar]
- 32.Nasrabady SE, Rizvi B, Goldman JE, Brickman AM. White matter changes in Alzheimer’s disease: a focus on myelin and oligodendrocytes. Acta Neuropathol Commun 2018;6:22. 10.1186/s40478-018-0515-3 [DOI] [PMC free article] [PubMed] [Google Scholar]
- 33.Zhan X, Jickling C, Glen C, P Ander B, Liu D, Stamova B, Cox C, Jin L-W, DeCarli C, R Sharp F. Myelin injury and degraded myelin vesicles in Alzheimer’s disease. Curr Alzheimer Res 2014;11:232-8. 10.2174/1567205011666140131120922 [DOI] [PMC free article] [PubMed] [Google Scholar]
- 34.Dong YX, Zhang HY, Li HY, Liu PH, Sui Y, Sun XH. Association between Alzheimer’s disease pathogenesis and early demyelination and oligodendrocyte dysfunction. Neural Regen Res 2018;13:908-14. 10.4103/1673-5374.232486 [DOI] [PMC free article] [PubMed] [Google Scholar]
- 35.Wisnieff C, Ramanan S, Olesik J, Gauthier S, Wang Y, Pitt D. Quantitative susceptibility mapping (QSM) of white matter multiple sclerosis lesions: Interpreting positive susceptibility and the presence of iron. Magn Reson Med 2015;74:564-70. 10.1002/mrm.25420 [DOI] [PMC free article] [PubMed] [Google Scholar]


