Abstract
Objective:
Mucus provides a protective barrier separating sensitive epithelial surfaces from the outside world. The mouse colonic mucus is organized as a bacteria-free inner layer and a bacteria-colonized outer layer. Antibiotic treatments are known to disturb gut microbiota, but their effect on the mucosal barrier is rarely discussed. The aim was to evaluate and visualize the impact of antibiotics on the colonic mucus and the microbial community.
Materials and Methods:
Two sets of experiments were conducted. In the antibiotic experiment, mice orally ingested both streptomycin and bacitracin for 7 days. In the recovery experiment, mice were allowed to recover for 7 days without antibiotics after having received the 7-day antibiotic treatment. Mouse colons were isolated and divided into proximal, middle, and distal parts. Specimens were examined under a transmission electron microscope to identify morphological changes. The gut microbial community was evaluated by analyzing 16S rDNA sequences isolated from the different parts of the mouse colon.
Results:
The antibiotic-treated mice were physiologically normal. However, a significantly increased inner mucus layer in the proximal and middle colon and a dramatic decrease in bacterial numbers in the outer mucus layers were observed. The 16S rDNA compositions showed a similarity in the dominant taxa among different colon sections. While control mice had a diverse microbiota, antibiotic treatments effectively eliminated most of the bacteria, such that the community was dominated by only one genus (Turicibacter or Staphylococcus). Furthermore, following antibiotic withdrawal in treated mice, the thickness of the inner mucus layer returned to control levels, and the microbial community regained a more complex structure, dominated by Firmicutes, Bacteroidetes, and Proteobacteria.
Conclusions:
Our results indicated that antibiotic treatments not only disturbed the microbiota but also altered the structure of the mucus layer. After the withdrawal of antibiotics, the mucus layer was quickly regenerated within days, probably in response to microbial growth. The recolonization by gut inhabitants with diverse ecological roles, such as mucin-degraders and fermenters indicate that the gut ecosystem is functionally sound and highly resilient.
KEYWORDS: Gut microbiota, Mucus layer, Transmission electron microscopy
INTRODUCTION
Animal guts harbor complex communities of microorganisms that interact dynamically with their host, shaping the gut environment. Maintaining the host-microbial homeostasis in the gut is vital for host health; dysbiosis of gut bacteria often leads to diseases, such as obesity and inflammatory bowel disease [1,2,3].
Antibiotics are effective in treating bacterial infections and therefore, are used frequently in modern medicine. However, antimicrobial effects are not restricted to the target pathogens alone. They also act on commensal bacteria and can result in an alteration in gut microbial composition leading to dysbiosis [3,4,5]. Recent epidemiological studies showed that antibiotic use in children is often associated with the development of inflammatory bowel disease that may persist for an extended period [6,7]. Leclercq et al. [8] recently reported that low-dose penicillin administered early in life induced long-term changes in mouse brain cytokine expression and social behavior, indicating long-term effects of antibiotics on host health. In addition to affecting gut microbial homeostasis, antibiotics were found to facilitate an invasion of indigenous and pathogenic bacteria into host tissues, leading to inflammation or disease [5,9,10].
The colonic mucosal barrier comprises a thick mucus layer and a single layer of epithelial cells. The colonic mucus is organized in two layers. The inner layer is stratified and firmly attached to the epithelium and devoid of bacteria. In contrast, the outer layer is easily movable, and is colonized by bacteria [11]. The inner mucus layer and the tight junctions between intestinal epithelial cells serve to prevent commensal and pathogenic bacteria from entering the underlying submucosa. Studies have shown that bacteria-host interactions in the intestines regulate the production of mucus and the integrity of tight junctions [12,13]. The mucus layer not only protects the epithelium from dehydration, physical abrasion, and microbial assault but also serves as an important habitat for gut microbiota [14]. Goblet cells produce the mucus, which contains mucin, the main component forming the mucus. Bacteria that can colonize in the mucus layer, utilizing mucin as their energy source, have a better chance of becoming dominant residents within the gut [15].
Knowing that antibiotics can alter the gut microbial composition and that the colonic mucus layer is where many microbes reside, we were interested in investigating the morphological changes elicited by antibiotics in the mucus layer and the integrity of the mucosal barrier. The mucus layer is easily washed away during routine sample preparation. Matsuo et al. [16] reported better preservation of the mucus layer by using nonaqueous Carnoy's solution; however, ultrastructural details of colonic bacterial cells tend to be compromised by Carnoy fixation. In this study, we were able to modify traditional sample preparation procedures to successfully preserve both the mucus layer and the bacterial ultrastructures, allowing us to better visualize the effects of antibiotics on bacteria within the mucus layer. In addition, we examined whether the withdrawal of antibiotics would reverse the effects of antibiotics on microbial composition and mucus layer integrity. The results provided a morphological perspective on the effects of antibiotics in the colon.
MATERIALS AND METHODS
Animals
Six-week-old domestic male outbred NMRI mice (Mus musculus) were obtained from the Laboratory Animal Center of Tzu Chi University (Hualien, Taiwan). Mice were housed in a temperature-controlled room (22°C ± 2°C) in the animal facility of Tzu Chi University, and maintained on a 12-h light/dark cycle, with free access to food (laboratory rodent diet) and water. Animals were housed individually and were randomly allocated to each experimental group. All mice were monitored daily for weight gain, defecation, and amount of water consumed during experiments. All animal manipulations were performed in accordance with institutional guidelines and regulations under the protocols approved by the Institutional Animal Care and Use Committee of Tzu Chi University (approval number 96074).
Antibiotic treatment and recovery
Streptomycin and bacitracin (SB) (purchased from Sigma-Aldrich) were used in this study. It is one of the antibiotic regimens commonly applied to murine enteritis models [17]. Two sets of experiments were conducted. The first set measured the effects of antibiotic treatments on mouse colon mucosa. Three SB doses were administered in 250 mL of drinking water: Low (L; 0.5 g SB), medium (M; 1.0 g SB), and high (H; 1.5 g SB). A control group (C) received no antibiotics in water. These mice were sacrificed after the 7-day antibiotic treatment.
The second set was used to measure the effects of a recovery period in mice after antibiotic treatments. These mice received a 7-day antibiotic treatment, as described previously, and then entered a 7-day recovery period, receiving regular drinking water without antibiotics. Mice recovering from the low-, medium-, and high-dose antibiotic treatments were designated as LR (low-dose recovery), MR (medium-dose recovery), and HR (high-dose recovery) groups. Control mice received 14 days of regular water and were designated as the CR group.
Histological and electron microscopic examinations were conducted on tissues from antibiotic-treated and recovery mice to reveal changes in the mucus layer. For these analyses, groups of three mice were used in every treatment. The DNA analysis was conducted on another batch of mice to reveal changes in bacterial composition. Our preliminary data from the DNA analysis in the antibiotic treatment experiment showed that a low dose was enough to cause dramatic changes in the bacterial community; therefore, we conducted further experiments with the low-dose treatment, where three treated mice and three control mice were used. One additional mouse receiving a high dose was included for comparison. We encountered technical difficulties with polymerase chain reaction (PCR) reactions for some samples, therefore, no library was constructed [Supplementary Table 1].
Supplementary Table 1.
Mouse ID and detailed sample information
| Treatment | Animal ID | Clone libraries (library ID/number of clones) | ||
|---|---|---|---|---|
| Proximal colon | Middle colon | Distal colon | ||
| 7-day antibiotic treatment | ||||
| High dosea | H1 | H1D/40 | ||
| Low doseb | L1 | L1P/34 | L1M/34 | L1D/34 |
| L2 | L2P/22 | L2M/11 | L2D/7 | |
| L3 | L3P/14 | L3M/17 | L3D/12 | |
| Control | C1 | C1D/50 | ||
| C2 | C2P/42 | C2M/58 | ||
| C3 | C3P/37 | C3M/45 | C3D/38 | |
| C7 | C7P/54 | |||
| 7-day antibiotic treatment + 7-day recovery | ||||
| High dosea | HR1 | HR1P/43 | HR1M/46 | HR1D/47 |
| Low doseb | LR1 | LR1P/39 | LR1M/43 | LR1D/44 |
| LR2 | LR2P/45 | LR2M/46 | LR2D/45 | |
| LR3 | LR3P/47 | LR3M/40 | LR3D/47 | |
| Control | CR1 | CR1P/36 | CR1M/40 | CR1D/36 |
| CR2 | CR2D/34 | |||
a1.5 g streptomycin + 1.5 g bacitracin/250 mL drinking water, b0.5 g streptomycin + 0.5 g bacitracin/250 mL drinking water
Sampling
All mice were sacrificed at 9–10 A.M. The entire colon was removed, and approximately 1-cm segments of the proximal, middle and distal colon specimens were collected at sites immediately behind the cecum-colon junction, the mid-point, and then immediately before the colorectal junction, respectively. Distended colon segments loaded with feces were sampled to investigate the mucus layer [18].
Histological examination
Specimens were fixed in 4% formaldehyde in phosphate buffered saline (pH 7.3) at 4°C overnight. Tissues were then dehydrated through a graded series of ethanol, cleared in xylene, and embedded in paraffin. Sections of 5 μm were cut on a Leica RM2025 microtome and stained with hematoxylin and eosin to evaluate colonic inflammation.
Transmission electron microscopy
For mucus layer investigation, the above mentioned 1-cm tube-shaped, feces-loaded colon specimens were tied at both ends to prevent mucus loss. Tissues were fixed in nonaqueous Carnoy's solution (ethanol:acetic acid:chloroform = 6:3:1, v/v/v) for 48 h at 4°C [16], washed with 0.1 M cacodylate buffer (pH 7.3), and postfixed with 1% osmium tetroxide/0.1 M cacodylate buffer for 2 h at room temperature. The tissues were en bloc stained with 2% uranyl acetate for 1 h, dehydrated through a graded series of ethanol, and embedded in LR White. For tight junction examination, specimens were trimmed to 1 mm3 and fixed with 2.5% glutaraldehyde/0.1 M cacodylate buffer at 4°C for 24 h, followed by postfixation with 1% osmium tetroxide/0.1 M cacodylate buffer for 1 h at room temperature. After staining with uranyl acetate and dehydrating as mentioned above, tissues were embedded in Spurr's resin. Serial ultrathin sections of 70–80 nm were cut on a Leica Ultracut R ultramicrotome (Leica, Heerbrugg, Switzerland) and examined using a Hitachi H-7500 transmission electron microscope (TEM; Hitachi, Tokyo, Japan) at 80 kV.
Morphometric analysis of mucus layers
The thickness of the inner mucus layer was defined as the homogeneous area that spanned from the top of colonic epithelial microvilli to where morphologically intact bacteria appeared. Bacteria showing continuous plasma membrane were considered morphologically intact; while bacteria showing disrupted or compromised membrane or lysed/condensed cytosol were considered bacterial debris. Both morphologically intact bacteria and bacterial debris were more electron-dense than the homogeneous mucus. The thickness of the inner mucus layer was measured as depicted in Figure 1. A horizontal line abutting epithelial microvilli was drawn to indicate the interface between the gut epithelium and the mucus layer. A line was drawn perpendicular to the horizontal line until the first bacterium was encountered on the outer mucus layer. The distance of this perpendicular line was measured to scale and was considered the thickness of the inner mucus layer.
Figure 1.
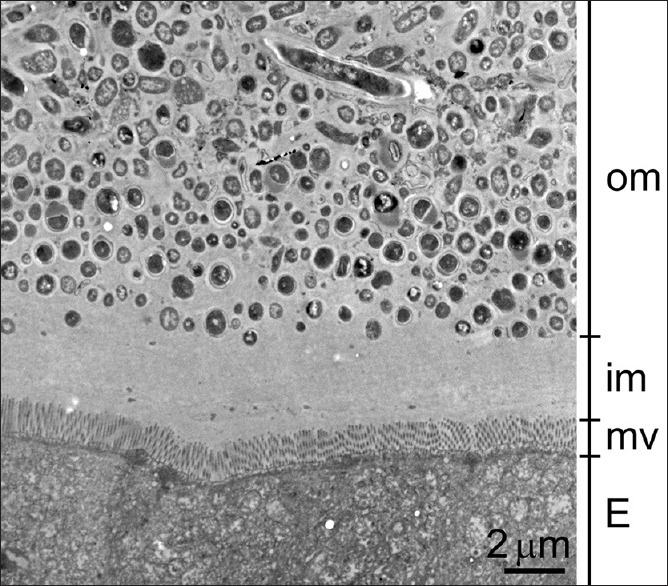
Measurement of the inner mucus layer. The inner mucus (im) layer was defined as the region between the colonic epithelial microvilli (mv) surface and the region where gut bacteria appeared. The thickness was measured by drawing a horizontal line indicating the uppermost limit of the epithelium (E), followed by drawing a line perpendicular to the horizontal line until the first bacterium was encountered on the outer mucus (om) layer. The distance of the perpendicular line was measured to scale and was considered the thickness of the inner mucus layer
To avoid sampling bias, three randomly picked regions on each section were measured and averaged to represent the thickness of that single section. However, to minimize measuring variations, we tried to image areas with perfect longitudinally sectioned microvilli and avoided crypts and folds. Measurements were made on three different ultrathin sections per colon segment per mouse, and three mice were used in each experimental group. An estimated section area of 10 mm2 was examined for quantification for each colonic segment per treatment group. Data were expressed as means ± standard errors. ANOVA and Tukey test were performed using PAST3 to assess differences among experimental groups.
Polymerase chain reaction and cloning
Samples of the proximal, middle, and distal colon from the same animal were collected separately. A 0.5–1.0-cm section of each intestinal region was dissected open, washed gently with distilled water to remove gut contents, and the mucus was scraped off and collected. DNA was extracted from these samples using the phenol-chloroform method. Bacterial 16S rRNA genes were amplified using the universal primers 27f (5’-AGAGTTTGATCCTGGCTCAG) and 1522r (5’-AAGGAGGTGATCCA(A/G)CCGCA) [19]. PCR products were ligated into pGEM-T vectors (Promega, Madison, Wisconsin, USA) and transformed into JM109 competent Escherichia coli (Promega). After the standard blue–white screening, clones were checked for the correctly sized insertion and submitted to the National Yang-Ming University VYM Genome Research Center (Taipei, Taiwan) for sequencing.
Sequence analysis
All 16S rDNA sequences obtained in this study were analyzed using Mothur version 1.39.5 [20]. Classification of sequences was based on close database comparison using the SILVA version 128 database and taxonomy [21,22]. The phylotype function was used for OTU assignment. The chimera-uchime was used for chimera detection.
RESULTS
Three SB dosage (L, M, and H) groups were tested in this study. The amount of antibiotics ingested in the L, M, and H groups were estimated to be 6, 12, and 18 mg per mouse per day, respectively, calculated based on daily water consumption of 3 mL, as described previously [23]. Weight gain was not significantly different between control and antibiotic-treated mice [Figure 2]. Defecation was monitored daily for fecal pellet numbers and consistency, and no difference was noted between treatment and control groups.
Figure 2.
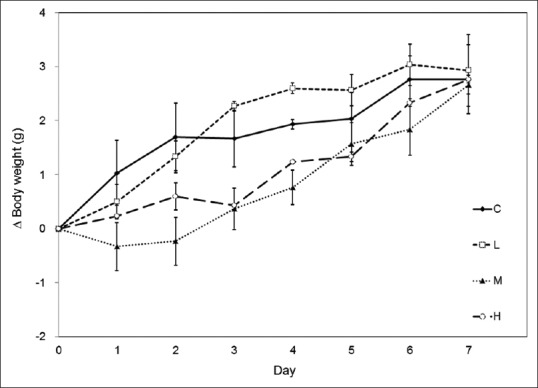
Effects of antibiotics on mouse weight gain. The Y-axis indicates the change in body weight for each mouse compared to its weight at day 0. During the 7 days of antibiotic consumption, all mice gradually gained weight, and there were no differences between control (C) and treatment groups (L: 0.5 g; M: 1.0 g; H: 1.5 g of SB treatments). Data are presented as means ± standard errors; P > 0.05; n = 3 mice per group
Effects of antibiotics on colonic mucus layer and ultrastructures
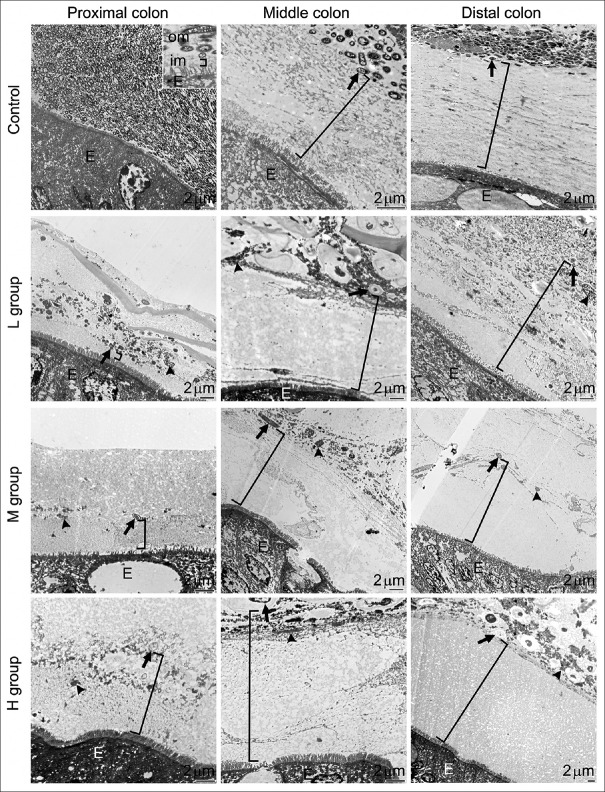
Samples prepared from antibiotic-treated and control groups were examined under a TEM. Despite no apparent physiological differences, dramatic morphological changes in the colon were observed in mice after the 7-day antibiotic treatment. In the control group, a bacteria-devoid inner mucus layer and a bacteria-packed outer mucus layer were seen obviously layering the colonic epithelial cells [Figure 3, first panel].
Figure 3.
Effects of antibiotics on the intestinal mucus layer. These representative transmission electron microscopy images show the proximal, middle, and distal colon taken from control (upper panel) mice and mice treated with 0.5 g (second panel, L group), 1.0 g (third panel, M group), or 1.5 g (fourth panel, H group) of SB. The inner mucus layer (im, bracket symbols in all images) is clearly identifiable in the images from control colons: A relatively homogeneous and electron-lucent area spanning between the epithelium (E) and the bacteria-rich outer mucus layer (om). The thickness of the inner mucus layer significantly increased from the proximal to the distal colon in control mice. Antibiotics effectively decreased bacterial numbers and only a few remained morphologically intact (arrows) in the outer mucus layer. The increased concentrations of electron-dense materials (arrowheads) in the outer mucus layer are bacterial debris
The thickness of the inner mucus layer increased from the proximal to the distal colon, averaging 0.25 ± 0.02 μm in the proximal colon, 8.93 ± 0.2 μm in the middle colon, and 17.31 ± 0.49 μm in the distal colon [Figure 4]. In antibiotic-treated mice, morphologically intact bacteria were scarcely seen in the outer mucus layer; instead, electron-dense bacterial debris became the major components [Figure 3, second to fourth panels]. A significant increase in the thickness of the inner mucus layer was found in the proximal (M and H dosage) and middle, but not distal, parts of the colon after antibiotic treatments [Figure 4]. The lowest antibiotic dose (0.5 g SB in 250 mL water) used in this study effectively wiped out the majority of gut microbes and increased the inner mucus layer thickness in the proximal and middle colon. Higher doses had similar results but did not further increase the thickness of the inner mucus layer.
Figure 4.
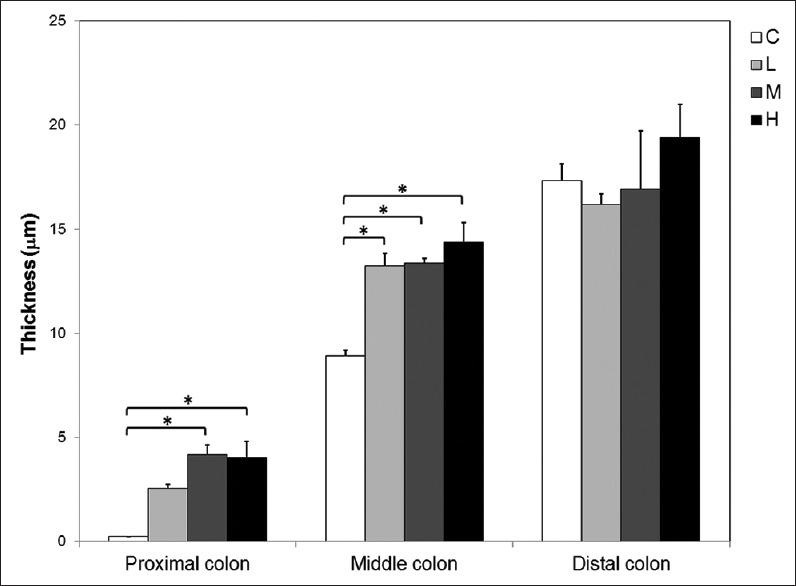
Quantitative analysis of the thickness of the inner mucus layer. The thickness of the inner mucus layer was similar in distal but different in both middle (ANOVA, P = 0.001) and proximal (P = 0.004) colons among control (C) and antibiotic-treated (L, M, H) groups. The L, M, and H represent groups of mice that received 0.5 g streptomycin-bacitracin, 1 g streptomycin-bacitracin, and 1.5 g streptomycin-bacitracin treatment, respectively. Asterisks (*) indicate significantly different groups (Tukey's test, P < 0.05). Each bar represents the average thickness of 27 measurements from 3 mice
Although dramatic changes were found in the colonic mucus layer, tight junctions between epithelial cells showed normal morphology in all the colon sections examined [Figure 5]. The results indicate that epithelial integrity was not compromised after antibiotic treatments. This is supported by the fact that no sign of inflammation, such as infiltration of lymphocytes, was detected in antibiotic-treated colonic tissues [Figure 6].
Figure 5.
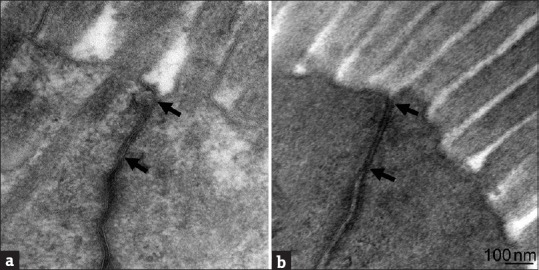
Evaluation of tight junctions of colonic epithelial cells. Representative images indicate that tight junctions (arrows) between colonic epithelial cells remained intact after antibiotic treatments. (a) Control, (b) M group. All sections (at least 27 sections per treatment group) reviewed showed intact tight junctions (100%)
Figure 6.
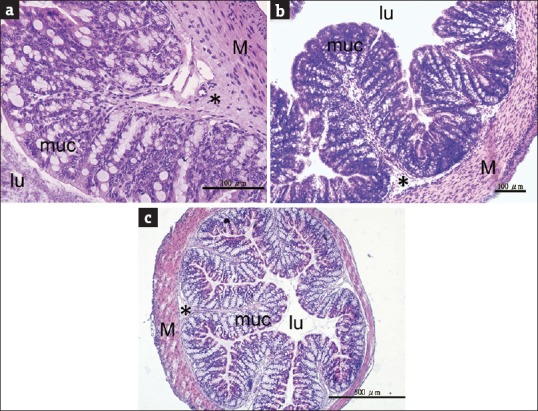
Evaluation of colonic inflammation. Representative middle colon images from (a) control mice, (b) L group mice (0.5 g streptomycin-bacitracin), and (c) M group mice (1 g streptomycin-bacitracin) indicate that there were no signs of inflammation in antibiotic-treated mouse colons. The histological features were not different between treatment and control groups. lu: Lumen, muc: Mucosa including epithelial cells and lamina propria, *: Submucosa, M: Muscularis externa
Recovery of mucus morphology after antibiotic withdrawal
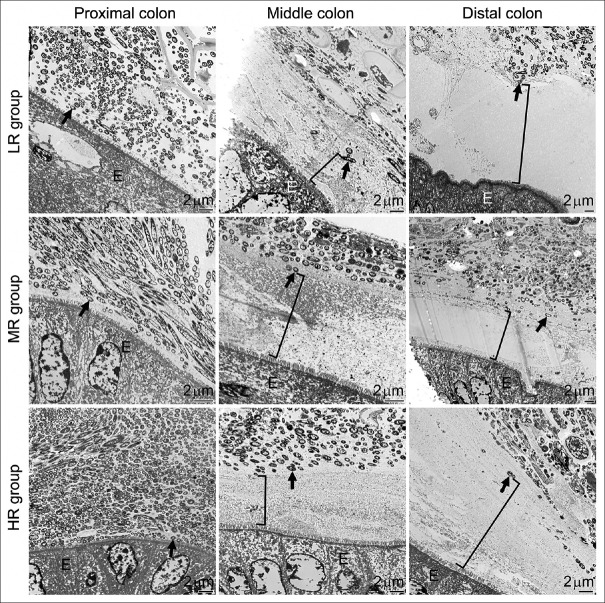
We further investigated whether the above postantibiotic treatment effects could be reversed after a period of cessation from antibiotic treatments. Mice that received 7-day antibiotic treatments were returned to regular water with no antibiotics over a 7-day recovery period. After the recovery, the abundance of microbes in the outer colonic mucus layer was similar to that in nontreated controls, despite the initial dosages received. The re-established microbes occupied the outer mucus layer, providing a clear delineation between the inner and outer mucus layers similarly to control samples [Figure 7]. The thickness of the inner mucus layer was, therefore, not different from control levels after the recovery period [Figure 8].
Figure 7.
Restoration of the mucus layer in the colon by antibiotic withdrawal. The two-layer structure and the thickness of the inner mucus layer (bracket symbols) returned to control levels [see controls in Figure 3] for all groups of antibiotic-treated mice after 7 days of antibiotic withdrawal. No significant difference was found among treatment groups and controls. Intact bacteria (arrows) recolonized the outer mucus layer. LR group, MR group, and HR group represent the 7-day low, medium, and high-dose antibiotic treatments plus a 7-day recovery, respectively. E: Epithelium
Figure 8.
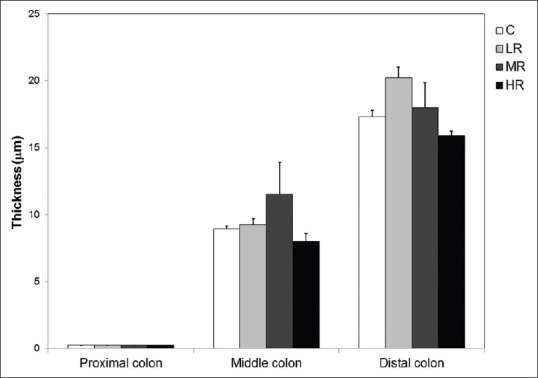
Quantification of the inner mucus layer thickness in antibiotic withdrawal experiments. The thickness of the inner mucus layer in all regions of the colon returned to control levels (C) in antibiotic-treated mice following a 7-day recovery period (ANOVA, P > 0.05 in all colonic parts). No significant difference was found among treatment groups and controls. The symbols LR, MR, and HR represent groups of mice that recovered from 0.5 g streptomycin-bacitracin, 1 g streptomycin-bacitracin, and 1.5 g streptomycin-bacitracin treatment, respectively
Changes in colonic microbial composition after antibiotic treatment and recovery
Alterations of mouse colon mucus could lead to changes in physical barrier function and mucin availability, therefore lead to changes in microbial composition, especially mucin-degrading bacteria. Dysbiosis has been linked to the deterioration of health in various diseases; for example, antibiotic-induced dysbiosis is known to have detrimental effects on both current and future health conditions [24,25]. Therefore, we examined the bacterial composition in these colon samples. We successfully amplified 16S rDNA fragments from most proximal, middle, and distal colon samples. However, we were unable to amplify the DNA fragment for some samples, primarily in the high-dosage treatment groups. This could be due to improper handling of samples, or due to a greatly reduced bacterial cell number, therefore, not enough bacterial DNA was available for PCR analysis. For other libraries, 96 clones were sequenced. After removing chimera and nonbacteria sequences, a total of 1227 sequences were used for further analysis [Supplementary Table 1]. Sequence analysis results showed inter-batch discrepancies in colonic microbial compositions between the mice used for the antibiotic treatment experiments and the recovery experiments; therefore, we have avoided direct comparisons between the two groups in our analysis.
At the phylum level, there seemed to be little change in community composition between antibiotic-treated and control mice; major changes in composition and a reduction in biodiversity were evident at the genus level [Figure 9a and c]. All antibiotic-treated animals had a bacterial community dominated by only one genus (Turicibacter in L1, and Staphylococcus in L2 and L3). In contrast, various genera were seen in all control animals and throughout all colonic segments, including common anaerobic gut inhabitants, such as Clostridia and Lachnospiraceae. These results indicate dramatic changes in the microbial community as a result of antibiotic treatments. The results also showed that the lowest dose of antibiotics used in this study (0.5 g SB) was sufficient to cause a large disturbance in colonic microbiota.
Figure 9.
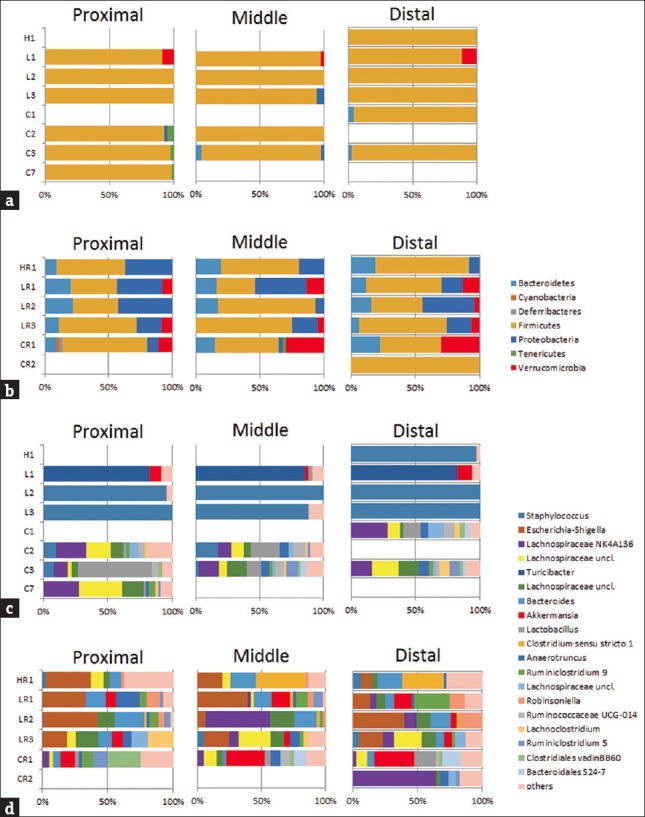
Phylum-level (a and b) and genus-level (c and d) bacterial composition in mouse colon samples based on 16S rDNA analysis. Data are shown separately for the proximal, middle, and distal colon. Community compositions after a 7-day antibiotic treatment are shown in (a) and (c), including H (1.5 g streptomycin-bacitracin), L (0.5 g streptomycin-bacitracin), and C (control) groups. Community compositions after a 7-day antibiotic treatment plus a 7-day recovery period are shown in (b) and (d), including HR (recovery after 1.5 g streptomycin-bacitracin), LR (recovery after 0.5 g streptomycin-bacitracin) and CR (control) groups. Numbers indicate mouse IDs [Supplementary Table 1]
We traced the changes in microbiota after a 7-day recovery period following antibiotic administration as a measure of resilience after such a disturbance [Figure 9b and d]. At the phylum level, the recovered communities had similar compositions to communities with no antibiotic exposure; however, the genus-level bacterial compositions were still very different. Escherichia-Shigella sequences were observed in recovered communities of high relative abundance, but not in the age-matching controls. This indicates that the community responded to antibiotic withdrawal with a rapid increase in bacterial diversity; however, a much longer period is probably required for a full restoration of the original gut microbial composition.
DISCUSSION
SB dosages used in this study were higher than human recommended dosages [26]. However, both SB are recommended to be administered by injection since they are poorly absorbed in the gut. Therefore, the actual antibiotic concentration that entered the mouse circulation is expected to be much lower and unlikely to have adverse effects on mouse physiology. Furthermore, the three dosages used in this study did not seem to affect mouse daily activities. The body weight gain, defecation, food and water intakes, and shape of feces were not different between control and antibiotic-treated mice.
However, these antibiotic-treated, apparently physiologically normal mice, showed a significant change in the mucus layer covering the colonic epithelium. The mucus that coats the apical surface of the epithelial cells is one of the important habitats for gut microbes [14]. Mucins are the main components forming the mucus layer. The highly glycosylated mucin proteins are very large molecules, comprising up to 80% carbohydrates, mostly in the form of O-linked glycans [27,28]. Bacteria that can colonize the mucus layer, or utilize mucin as their energy source, would have a better chance of becoming dominant residents within the gut [29]. Nevertheless, the inner mucus layer is presented as a bacteria-free zone between the epithelial cells and the outer mucus layer [11]. Metronidazole and cotrimoxazole treatments have been reported to increase colon mucus thickness in rats [30]; however, the authors in that particular study used light microscopy, and hence, the inner and outer mucus layers were not measured separately. In this study, using the high resolution of electron microscopy we found that antibiotics affected bacteria in the outer mucus layer, and the reduction in bacterial numbers resulted in a thickened inner mucus layer in the proximal and middle parts of the colon. This increase in inner mucus thickness may be attributed partly to the much-reduced bacterial consumption of mucin.
Recently, Kamphuis et al. [18] provided evidence showing that mucus organization is shaped by colonic contents. They found that mucus was observed only when there is food residue in the lumen, and was not seen in the empty colon. They further proposed that the mucus is actually covering the feces instead of lining the epithelial surface in the distal colon. Nevertheless, the role of the mucus layer in separating the epithelium from the bacteria-loaded feces still holds true. However, they concluded that the mucus and feces were mixed in the proximal colon, and the bacteria were in contact with the epithelial surface in the proximal colon. In our study, we did see a very close association between epithelial cells and bacteria in the proximal colon under TEM. Nevertheless, a 0.25 ± 0.02 μm inner mucus layer was observed to separate the epithelium and bacteria [Figure 3]. Compared to previous light microscopy-based findings, our TEM approach provides detailed results with higher resolution.
The increase of the inner mucus layer was only observed in the proximal and middle colon, but not in the distal colon, after antibiotic treatment. Most mucus-related studies focused on distal colon and few discussed the temporal or spatial differences along the entire length of colon. With limited data at hand, it is hard to even speculate the mechanism behind this phenomenon. Nevertheless, in our study, the microbial community in one antibiotic-treated animal was dominated by Turicibacter. Turicibacter has been implicated as a butyrate producer [31]. It has been reported that proximal and distal colon responded differently to butyrate, and the number of mucus-containing cells was found to be correlated with butyrate concentration only in proximal but not in the distal colon [32]. Therefore, the dominance of Turicibacter during antibiotic treatment may increase butyrate production, resulted in thickening of the mucus layer. In addition, the proximal colon was thought to have no firm mucus barrier formed until the chyme starts to gain a pellet structure in the distal colon [18]. The differences in colonic contents and microbial community structures are all possible factors influencing the effects of antibiotics on different parts of the colon.
Antibiotic treatments led to an increase in the thickness of the inner mucus layer and a decrease in the diversity of the bacterial community. The colonic communities of antibiotic-treated mice were dominated by Staphylococcus or Turicibacter. Both Staphylococcus [33] and Turicibacter [34] have been reported as common gut commensals in mice. It is likely that the antibiotic treatments wiped out most of the gut microbes, providing a niche for fast-growing microbes.
We found apparent discrepancy in colonic microbiota between the two batches of mice (antibiotic treated and recovery groups). This variation has been reported among different sources or even cages in the same animal facilities [35,36]. In our data, mice within the same batch showed similarity in microbiota composition, and treated groups showed rather dramatic changes in composition, therefore we considered the comparisons among mice of the same batch were valid.
The changes in the bacterial community may be an important factor affecting mucus production. Mucin production has been reported to be affected by the microbial change. For example, Bengtsson et al. [37] described that a Lawsonia intracellularis infection greatly reduced mucin production. Ruminococcus gnavus has also been reported to modulate mucin expression and intestinal glycosylation [38]. Turicibacter may increase butyrate production [31] and result in thickening of the mucus layer as described above. That is, in addition to reduced bacterial cells after antibiotic treatment, the dramatic modified microbial community may be another possibility influencing the thickness of the inner mucus layer.
The thickness of the inner mucus layer returned to control levels soon after the cessation of antibiotic treatments. Morphologically intact bacterial cells were observed recolonizing the outer mucus layer after the 7-day recovery. The source of repopulating bacteria could be derived from the diet, the environment, and/or bacteria residing in colonic pockets or folds that survived the antibiotic treatments. Although the morphology of the mucus layer successfully recovered to control levels after the 7-day recovery, the microbial community composition at the genus level still differed from that in control mice. It seems that a much longer period is required for a full restoration to the original microbial community. Nevertheless, microbes with distinct ecological functions, such as mucin degrader (e.g., Akkermansia) and fermenters (e.g., Ruminococcus), appeared in the gut community after the 7-day recovery. These results suggest that this community is in the process of functional recovery after experiencing a disturbed state within a relatively short time after the removal of antibiotics.
CONCLUSIONS
It is worth noting from our study that although antibiotic treatment significantly altered the mucus layer and destroyed most of the bacteria in the outer mucus layer, the mice showed no sign of symptoms related to the gut. The main reason for this could be that the tight junctions and the inner mucus layer remained intact throughout the experiment; a compromised intestinal mucosal barrier often leads to gut-associated diseases [39]. Similar results to our study could occur when patients receive antibiotics to treat infections. We should keep in mind that whether or not a gut-associated discomfort has been reported, the critically important gut microbial community may already exhibit profound changes that can affect the body.
Financial support and sponsorship
This work was supported by grants 97-2311-B-320-001-MY3 from the Ministry of Science and Technology of Taiwan and TCRPP100008 from the Buddhist Compassion Relief Tzu Chi Foundation to Han-Chen Ho.
Conflicts of interest
There are no conflicts of interest.
Acknowledgments
The authors are grateful to the staff of the Electron Microscopy Laboratory, Tzu Chi University, for technical support.
REFERENCES
- 1.Miyoshi J, Bobe AM, Miyoshi S, Huang Y, Hubert N, Delmont TO, et al. Peripartum antibiotics promote gut dysbiosis, loss of immune tolerance, and inflammatory bowel disease in genetically prone offspring. Cell Rep. 2017;20:491–504. doi: 10.1016/j.celrep.2017.06.060. [DOI] [PMC free article] [PubMed] [Google Scholar]
- 2.Turnbaugh PJ, Ley RE, Mahowald MA, Magrini V, Mardis ER, Gordon JI. An obesity-associated gut microbiome with increased capacity for energy harvest. Nature. 2006;444:1027–31. doi: 10.1038/nature05414. [DOI] [PubMed] [Google Scholar]
- 3.Wlodarska M, Willing B, Keeney KM, Menendez A, Bergstrom KS, Gill N, et al. Antibiotic treatment alters the colonic mucus layer and predisposes the host to exacerbated Citrobacter rodentium-induced colitis. Infect Immun. 2011;79:1536–45. doi: 10.1128/IAI.01104-10. [DOI] [PMC free article] [PubMed] [Google Scholar]
- 4.Panda S, El khader I, Casellas F, López Vivancos J, García Cors M, Santiago A, et al. Short-term effect of antibiotics on human gut microbiota. PLoS One. 2014;9:e95476. doi: 10.1371/journal.pone.0095476. [DOI] [PMC free article] [PubMed] [Google Scholar]
- 5.Raymann K, Shaffer Z, Moran NA. Antibiotic exposure perturbs the gut microbiota and elevates mortality in honeybees. PLoS Biol. 2017;15:e2001861. doi: 10.1371/journal.pbio.2001861. [DOI] [PMC free article] [PubMed] [Google Scholar]
- 6.Hviid A, Svanström H, Frisch M. Antibiotic use and inflammatory bowel diseases in childhood. Gut. 2011;60:49–54. doi: 10.1136/gut.2010.219683. [DOI] [PubMed] [Google Scholar]
- 7.Kronman MP, Zaoutis TE, Haynes K, Feng R, Coffin SE. Antibiotic exposure and IBD development among children: A population-based cohort study. Pediatrics. 2012;130:e794–803. doi: 10.1542/peds.2011-3886. [DOI] [PMC free article] [PubMed] [Google Scholar]
- 8.Leclercq S, Mian FM, Stanisz AM, Bindels LB, Cambier E, Ben-Amram H, et al. Low-dose penicillin in early life induces long-term changes in murine gut microbiota, brain cytokines and behavior. Nat Commun. 2017;8:15062. doi: 10.1038/ncomms15062. [DOI] [PMC free article] [PubMed] [Google Scholar]
- 9.Diard M, Sellin ME, Dolowschiak T, Arnoldini M, Ackermann M, Hardt WD. Antibiotic treatment selects for cooperative virulence of Salmonella typhimurium. Curr Biol. 2014;24:2000–5. doi: 10.1016/j.cub.2014.07.028. [DOI] [PubMed] [Google Scholar]
- 10.Knoop KA, McDonald KG, Kulkarni DH, Newberry RD. Antibiotics promote inflammation through the translocation of native commensal colonic bacteria. Gut. 2016;65:1100–9. doi: 10.1136/gutjnl-2014-309059. [DOI] [PMC free article] [PubMed] [Google Scholar]
- 11.Johansson ME, Larsson JM, Hansson GC. The two mucus layers of colon are organized by the MUC2 mucin, whereas the outer layer is a legislator of host-microbial interactions. Proc Natl Acad Sci U S A. 2011;108(Suppl 1):4659–65. doi: 10.1073/pnas.1006451107. [DOI] [PMC free article] [PubMed] [Google Scholar]
- 12.Ottman N, Reunanen J, Meijerink M, Pietilä TE, Kainulainen V, Klievink J, et al. Pili-like proteins of Akkermansia muciniphila modulate host immune responses and gut barrier function. PLoS One. 2017;12:e0173004. doi: 10.1371/journal.pone.0173004. [DOI] [PMC free article] [PubMed] [Google Scholar]
- 13.Plöger S, Stumpff F, Penner GB, Schulzke JD, Gäbel G, Martens H, et al. Microbial butyrate and its role for barrier function in the gastrointestinal tract. Ann N Y Acad Sci. 2012;1258:52–9. doi: 10.1111/j.1749-6632.2012.06553.x. [DOI] [PubMed] [Google Scholar]
- 14.Macfarlane S, Dillon JF. Microbial biofilms in the human gastrointestinal tract. J Appl Microbiol. 2007;102:1187–96. doi: 10.1111/j.1365-2672.2007.03287.x. [DOI] [PubMed] [Google Scholar]
- 15.Rodríguez JM, Murphy K, Stanton C, Ross RP, Kober OI, Juge N, et al. The composition of the gut microbiota throughout life, with an emphasis on early life. Microb Ecol Health Dis. 2015;26:26050. doi: 10.3402/mehd.v26.26050. [DOI] [PMC free article] [PubMed] [Google Scholar]
- 16.Matsuo K, Ota H, Akamatsu T, Sugiyama A, Katsuyama T. Histochemistry of the surface mucous gel layer of the human colon. Gut. 1997;40:782–9. doi: 10.1136/gut.40.6.782. [DOI] [PMC free article] [PubMed] [Google Scholar]
- 17.Croswell A, Amir E, Teggatz P, Barman M, Salzman NH. Prolonged impact of antibiotics on intestinal microbial ecology and susceptibility to enteric Salmonella infection. Infect Immun. 2009;77:2741–53. doi: 10.1128/IAI.00006-09. [DOI] [PMC free article] [PubMed] [Google Scholar]
- 18.Kamphuis JB, Mercier-Bonin M, Eutamène H, Theodorou V. Mucus organisation is shaped by colonic content; a new view. Sci Rep. 2017;7:8527. doi: 10.1038/s41598-017-08938-3. [DOI] [PMC free article] [PubMed] [Google Scholar]
- 19.Song B, Kerkhof LJ, Häggblom MM. Characterization of bacterial consortia capable of degrading 4-chlorobenzoate and 4-bromobenzoate under denitrifying conditions. FEMS Microbiol Lett. 2002;213:183–8. doi: 10.1111/j.1574-6968.2002.tb11303.x. [DOI] [PubMed] [Google Scholar]
- 20.Schloss PD, Westcott SL, Ryabin T, Hall JR, Hartmann M, Hollister EB, et al. Introducing mothur: Open-source, platform-independent, community-supported software for describing and comparing microbial communities. Appl Environ Microbiol. 2009;75:7537–41. doi: 10.1128/AEM.01541-09. [DOI] [PMC free article] [PubMed] [Google Scholar]
- 21.Quast C, Pruesse E, Yilmaz P, Gerken J, Schweer T, Yarza P, et al. The SILVA ribosomal RNA gene database project: Improved data processing and web-based tools. Nucleic Acids Res. 2013;41:D590–6. doi: 10.1093/nar/gks1219. [DOI] [PMC free article] [PubMed] [Google Scholar]
- 22.Yilmaz P, Parfrey LW, Yarza P, Gerken J, Pruesse E, Quast C, et al. The SILVA and “All-species living tree project (LTP)” taxonomic frameworks. Nucleic Acids Res. 2014;42:D643–8. doi: 10.1093/nar/gkt1209. [DOI] [PMC free article] [PubMed] [Google Scholar]
- 23.Sekirov I, Tam NM, Jogova M, Robertson ML, Li Y, Lupp C, et al. Antibiotic-induced perturbations of the intestinal microbiota alter host susceptibility to enteric infection. Infect Immun. 2008;76:4726–36. doi: 10.1128/IAI.00319-08. [DOI] [PMC free article] [PubMed] [Google Scholar]
- 24.Vangay P, Ward T, Gerber JS, Knights D. Antibiotics, pediatric dysbiosis, and disease. Cell Host Microbe. 2015;17:553–64. doi: 10.1016/j.chom.2015.04.006. [DOI] [PMC free article] [PubMed] [Google Scholar]
- 25.Neuman H, Forsythe P, Uzan A, Avni O, Koren O. Antibiotics in early life: Dysbiosis and the damage done. FEMS Microbiol Rev. 2018;42:489–99. doi: 10.1093/femsre/fuy018. [DOI] [PubMed] [Google Scholar]
- 26.World Health Organization. Geneva: WHO Press; 2001. WHO model prescribing information: Drugs used in bacterial infections. [Google Scholar]
- 27.Gendler SJ, Spicer AP. Epithelial mucin genes. Annu Rev Physiol. 1995;57:607–34. doi: 10.1146/annurev.ph.57.030195.003135. [DOI] [PubMed] [Google Scholar]
- 28.Strous GJ, Dekker J. Mucin-type glycoproteins. Crit Rev Biochem Mol Biol. 1992;27:57–92. doi: 10.3109/10409239209082559. [DOI] [PubMed] [Google Scholar]
- 29.Deplancke B, Hristova KR, Oakley HA, McCracken VJ, Aminov R, Mackie RI, et al. Molecular ecological analysis of the succession and diversity of sulfate-reducing bacteria in the mouse gastrointestinal tract. Appl Environ Microbiol. 2000;66:2166–74. doi: 10.1128/aem.66.5.2166-2174.2000. [DOI] [PMC free article] [PubMed] [Google Scholar]
- 30.Dossou-Yovo F, Mamadou G, Soudy ID, Limas-Nzouzi N, Miantezila J, Desjeux JF, et al. Metronidazole or cotrimoxazole therapy is associated with a decrease in intestinal bioavailability of common antiretroviral drugs. PLoS One. 2014;9:e89943. doi: 10.1371/journal.pone.0089943. [DOI] [PMC free article] [PubMed] [Google Scholar]
- 31.Zhong Y, Nyman M, Fåk F. Modulation of gut microbiota in rats fed high-fat diets by processing whole-grain barley to barley malt. Mol Nutr Food Res. 2015;59:2066–76. doi: 10.1002/mnfr.201500187. [DOI] [PubMed] [Google Scholar]
- 32.Meslin JC, Bensaada M, Popot F, Andrieux C. Differential influence of butyrate concentration on proximal and distal colonic mucosa in rats born germ-free and associated with a strain of Clostridium paraputrificum. Comp Biochem Physiol A Mol Integr Physiol. 2001;128:379–84. doi: 10.1016/s1095-6433(00)00317-2. [DOI] [PubMed] [Google Scholar]
- 33.Hilbert T, Steinhagen F, Senzig S, Cramer N, Bekeredjian-Ding I, Parcina M, et al. Vendor effects on murine gut microbiota influence experimental abdominal sepsis. J Surg Res. 2017;211:126–36. doi: 10.1016/j.jss.2016.12.008. [DOI] [PubMed] [Google Scholar]
- 34.Suriano F, Bindels LB, Verspreet J, Courtin CM, Verbeke K, Cani PD, et al. Fat binding capacity and modulation of the gut microbiota both determine the effect of wheat bran fractions on adiposity. Sci Rep. 2017;7:5621. doi: 10.1038/s41598-017-05698-y. [DOI] [PMC free article] [PubMed] [Google Scholar]
- 35.Hoy YE, Bik EM, Lawley TD, Holmes SP, Monack DM, Theriot JA, et al. Variation in taxonomic composition of the fecal microbiota in an inbred mouse strain across individuals and time. PLoS One. 2015;10:e0142825. doi: 10.1371/journal.pone.0142825. [DOI] [PMC free article] [PubMed] [Google Scholar]
- 36.Rausch P, Basic M, Batra A, Bischoff SC, Blaut M, Clavel T, et al. Analysis of factors contributing to variation in the C57BL/6J fecal microbiota across German animal facilities. Int J Med Microbiol. 2016;306:343–55. doi: 10.1016/j.ijmm.2016.03.004. [DOI] [PubMed] [Google Scholar]
- 37.Bengtsson RJ, MacIntyre N, Guthrie J, Wilson AD, Finlayson H, Matika O, et al. Lawsonia intracellularis infection of intestinal crypt cells is associated with specific depletion of secreted MUC2 in goblet cells. Vet Immunol Immunopathol. 2015;168:61–7. doi: 10.1016/j.vetimm.2015.08.005. [DOI] [PMC free article] [PubMed] [Google Scholar]
- 38.Graziani F, Pujol A, Nicoletti C, Dou S, Maresca M, Giardina T, et al. Ruminococcus gnavus E1 modulates mucin expression and intestinal glycosylation. J Appl Microbiol. 2016;120:1403–17. doi: 10.1111/jam.13095. [DOI] [PubMed] [Google Scholar]
- 39.Catalioto RM, Maggi CA, Giuliani S. Intestinal epithelial barrier dysfunction in disease and possible therapeutical interventions. Curr Med Chem. 2011;18:398–426. doi: 10.2174/092986711794839179. [DOI] [PubMed] [Google Scholar]


