Abstract
Cardiogenic shock (CGS) is common and highly morbid. According to the National Inpatient Sample, there are more than 100,000 cases per year, and 30-day mortality approaches 50% despite improvements in critical care practices and novel mechanical therapies targeted at restoring normal hemodynamics. This issue aims to enhance clinicians' understanding of CGS, and this review specifically focuses on the underlying pathophysiology. We examine the definition and etiologies of CGS, approaches to risk assessment, and the pressure-volume loop framework that is the foundation for conceptualizing ventricular mechanics, ventricular-vascular interactions, and the derangements observed in CGS. This overview will also contextualize subsequent chapters that discuss nuances of CGS encountered in particular scenarios (ie, post-myocardial infraction, acutely decompensated chronic heart failure, post-cardiac surgery), address pharmacological and mechanical treatments for CGS, and review CGS in a case-based format.
Keywords: cardiogenic shock, pathogenesis, hemodynamics, pressure-volume analysis
INTRODUCTION
The combined incidence of decompensated heart failure and cardiogenic shock (CGS) is rising, creating a burgeoning market for device-based therapies to address the need for more effective treatments. Because medical guidelines are unable to keep up with the pace of innovation, clinicians are left to rely on their own understanding of the hemodynamic abnormalities present in individual patients and the therapeutic effects of different medications and devices. However, the prevailing concept that CGS is primarily a consequence of reduced cardiac output, which has guided clinicians' decision-making, is now known to be incomplete.1–3 Mounting evidence mandates a more nuanced view of CGS that factors in the complex interactions between the ventricles and the systemic or pulmonary vasculature, the interdependence between the left and right ventricles, and the molecular and inflammatory milieu that often accompanies CGS. This chapter explores those critical details and the pathophysiology of CGS by comprehensively reviewing the definitions, etiologies, and advanced hemodynamic principles of the condition.
PRINCIPLES OF CARDIOGENIC SHOCK
Definitions
Cardiogenic shock and the preshock state of acute decompensated heart failure (ADHF) represent a spectrum of hemodynamic deficits in patients with cardiovascular disease. Both ADHF and CGS describe states in which cardiac output is either insufficient to provide adequate tissue perfusion or is sufficient but requires compensatory hemodynamic changes that are deleterious and unsustainable. There are four distinct phenotypes of decompensated heart failure, and they are categorized according to volume status (euvolemic vs overloaded) and the adequacy of cardiac output (sufficient vs insufficient). Significant person-to-person variability limits the categorization of high versus low cardiac output, but this fact only emphasizes the importance of clinical, physical, and hemodynamic exams in diagnosing and managing CGS. Despite the paucity of evidence supporting their use in most patients with ADHF, pulmonary arterial catheters can nevertheless help clinicians manage patients who are critically ill from CGS by providing quantitative measures to assess relative changes in hemodynamic parameters and response to therapy.4 We therefore advocate the use of pulmonary arterial catheters in patients with refractory CGS, especially for those who require mechanical circulatory support.
Cardiogenic shock has also been defined in a number of clinical and research settings that complement the pragmatic definitions described above (Figure 1).5 The two major research definitions evolved out of two trials—SHOCK (Should We Emergently Revascularize Occluded Coronaries for Cardiogenic Shock) and IABP-SHOCK II (Intraaortic Balloon Pump in Cardiogenic Shock II)—that assessed CGS in the context of acute myocardial infarction (AMI). Common to the SHOCK and IABP-SHOCK II definitions were the following criteria: (1) systolic blood pressure < 90 mm Hg for ≥ 30 minutes or the requirement for support (pharmacologic or mechanical) to achieve adequate blood pressures, and (2) evidence of end-organ hypoperfusion defined by the presence of cool extremities, altered mental status, urine output < 30 mL/hour, or serum lactate > 2.0 mmol/L. The IABP-SHOCK II definition did not incorporate any hemodynamic parameters, eschewing pulmonary arterial catheter-derived data and including the presence of pulmonary edema on chest radiography as a surrogate of elevated pulmonary capillary wedge pressure (PCWP). In contrast, the SHOCK trial incorporated parameters such as cardiac index (CI) ≤ 2.2 L·min−1·m−2 and PCWP ≥ 15 mm Hg, although the use of pulmonary arterial catheters was not mandated in all patients enrolled in the study.5–7
Figure 1.
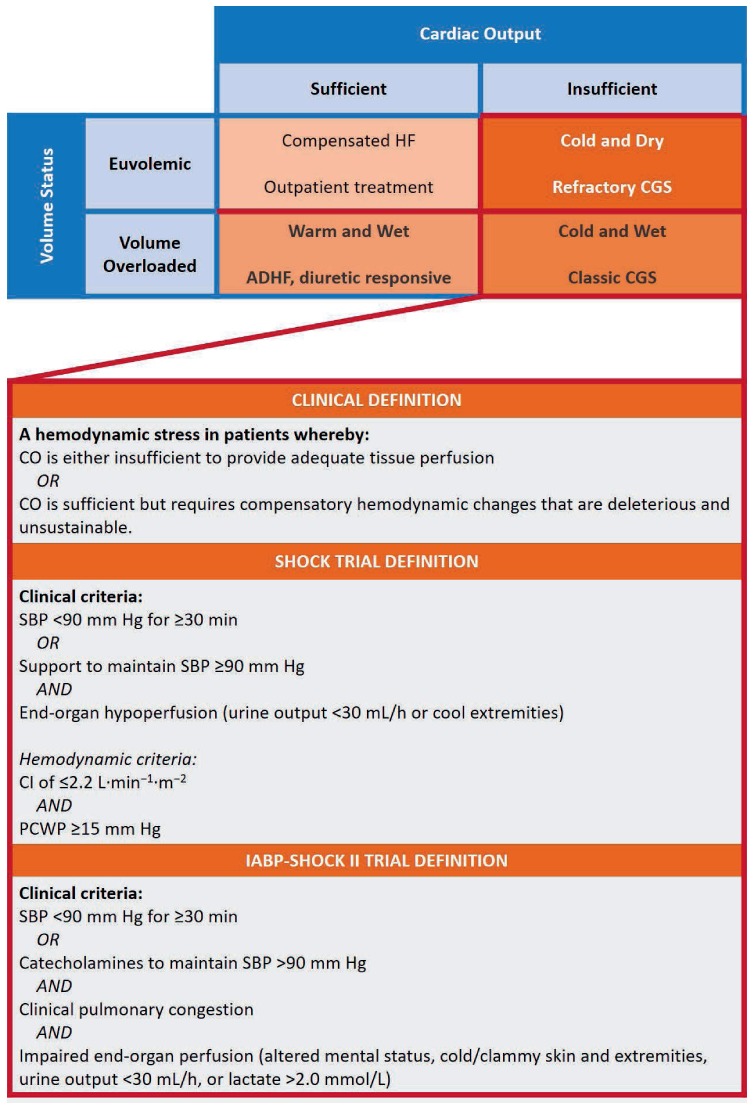
The Stevenson model for conceptualizing acutely decompensated heart failure according to volume status and cardiac output, and definitions for cardiogenic shock from the SHOCK and IABP-SHOCK II trials. Reprinted with permission.5
More recently, the Society of Coronary Angiography and Intervention (SCAI) released a consensus document with definitions of CGS and a classification schema for grading the degree of CGS as a step toward risk stratification for clinical and research purposes (Figure 2).8 This schema categorizes patients into five stages: “At-risk” for CGS (Stage A); in the “Beginning phases” of CGS (Stage B); manifesting “Classical” CGS (Stage C); “Deteriorating” from CGS such that a second inotrope or mechanical circulatory support is needed (Stage D); and patients who are “in Extremis” with hemodynamics refractory to prior treatments (Stage E). Regardless of a patient's CGS stage, cardiac arrest is an important modifier of prognosis. This schema creates a taxonomy acknowledging that patients present with different degrees of clinical and hemodynamic compromise, and that patients presenting at different stages may or may not benefit from different forms of treatment. It also allows for the possibility that aggressive therapies may be futile at more advanced stages.
Figure 2.
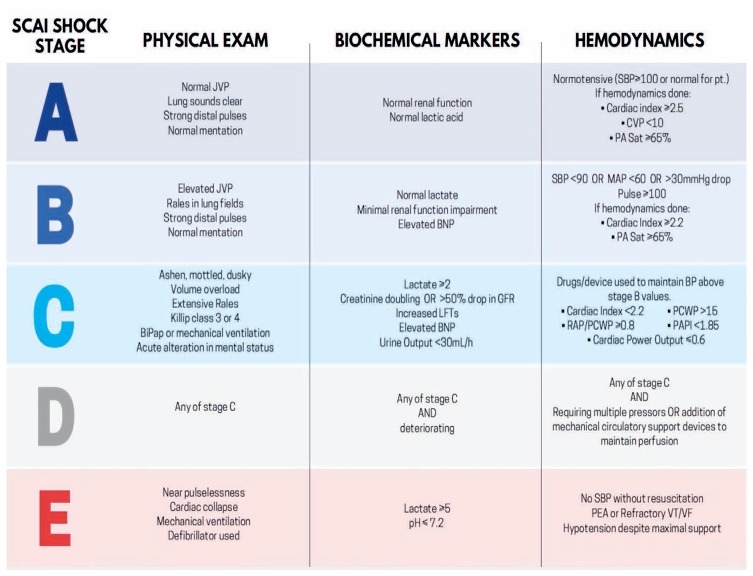
The recently released Society for Coronary Angiography and Intervention schema for categorizing patients with cardiogenic shock. Reprinted with permission.8 JVP: jugular venous pressure; SBP: systolic blood pressure; CVP: central venous pressure; PA Sat: pulmonary artery oxygen saturation; BNP: brain natriuretic peptide; RAP: right atrial pressure; PCWP: pulmonary capillary wedge pressure; PAPI: pulmonary artery pulsatility index; PEA: pulseless electrical activity; VT/VF: ventricular tachycardia/ventricular fibrillation.
Risk Assessment and Prognosis
Prognosis can be estimated by various risk scores that are easy to calculate and provide insight into the pathophysiology of CGS. Two recently investigated scores are the IABP-SHOCK and CardShock scores. The IABP-SHOCK score estimates 30-day mortality using six variables: age > 73 years, history of stroke, serum lactate ≥ 5 mmol/L, serum creatinine ≥ 1.5 mg/dL, serum glucose ≥ 191 mg/dL on admission, and thrombolysis in myocardial infarction (TIMI) score < 3 following percutaneous coronary intervention. Low (0–2), intermediate (3–4), and high scores (5–9) were associated with 23.8%, 49.2, and 76.6% 30-day mortality, respectively. The CardShock cohort produced a similar risk score with seven variables that are predictive of mortality within 12 days. Score components include a history of prior coronary artery bypass surgery or MI, age > 75 years, left ventricular ejection fraction ≤ 40%, serum lactate level (0 points < 2 mmol/L, 1 point = 2–4 mmol/L, 2 points > 4 mmol/L), estimated glomerular filtration rate (0 points > 60 mL/min/1.73 m2, 1 point = 30–60 mL/min/1.73 m2, 2 points < 30 mL/min/1.73 m2), and CGS in the context of AMI. These variables are combined to compute a score ranging from 0 to 9 points. When categorized into low (0–3), intermediate (4–6), and high (7–9) groups, the score is associated with a 12-day mortality ranging from 8.7% to 36% to 77% in the respective groups. Notably, both risk scores only apply to CGS in the context of AMI.
Etiology
A multitude of processes can lead to ADHF and CGS. AMI complicated by cardiogenic shock accounts for nearly 80% of CGS cases and may result from both ST-segment elevation MI and non–ST-segment elevation MI. Despite advances in treatment and revascularization, CGS remains a lethal complication of MI, with mortality rates ranging from 38% to 65% in different cohorts.7,9,10 In the contemporary era of revascularization where mechanical complications such as ventricular septal, free wall, or papillary muscle rupture are rare, post-MI hypotension and shock are more commonly caused by a reduction in cardiac output (due to loss of myocardial contractility) or by profound vasodilation triggered by inflammatory cytokines (such as TNF-α and nitric oxide).11–14
Noncoronary causes of CGS occur as a consequence of primary myocardial, valvular, electrical, or pericardial abnormalities. The prevalence of these various causes of CGS has been estimated as follows: progression of chronic heart failure (11–30%), valvular and other mechanical causes (6%), stress-induced/Takotsubo cardiomyopathy (2%), and acute myocarditis (2%).5,15 Patients with chronic heart failure who progress to ADHF and eventually CGS may differ from patients with CGS related to acute coronary syndrome. Chronic upregulation of the renin-angiotensin-aldosterone axis and increased circulating catecholamines observed in these settings induce vasoconstriction and ventricular remodeling, creating a different phenotypic substrate at the time of CGS presentation.16 Indeed, the prognosis of patients with CGS in the setting of AMI differs from that of patients progressing from chronic heart failure.17
FUNDAMENTALS OF CARDIOVASCULAR HEMODYNAMICS
Regardless of the underlying cause of CGS, its pathophysiology, hemodynamics, and myocardial energetics are readily explained through the ventricular pressure-volume (PV) diagram.18,19 This construct is also helpful to better understand the impact of pharmacologic and device-based therapies on hemodynamics and myocardial energetics. The PV loop depicts events occurring during a single cardiac cycle and provides a framework to visually represent the derangements of decompensated heart failure and CGS (Figure 3 A).19 Under normal conditions, the PV loop is roughly trapezoidal with a rounded top. The four sides of the loop represent the four phases of the cardiac cycle: (1) isovolumic contraction, (2) ejection, (3) isovolumic relaxation, and (4) filling. The width of the loop represents the stroke volume while the height of the loop represents the systolic blood pressure.
Figure 3.
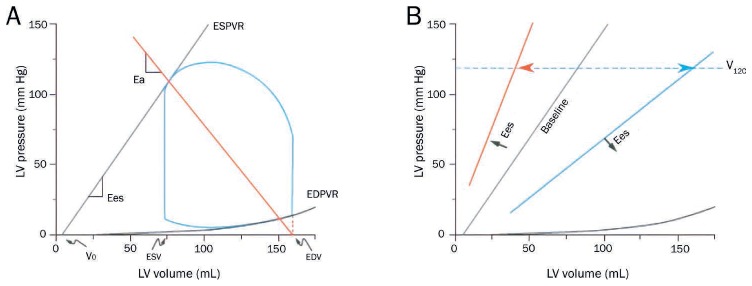
(A) The normal pressure-volume loop is bounded by the end-systolic pressure-volume relationship (ESPVR) and end-diastolic pressure-volume relationship (EDPVR). ESPVR is approximately linear with slope, Ees, and volume-axis intercept, Vo. Effective arterial elastance (Ea) is the slope of the line extending from the end-diastolic volume (EDV) point on the volume axis through the end-systolic pressure-volume point of the loop. (B) The ESPVR shifts with changes in ventricular contractility, which can be a combination of changes in Ees and Vo. Changes in contractility can be indexed by V120, the volume at which the ESPVR intersects 120 mm Hg. Reprinted with permission.19
The loop falls within the boundaries of the end-systolic pressure-volume relationship (ESPVR) and the end-diastolic pressure-volume relationship (EDPVR). The ESPVR models the relationship between end-systolic pressure and volume (Pes and Ves, respectively) and is reasonably linear with slope Ees and volume-axis intercept Vo (Pes = Ees [Ves-Vo]). Vo is the volume of blood required to fill the ventricle before observing a rise in ventricular pressure (ie, the unstressed volume). Shifts of the ESPVR occur with changes in ventricular contractility (Figure 3 B).18,20 Increases in contractility are associated with upward/leftward shifts of the ESPVR and ideally result in an increase of Ees and little change in Vo. Accordingly, Ees is considered a load-independent index of ventricular contractility.
The EDPVR indexes the extent of relaxation and indicates the passive ventricular properties when all actinmyosin bonds are uncoupled and myocytes are completely relaxed. The EDPVR is nonlinear and can be described by equations such as P=β(eα(V-Vo) − 1) or P=βVα, where constants α and β relate to mechanical properties and structural features of the ventricle and extracellular matrix. Shifts of the EDPVR can occur in pathological states such as restrictive cardiomyopathy, hypertrophic cardiomyopathy, and infiltrative diseases (leftward shifts indicative of diastolic dysfunction) or in all forms of dilated cardiomyopathy (rightward shifts indicative of remodeling).
The effective arterial elastance (Ea) is the slope of the line connecting the enddiastolic volume on the volume axis to the end-systolic pressure-volume point of the PV loop (Figure 3 A).21 Ea is related to total peripheral resistance (TPR) and heart rate (HR): Ea ≈ TPR×HR. The point of intersection between the ESPVR and the Ea line determines the point of equilibrium between pressures, flows, and stroke volume in the ventricle and vasculature. This concept that connects the ventricle to the vasculature, referred to as ventricular-vascular coupling, underlies the science describing how stroke volume, mean arterial pressure (MAP), and other key cardiovascular parameters are determined by preload, afterload, contractility, and HR.
In addition to providing a platform for explaining ventricular mechanics, the PV diagram also serves as a construct for understanding the determinants of myocardial oxygen consumption (MVO2, Figure 4).22,23 The area inside the loop is the stroke work, estimated as the product of stroke volume and MAP. Cardiac power output (CPO), the product of stroke work and HR, has been used as an index of the severity of CGS that inversely correlates with in-hospital mortality. Improvements in CPO have also been used to quantify the effectiveness of CGS therapies.
Figure 4.
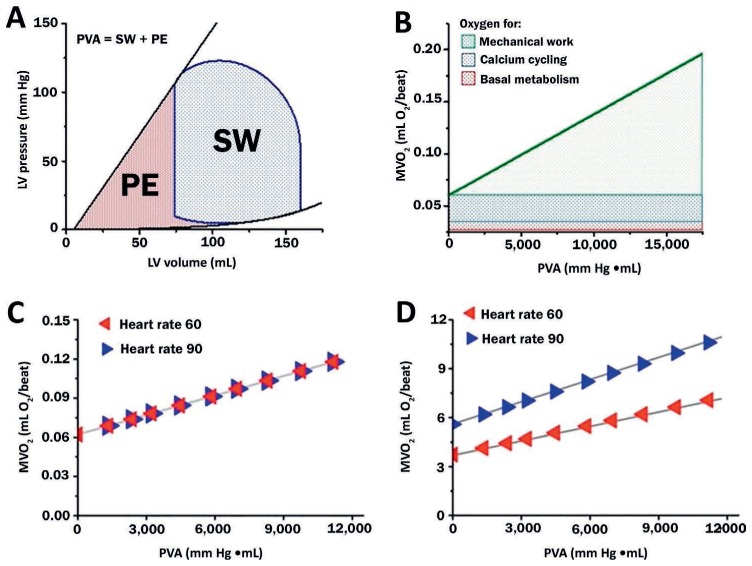
(A) Pressure-volume area (PVA) is the sum of stroke work (SW, the area bounded within the PV loop) and potential energy (PE, area bounded by the end-systolic pressure-volume relationship and end-diastolic pressure-volume relationship). (B) Myocardial oxygen consumption (MVO2) is linearly correlated with PVA and is divided into 3 major components. (C) Heart rate has a minimal impact on the beat-to-beat relationship between PVA and MVO2, (D) but these small differences are amplified when considering the relationship between PVA and MVO2 per minute. Burkhoff D, Dickstein ML, Schleicher T. Harvi – Online. Retrieved from http://harvi.online. Date of access: 2019 Nov 21. LV: left ventricular
MVO2 per beat is linearly related to the ventricular pressure-volume area (PVA); PVA is the sum of the external stroke work (SW, the area inside the PV loop) and the potential energy (PE) (Figure 4). PE is the area bounded by ESPVR, EDPVR, and the diastolic portion of the PV loop. It represents the residual energy stored in the myofilaments at the end of systole that was not converted to external work. Total MVO2 per beat consists of the oxygen required to support basal metabolism, calcium cycling with each beat, and actin-myosin uncoupling during each beat (Figure 4 B). When contractility is increased, the slope of the MVO2-PVA line is unchanged but the intercept increases; this is because increases in contractility are generally due to increased calcium cycling. Conversely, when contractility decreases, the intercept of the MVO2-PVA line decreases and the slope is unchanged. Changes in HR do not significantly affect the relationship between PVA and MVO2 per beat (Figure 4 C). However, the relationship between MVO2 per minute (which is obtained by multiplying MVO2 per beat by HR) and PVA is highly influenced by HR (Figure 4 D).
Cardiogenic Shock and the Pressure-Volume Loop
The PV loop can be particularly helpful for depicting and characterizing the pathophysiology of decompensated heart failure (Figure 5 A).23 For example, in the immediate aftermath of an MI, the ESPVR shifts downward and rightward, signifying the abrupt reduction of ventricular contractility (Figure 5 B). This reduction is accompanied by profound declines in blood pressure (indexed by the height of the PV loop), SV, and cardiac output, while small elevations of left ventricular end-diastolic pressure and PCWP may also be seen.
Figure 5.
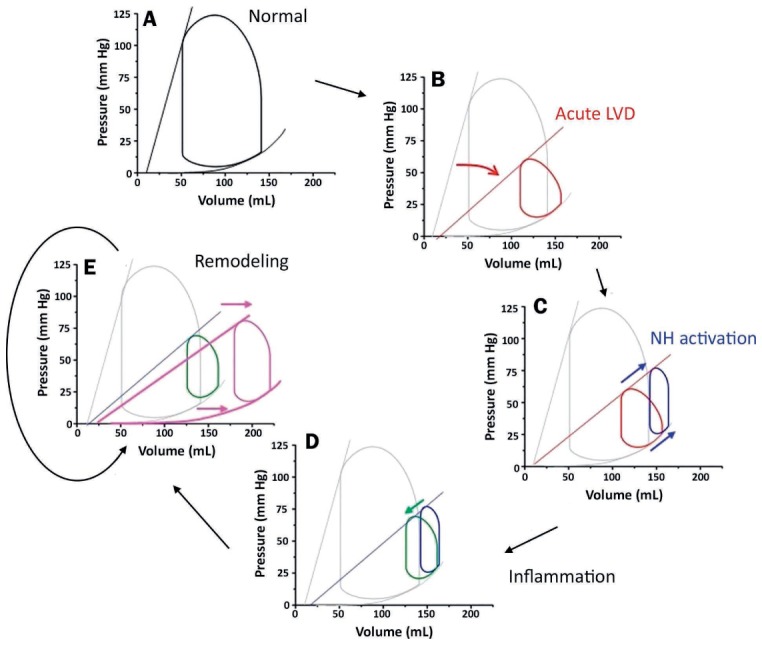
The pathophysiology of cardiogenic shock illustrated by pressure-volume (PV) loops. (A) The normal PV loop; (B) the PV loop reflecting changes following an acute myocardial infarction (red); (C) changes caused by autonomic response to decreased contractility (blue); (D) changes caused by release of inflammatory mediators (green); (E) the PV loop reflecting manifestations of cardiac remodeling (pink) with changes in both the end-systolic and end-diastolic pressure-volume relationships. Reprinted with permission.23
The first phase of compensatory responses to the reduction in ventricular contractility (neurohormonal activation) attempts to maintain MAP (Figure 5 C). The process begins when baroreceptors in the great vessels recognize the reduction in MAP and (1) activate efferent autonomic nerve fibers directed to cardiac and vascular structures as well as (2) stimulate the release of catecholamines from the adrenal gland. Heart rate, and to a lesser extent contractility, increase as a result of enhanced autonomic tone, and TPR increases as a byproduct of catecholamine-induced vasoconstriction. These factors also induce venoconstriction, functionally shifting blood from unstressed, high-capacitance reservoirs in the splanchnic circulation to low-capacitance vessels. This increases the functional circulating blood volume and raises central venous and pulmonary venous pressures.24 In aggregate, these effects increase blood pressure but at the expense of causing further rightward shifts of the PV loop toward higher enddiastolic volumes and pressures.
The next phase of compensatory responses hinges on whether or not there is an accompanying inflammatory process. Inflammatory cytokines also reduce TPR, counteracting many of the neurohormonal derangements described above (Figure 5 D). Thus, the net effect of CGS on the PV loop (based on a patient with a severe MI) is one in which the ESPVR is flatter and the PV loop is narrower, shorter, and shifted to the right. These findings explain the clinical picture encountered in post-MI CGS, where patients have reduced contractility, smaller SV, lower BP, and elevated left ventricular (LV) end-diastolic volume. TPR may be normal, elevated or decreased depending on the balance between autonomic-mediated vasoconstriction and inflammation-mediated vasodilation.
With time, these mechanisms drive ventricular remodeling. This in turn shifts the EDPVR towards larger volumes as surviving myocytes hypertrophy (elongate and widen) and extracellular matrix turnover increases, allowing reorganization of myocytes (Figure 5 E). EDPVR shifting also results in concomitant rightward shifts of the ESPVR, further worsening LV function. The process of remodeling is progressive as long as the conditions that initiate remodeling persist unabated by pharmacologic or mechanical interventions.
Right Ventricular Function and Cardiogenic Shock
Right ventricular (RV) dysfunction can contribute to the physiology of CGS in three critical ways: (1) in the absence of LV dysfunction, as in the case of RV infarction from a proximal right coronary artery obstruction; (2) in the context of increased pulmonary afterload due to increases in PCWP and/or pulmonary vascular resistance; and (3) in the setting of primary LV dysfunction, where the interventricular septum's contribution to RV function is diminished. When RV dysfunction complicates LV dysfunction, clinicians need to consider supporting the RV so that the LV has sufficient preload to maintain adequate cardiac output. Right ventricular dysfunction is a strong predictor of mortality, highlighting the key role it plays in CGS.25–28
Right ventricular dysfunction can also be depicted using the PV loop framework, but the normal RV PV loop differs from the LV PV loop in a number of important ways (Figure 6). First, the RV has its own ESPVR and EDPVR that provide boundaries for the loop. Importantly, the slope of the RV ESPVR (Ees) is normally one-fifth to one-seventh that of the LV. However, the EDPVRs are similar because the two chambers are similar in size. Second, the RV PV loop does not exhibit prominent isovolumic periods because diastolic pulmonary pressure can decay almost to RV end-diastolic pressure. Third, the RV PV loop has a more dome-shaped top, and the left upper region of the loop does not form a sharp corner. With RV dysfunction underlying CGS, the RV PV loop begins to resemble the LV PV loop in CGS, shifting to the right and becoming narrower and shorter.
Figure 6.
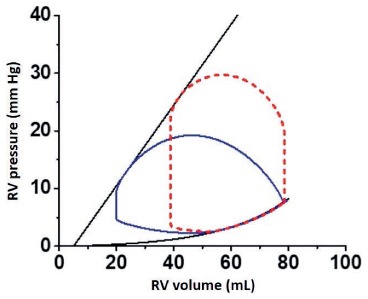
The normal right ventricular (RV) pressure-volume (PV) loop (solid blue line) compared to the normal left ventricular (LV) PV loop (red dashed line). The slope of the RV end-systolic pressure-volume relationship is shallower and systolic pressures are less than those seen in the LV PV loop. The right and left ventricular end-diastolic pressure-volume relationships are similar. Burkhoff D, Dickstein ML, Schleicher T. Harvi – Online. Retrieved from http://harvi.online. Date of access: 2019 Nov 21.
SUMMARY
Cardiogenic shock is a complex heterogeneous disorder characterized by insufficient cardiac output or deleterious compensatory adjustments invoked to help restore normal cardiac output. Careful clinical assessment, with a detailed physical examination and a pulmonary arterial catheter to evaluate intracardiac filling pressures, is imperative to facilitate risk stratification and to guide therapeutic choice and optimization in this vulnerable population. Assessment also helps classify patients according to the degrees of CGS in the SCAI ABCDE taxonomy. Furthermore, although PV loops cannot be assessed in clinical practice without invasive testing, clinicians and researchers can reference the PV loop framework as a complementary tool to understand the physiological derangements underlying CGS and identify which hemodynamic parameters (ie, contractility, lusitropy, preload, and afterload) can be targeted to resolve CGS.
KEY POINTS
Cardiogenic shock (CGS) describes a hemodynamic state in which cardiac output is insufficient to satisfy end-organ perfusion requirements. It can also occur when perfusion requirements are met in the short term by activating compensatory mechanisms that are harmful and unsustainable.
Although acute myocardial infarction is the most common cause of CGS, there is an increasing proportion of CGS cases attributed to acute decompensation of chronic heart failure.
Risk stratification of patients with CGS is essential. The CardShock and IABP-SHOCK II scores are useful adjuncts for classifying patients according to the Society for Coronary Angiography and Intervention's stages of cardiogenic shock.
The normal pressure-volume loop visually depicts ventricular mechanics and ventriculo-vascular interactions on a beat-to-beat basis. The loop is bound by two fundamental curves—the end-systolic pressure-volume relationship and the end-diastolic pressure-volume relationship—that represent properties such as contractility, lusitropy, preload, and afterload.
The pressure-volume loop during CGS, irrespective of etiology, is narrowed and shifted down and to the right relative to the loop under normal conditions, reflecting a decline in stroke volume and contractility and an increase in left ventricular end-diastolic volume.
Footnotes
Conflict of Interest Disclosure:
Dr. Burkhoff conducts research funded by an unrestricted institutional educational grant from Abiomed.
REFERENCES
- 1.Cooper LB, Mentz RJ, Stevens SR et al. Hemodynamic Predictors of Heart Failure Morbidity and Mortality: Fluid or Flow? J Card Fail. 2016 Mar;22(3):182–9. doi: 10.1016/j.cardfail.2015.11.012. [DOI] [PMC free article] [PubMed] [Google Scholar]
- 2.Tsagalou EP, Kanakakis J, Anastasiou-Nana MI et al. Hemodynamic effects of levosimendan in acute myocardial infarction complicated by cardiogenic shock and high systemic vascular resistance. Acute Card Care. 2009;11(2):99–106. doi: 10.1080/17482940902807286. [DOI] [PubMed] [Google Scholar]
- 3.Fincke R, Hochman JS, Lowe AM et al. Cardiac power is the strongest hemodynamic correlate of mortality in cardiogenic shock: a report from the SHOCK trial registry. J Am Coll Cardiol. 2004 Jul 21;44(2):340–8. doi: 10.1016/j.jacc.2004.03.060. [DOI] [PubMed] [Google Scholar]
- 4.Binanay C, Califf RM, Hasselblad V et al. Evaluation study of congestive heart failure and pulmonary artery catheterization effectiveness: the ESCAPE trial. JAMA. 2005 Oct 5;294(13):1625–33. doi: 10.1001/jama.294.13.1625. [DOI] [PubMed] [Google Scholar]
- 5.van Diepen S, Katz JN, Albert NM et al. Contemporary Management of Cardiogenic Shock: A Scientific Statement From the American Heart Association. Circulation. 2017 Oct 17;136(16):e232–e268. doi: 10.1161/CIR.0000000000000525. American Heart Association Council on Clinical C, Council on C, Stroke N, Council on Quality of C, Outcomes R and Mission L. [DOI] [PubMed] [Google Scholar]
- 6.Hochman JS, Sleeper LA, Webb JG et al. Early revascularization and long-term survival in cardiogenic shock complicating acute myocardial infarction. JAMA. 2006 Jun 7;295(21):2511–5. doi: 10.1001/jama.295.21.2511. [DOI] [PMC free article] [PubMed] [Google Scholar]
- 7.Thiele H, Zeymer U, Neumann FJ et al. Intraaortic balloon support for myocardial infarction with cardiogenic shock. N Engl J Med. 2012 Oct 4;367(14):1287–96. doi: 10.1056/NEJMoa1208410. [DOI] [PubMed] [Google Scholar]
- 8.Baran DA, Grines CL, Bailey S et al. SCAI clinical expert consensus statement on the classification of cardiogenic shock: This document was endorsed by the American College of Cardiology (ACC), the American Heart Association (AHA), the Society of Critical Care Medicine (SCCM), and the Society of Thoracic Surgeons (STS) in April 2019. Catheter Cardiovasc Interv. 2019 Jul 1;94(1):29–37. doi: 10.1002/ccd.28329. [DOI] [PubMed] [Google Scholar]
- 9.Goldberg RJ, Spencer FA, Gore JM, Lessard D, Yarzebski J. Thirty-year trends (1975 to 2005) in the magnitude of, management of, and hospital death rates associated with cardiogenic shock in patients with acute myocardial infarction: a population-based perspective. Circulation. 2009 Mar 10;119(9):1211–9. doi: 10.1161/CIRCULATIONAHA.108.814947. [DOI] [PMC free article] [PubMed] [Google Scholar]
- 10.De Luca G, Parodi G, Sciagra R et al. Preprocedural TIMI flow and infarct size in STEMI undergoing primary angioplasty. J Thromb Thrombolysis. 2014 Jul;38(1):81–6. doi: 10.1007/s11239-013-0977-x. [DOI] [PubMed] [Google Scholar]
- 11.Akiyama K, Suzuki H, Grant P, Bing RJ. Oxidation products of nitric oxide, NO2 and NO3, in plasma after experimental myocardial infarction. J Mol Cell Cardiol. 1997 Jan;29(1):1–9. doi: 10.1006/jmcc.1996.9998. [DOI] [PubMed] [Google Scholar]
- 12.Wildhirt SM, Dudek RR, Suzuki H, Bing RJ. Involvement of inducible nitric oxide synthase in the inflammatory process of myocardial infarction. Int J Cardiol. 1995 Jul;50(3):253–61. doi: 10.1016/0167-5273(95)02385-a. [DOI] [PubMed] [Google Scholar]
- 13.Frangogiannis NG, Smith CW, Entman ML. The inflammatory response in myocardial infarction. Cardiovasc Res. 2002 Jan;53(1):31–47. doi: 10.1016/s0008-6363(01)00434-5. [DOI] [PubMed] [Google Scholar]
- 14.Nian M, Lee P, Khaper N, Liu P. Inflammatory cytokines and postmyocardial infarction remodeling. Circ Res. 2004 Jun 25;94(12):1543–53. doi: 10.1161/01.RES.0000130526.20854.fa. [DOI] [PubMed] [Google Scholar]
- 15.Harjola VP, Lassus J, Sionis A et al. Clinical picture and risk prediction of short-term mortality in cardiogenic shock. Eur J Heart Fail. 2015 May;17(5):501–9. doi: 10.1002/ejhf.260. [DOI] [PubMed] [Google Scholar]
- 16.Shah M, Ali V, Lamba S, Abraham WT. Pathophysiology and clinical spectrum of acute congestive heart failure. Rev Cardiovasc Med. 2001;2(Suppl 2):S2–6. [PubMed] [Google Scholar]
- 17.Berg DD, Bohula EA, van Diepen S et al. Epidemiology of Shock in Contemporary Cardiac Intensive Care Units. Circ Cardiovasc Qual Outcomes. 2019 Mar;12(3) doi: 10.1161/CIRCOUTCOMES.119.005618. e005618. [DOI] [PMC free article] [PubMed] [Google Scholar]
- 18.Burkhoff D, Mirsky I, Suga H. Assessment of systolic and diastolic ventricular properties via pressure-volume analysis: a guide for clinical, translational, and basic researchers. Am J Physiol Heart Circ Physiol. 2005 Aug;289(2):H501–12. doi: 10.1152/ajpheart.00138.2005. [DOI] [PubMed] [Google Scholar]
- 19.Burkhoff D, Sayer G, Doshi D, Uriel N. Hemodynamics of Mechanical Circulatory Support. J Am Coll Cardiol. 2015 Dec 15;66(23):2663–2674. doi: 10.1016/j.jacc.2015.10.017. [DOI] [PubMed] [Google Scholar]
- 20.Sagawa K. The end-systolic pressure-volume relation of the ventricle: definition, modifications and clinical use. Circulation. 1981 Jun;63(6):1223–7. doi: 10.1161/01.cir.63.6.1223. [DOI] [PubMed] [Google Scholar]
- 21.Sunagawa K, Maughan WL, Burkhoff D, Sagawa K. Left ventricular interaction with arterial load studied in isolated canine ventricle. Am J Physiol. 1983 Nov;245(5 Pt 1):H773–80. doi: 10.1152/ajpheart.1983.245.5.H773. [DOI] [PubMed] [Google Scholar]
- 22.Suga H. Ventricular energetics. Physiol Rev. 1990 Apr;70(2):247–77. doi: 10.1152/physrev.1990.70.2.247. [DOI] [PubMed] [Google Scholar]
- 23.Furer A, Wessler J, Burkhoff D. Hemodynamics Cardiogenic Shock. Interv Cardiol Clin. 2017 Jul;6(3):359–371. doi: 10.1016/j.iccl.2017.03.006. [DOI] [PubMed] [Google Scholar]
- 24.Burkhoff D, Tyberg JV. Why does pulmonary venous pressure rise after onset of LV dysfunction: a theoretical analysis. Am J Physiol. 1993 Nov;265(5 Pt 2):H1819–28. doi: 10.1152/ajpheart.1993.265.5.H1819. [DOI] [PubMed] [Google Scholar]
- 25.Miszalski-Jamka T, Klimeczek P, Tomala M et al. Extent of RV dysfunction and myocardial infarction assessed by CMR are independent outcome predictors early after STEMI treated with primary angioplasty. JACC Cardiovasc Imaging. 2010 Dec;3(12):1237–46. doi: 10.1016/j.jcmg.2010.09.018. [DOI] [PubMed] [Google Scholar]
- 26.Antoni ML, Scherptong RW, Atary JZ et al. Prognostic value of right ventricular function in patients after acute myocardial infarction treated with primary percutaneous coronary intervention. Circ Cardiovasc Imaging. 2010 May;3(3):264–71. doi: 10.1161/CIRCIMAGING.109.914366. [DOI] [PubMed] [Google Scholar]
- 27.Zornoff LA, Skali H, Pfeffer MA et al. Right ventricular dysfunction and risk of heart failure and mortality after myocardial infarction. J Am Coll Cardiol. 2002 May 1;39(9):1450–5. doi: 10.1016/s0735-1097(02)01804-1. [DOI] [PubMed] [Google Scholar]
- 28.Mehta SR, Eikelboom JW, Natarajan MK et al. Impact of right ventricular involvement on mortality and morbidity in patients with inferior myocardial infarction. J Am Coll Cardiol. 2001 Jan;37(1):37–43. doi: 10.1016/s0735-1097(00)01089-5. [DOI] [PubMed] [Google Scholar]


