Abstract
Tonotopy is a key anatomical feature of the vertebrate auditory system, but little is known about the mechanisms underlying its development. Since date of birth of a neuron correlates with tonotopic position in the cochlea, we investigated if it also correlates with tonotopic position in the cochlear nucleus. In the cochlea, spiral ganglion neurons are organized in a basal to apical progression along the length of the cochlea based on birthdates, with neurons in the base (responding to high-frequency sounds) born early around mouse embryonic day (E) 9.5-10.5, and those in the apex (responding to low-frequency sounds) born late around E12.5 to 13.5. Using a low-dose thymidine analog incorporation assay, we examine whether cochlear nucleus neurons are arranged in a spatial gradient according to their birthdates. Most cochlear nucleus neurons are born between E10.5 to E13.5, with a peak at E12.5. A second wave of neuron birth was observed in the dorsal cochlear nucleus beginning on E14.5 and lasts until E18.5. Large excitatory neurons were born in the first wave and small local circuit neurons were born in the second. No spatial gradient of cell birth was observed in the dorsal cochlear nucleus. In contrast, neurons in the anteroventral cochlear nucleus (AVCN) were found to be arranged in a dorsal to ventral progression according to their birthdates, which is aligned with the tonotopic axis. Most of these AVCN neurons are endbulb-innervated bushy cells. The correlation between birthdate and tonotopic position suggests testable mechanisms for specification of tonotopic position.
Keywords: auditory system, cochlear nucleus, tonotopy, neurogenesis, neuronal birthdates, RRID: AB_305426, RRID: AB_2532109, RRID: AB_11212161, RRID: AB_90772, RRID: AB_941703, RRID: AB_887878
Graphic Abstract
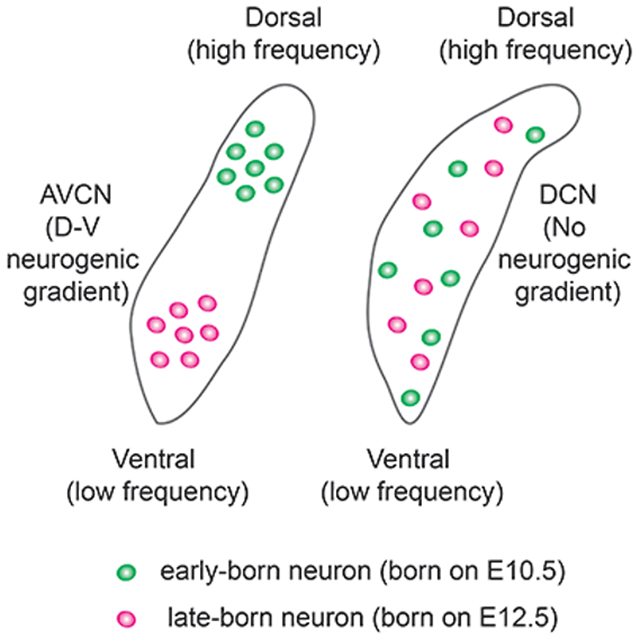
We investigated whether the birthdate of neurons in the cochlear nucleus defines their tonotopic positions. We found a dorsal to ventral neurogenic gradient in the anteroventral cochlear nucleus, which is in alignment with the tonotopic axis. In contrast, no neurogenic gradient can be observed in the dorsal cochlear nucleus.
INTRODUCTION
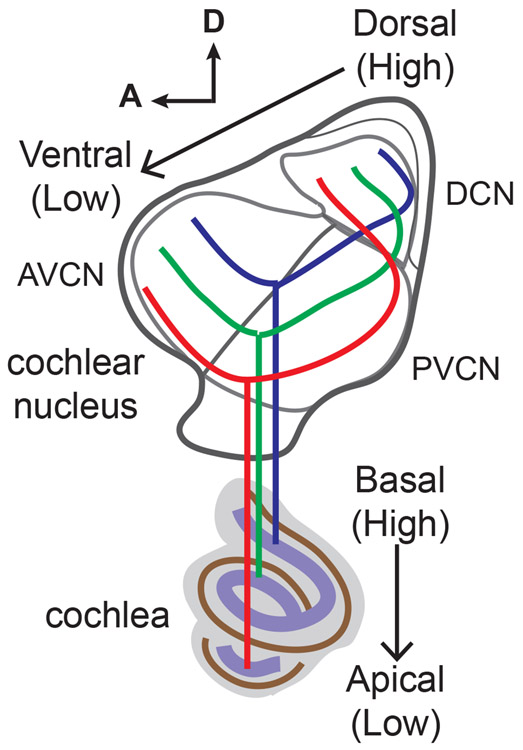
The most fundamental organizing principle of auditory circuits is tonotopy, in which cells at various levels of the auditory pathway are topographically arranged by their responses to different sound frequencies (Kandler, Clause, & Noh, 2009). Tonotopy allows animals to separate a complex sound into its frequency components, which forms the basis for sound discrimination. In mammals, tonotopic mapping first originates in the coordinated organization of auditory hair cells and spiral ganglion neurons (SGNs) that relay sound information from the hair cells to the brain: both are distributed along the turns of the cochlea and encode high to low frequency sounds from the basal to apical axis (Liberman, 1982). The central branch of each individual SGN afferent fiber then bifurcates and innervates three subdivisions of the brainstem cochlear nucleus (CN) (Rouiller, Cronin-Schreiber, Fekete, & Ryugo, 1986) (Figure 1). The descending branch innervates the dorsal cochlear nucleus (DCN), and, in passing, the posteroventral cochlear nucleus (PVCN), and makes conventional bouton contacts with a variety of target neurons. Neurons in the DNC then integrate acoustic information with inputs from somatosensory and vestibular sources and process monaural spectral cues for localizing sounds (Trussell & Oertel, 2018). In contrast, the ascending branch projects to the anteroventral cochlear nucleus (AVCN) and elaborates an extraordinarily large synaptic terminal, known as the endbulb of Held, on the bushy cell (Ryugo & Fekete, 1982; Yu & Goodrich, 2014). Bushy cells then project bilaterally to the superior olivary complex, where neurons use binaural intensity and timing cues to localize sound along the azimuth (Yu & Goodrich, 2014). In each of three subdivisions of the CN, the neuronal connectivity is also tonotopically organized (Fekete, Rouiller, Liberman, & Ryugo, 1984; Muniak et al., 2013; Ryugo & May, 1993; Ryugo & Parks, 2003) (Figure 1). SGNs responding to high-frequency sounds in the base of the cochlea project their central fibers to dorsal regions of the CN, while SGNs that convey information of low-frequency sounds in the cochlear apex send their fibers to ventral portions of the CN, forming isofrequency bands where nearby target neurons in the CN have similar frequency responses. Sound information is then further relayed from the CN to midbrain, thalamus, and cortex, where tonotopic maps are maintained at all levels of the pathway (Kandler et al., 2009). Despite its importance in auditory function, the mechanisms that underlie the establishment of tonotopy are poorly understood. For example, how auditory neurons that respond to different sound frequencies acquire their positional identities along the tonotopic axis remains elusive.
FIGURE 1. Schematic of the tonotopic arrangement of neuronal connectivity between the cochlea and three subdivisions of the cochlear nucleus.
In many regions of the nervous system, the "birthdate" of a neuron (neuron undergoes terminal mitosis and start differentiation) can predict its final position and functional identity. For example, cortical neurons in the neocortex are born in a birthdate-dependent inside-out manner, where the firstborn neurons are located in the deepest layers and later born neurons travel through the older cells and lie in more superficial layers (Molyneaux, Arlotta, Menezes, & Macklis, 2007). The cell morphology, connectivity, and electrical properties of individual cortical neurons are, therefore, defined in part by their final layer location (He, Li, Ge, Yu, & Shi, 2015; Oishi et al., 2016). In the mouse cochlea, the birthdates of SGNs also predict their positional identities and functional distinctions. High-frequency responsive neurons in the base are born early around mouse embryonic day (E) 9.5-10.5 and low-frequency responsive neurons in the apex are born later around E12.5 to 13.5 (Koundakjian, Appler, & Goodrich, 2007; Matei et al., 2005; Ruben, 1967). It is unclear, though, whether neurogenesis in the central auditory system also adopts a similar principle, with neurons that respond to different frequency sounds being generated at different stages.
During development, most CN neurons are derived from the rhombic lip of rhombomeres 2 to 5 (Di Bonito et al., 2013; Fujiyama et al., 2009; Ivanova & Yuasa, 1998; Maricich et al., 2009; Wang, Rose, & Zoghbi, 2005), migrate to each CN subdivision, and organize into isofrequency laminae according to their frequency responses (Ryugo & Parks, 2003). Neurons that respond to high-frequency sounds are located in the dorsal portion of each subdivision and neurons that are activated by low-frequency sounds are located in the ventral part. It is unclear how functionally distinct CN neurons acquire their positional identities along the tonotopic axis. One possibility is that these neurons may use a cellular mechanism through which the birthdate of neurons determines their positions along the tonotopic axis, similar to the strategy used by cortical neurons and cochlear SGNs. Here we test this possibility by labeling newborn CN neurons using a thymidine analog incorporation assay and examine whether CN neurons are arranged tonotopically according to their birthdates. We found that neurons in the CN are mostly generated between E10.5 to E13.5 but some DCN neurons arise in a second wave of neurogenesis from E14.5 to E18.5. No spatial gradient of the cell birthdate was observed in the DCN and early and late born cells are intermingled. In contrast, cells of the AVCN are arranged in a dorsal to ventral (D-V) progression according to their birthdates, which is in alignment with the tonotopic axis. Most of these AVCN cells are endbulb-innervated bushy cells. Our findings suggest that in some regions of the central auditory pathway, the tonotopic position of neurons may be partly specified by their birthdates.
MATERIALS AND METHODS
Mice
All animal experiments in this study have been approved by the Institutional Animal Care and Use Committee at Loyola University Chicago (Project #1926). For timed pregnancies, male and female mice were put together at 5 PM and checked for the presence of a vaginal plug the following morning at 9 AM. Plugs were assumed to occur at midnight so noon on the day of a plug was defined as embryonic day 0.5 (E0.5).
Birthdating neurons with 5-bromo-2’-deoxyuridine (BrdU) and/or 5-ethyl-2’-deoxyuridine (EdU)
Pregnant mice were injected with a single dose of BrdU (10 μg/g body weight; Sigma) at the ages of E9.5, 10.5, 11.5, 12.5, 13.5, 14.5, 15.5, 16.5, 17.5 or 18.5. For BrdU/EdU double labeling, pregnant mice were injected sequentially with a single dose of EdU on E10.5 (2 μg/g body weight; Sigma) and BrdU (10 μg/g body weight) on E12.5. The Click-iT EdU Alexa Fluor Imaging reagents (Life Technologies) were used to detect EdU before primary antibody staining. BrdU labeling was detected by immunostaining using a BrdU antibody as previous described (Yu, Feltri, Wrabetz, Strickland, & Chen, 2005).
Immunohistochemistry and antibodies
Postnatal day (P) 0 mouse heads were fixed directly in 4% paraformaldehyde (PFA) in phosphate buffered saline (PBS) overnight at 4°C. P20 mice were anesthetized with ketamine and xylazine and then intravascularly perfused with 4% PFA in PBS. Brains were dissected out and then post-fixed in 4% PFA overnight at 4°C. For coronal brain sections, tissues were stepped through 10, 20 and 30% sucrose in PBS, embedded in NEG50 (Richard-Allan Scientific), and cryosectioned at 20 μm. Immunohistochemistry of tissue sections and whole mount cochleae were performed as previously described (Yu et al., 2013). Briefly, tissue sections or P0 cochleae were blocked for one hour at room temperature in a solution containing 5% normal donkey serum and 0.3% Triton X-100 in PBS. Samples were then incubated overnight at 4°C in primary antibodies diluted in the blocking solution, followed by Alexa Fluor-conjugated secondary antibodies at room temperature for one hour. For BrdU staining, tissue sections or P0 cochleae were first denatured with 2N HCl for 40 min at 37°C, neutralized in 0.1 m sodium borate, pH 8.5, for 20 min, and then proceeded by immunohistochemistry.
Primary antibodies used in this study are detailed in Table 1.
Table 1.
Primary Antibodies Used in This Study
| Antibody | Host | Antigen | Source | Cat No. | RIDD | Dilution |
|---|---|---|---|---|---|---|
| BrdU [BU1/75 (ICR1)] | Rat | Proprietary Immunogen | Abcam, Cambridge, MA | ab6326 | AB_305426 | 1:400 |
| NeuN (EPR12763) | Rabbit | Synthetic peptide of Human NeuN aa1-100 | Abcam, Cambridge, MA | ab177487 | AB_2532109 | 1:1000 |
| Neurofilament | Chicken | Purified bovine NF-H | Millipore, Billerica, MA | AB5539 | AB_11212161 | 1:2000 |
| NMDAR2B | Rabbit | C-Terminal Fusion Protein of the NMDAR2B | Millipore, Billerica, MA | AB1557P | AB_90772 | 1:1000 |
| GABA B Receptor | Mouse | Recombinant fragment of Human GABA B Receptor 1 aa52-151 | Abcam, Cambridge, MA | ab55051 | AB_941703 | 1:1000 |
| VGLUT 1 | Guinea pig | Recombinant protein of rat VGLUT1 aa456-560 | Synaptic Systems, Goettingen, Germany | 135 304 | AB_887878 | 1:2000 |
Confocal imaging
Confocal z-stacks from the cochlea or cochlear nucleus were obtained on an Olympus FluoView FV1000 using a 10X (NA: 0.4) or a 60X (NA: 1.42) oil-immersion objectives. A 512 × 512 binary image was acquired at the optimal step size in the Z axis. Maximum projections were obtained using the FV10-ASW 4.0 microscopy software (Olympus, Waltham, Massachusetts).
Quantification of the number and distribution of BrdU-positive neurons
At each age of BrdU injection, three animals were analyzed. The number of BrdU-positive neurons within three subdivisions of the cochlear nucleus (DCN, PVCN, and AVCN) was counted from the confocal images. The surface areas of the DCN, PVCN, and AVCN were measured using the ImageJ software (National Institutes of Health). The number of BrdU-positive neurons per unit area in each CN subdivision was obtained from dividing the cell number by the value of the surface area. For quantification of the distribution of BrdU-positive neurons, locations of BrdU-labeled neurons along the D-V axis of the DCN or AVCN were measured using the ImageJ software and then converted to a percentage by assigning the cell at the most dorsal extreme to 0% and the cell at the most ventral extreme to 100%.
Statistics
Quantitative data were analyzed with Excel (Microsoft, Redmond, WA) and GraphPad Prism (GraphPad, La Jolla, CA). The one-way analysis of variance (ANOVA) was used to determine if two sets of data are significantly different from each other. The difference between two means was considered significant if p<0.05. The results are expressed as means ± SEMs unless otherwise noted.
RESULTS
The regional spatial gradient of cell birthdates can be revealed by low dose administration of thymidine analogs
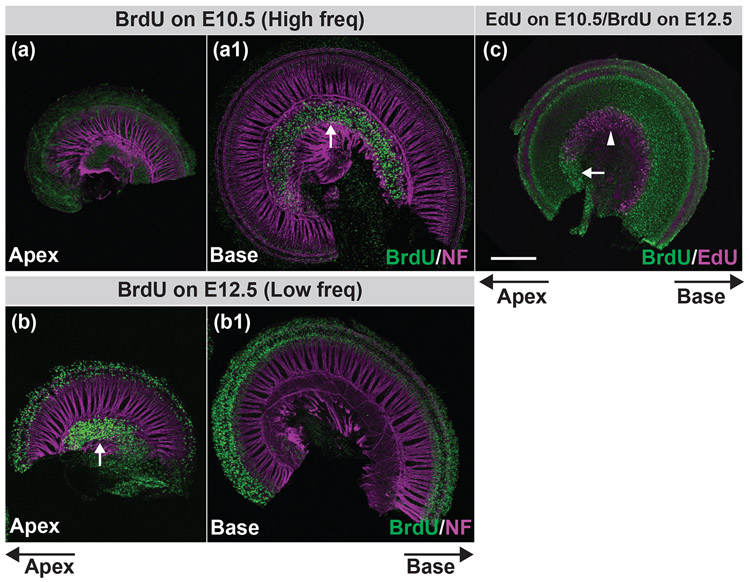
Bromodeoxyuridine (BrdU) and ethynyldeoxyuridine (EdU) are synthetic thymidine analogs which can be incorporated into the newly synthesized DNA of dividing cells. After a precursor cell undergoes terminal mitosis, the DNA nucleosides are stable and not exchanged anymore. Therefore, administration of a pulse of BrdU or EdU allows prospective labeling of terminally mitotic newborn cells (“birthdating”), but is diluted in cells that continue to divide. Most birthdating studies in mice use 100 μg BrdU/g bodyweight to saturate BrdU labeling (Duncan et al., 2006; Matei et al., 2005; Yu et al., 2005). We tried this concentration in the mouse cochlea and found that it is too high to reveal a regional gradient of SGN birth, as more than 50-60% of newborn SGNs in the cochlea were labeled by a single administration of BrdU (data not shown). To optimize the condition to reveal a basal-to-apical gradient of SGN birthdates in the cochlea, we tested a range of concentrations of BrdU and EdU and found that treating pregnant mice with a single dose of 10 μg BrdU and/or 2 μg EdU/g bodyweight gives the best result (Figure 2).
FIGURE 2. A basal to apical progression of SGN neurogenesis in the cochlea can be revealed by low dose thymidine analog labeling.
Pregnant mice were injected with BrdU on E10.5 (a, a1) or E12.5 (b, b1) or sequentially with EdU on E10.5 and BrdU on E12.5 (c). Confocal stacks from P0 cochlear whole-mounts were double stained for neurofilament (magenta) and BrdU (green) (a-b1) or EdU (magenta) and BrdU (green) (c). White arrows indicate BrdU-labeled SGNs and the white arrowhead indicates EdU-labeled SGNs. Apical and basal directions of the cochlear turn are indicated below the figures. Scale bar in (c) is 200 μm.
Pregnant mice were injected with a single low dose of BrdU on either E10.5 or E12.5 and P0 cochlear whole mount immunofluorescence staining was performed using antibodies against BrdU and neurofilament (for counterstaining of the cochlea). In animals treated with BrdU on E10.5, we found labeling of the SGNs only in the base but not in the apex of the cochlea (Figures 2a and a1). Conversely, BrdU-positive SGNs were only observed in the apex but not in the base of the cochlea from mice treated with BrdU on E12.5 (Figures 2b and b1). These observations are consistent with previous studies demonstrating that SGNs in the mouse exit the cell cycle sequentially from the base to apex between E9.5-10.5 to E12.5-13.5 (Koundakjian et al., 2007; Matei et al., 2005; Ruben, 1967). We also performed BrdU/EdU double labeling by injecting pregnant mice sequentially with EdU on E10.5 and BrdU on E12.5 and were able to demonstrate a clear separation of basal neurons born on E10.5 (magenta neurons in Figure 2c) from apical neurons born on E12.5 (green neurons in Figure 2c).
Neurons in the three subdivisions of the CN are mostly born between E10.5 to E13.5, but the DCN has a second wave of neurogenesis from E14.5 to E18.5
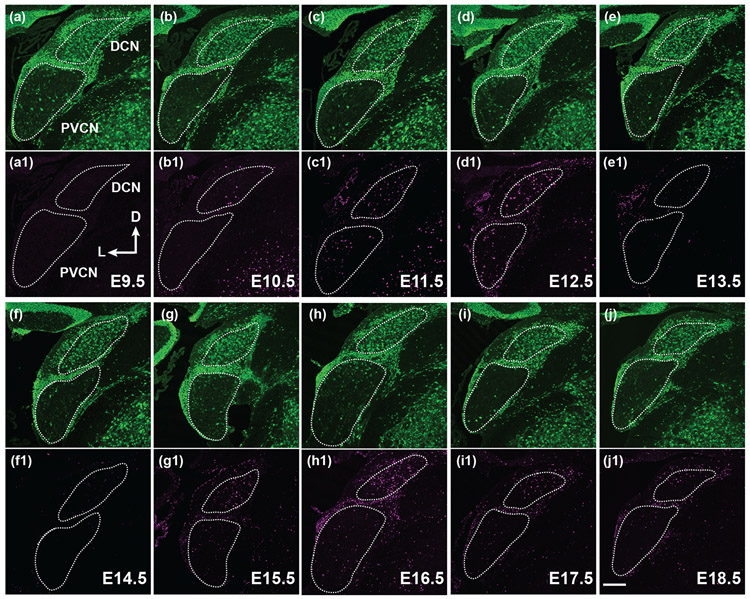
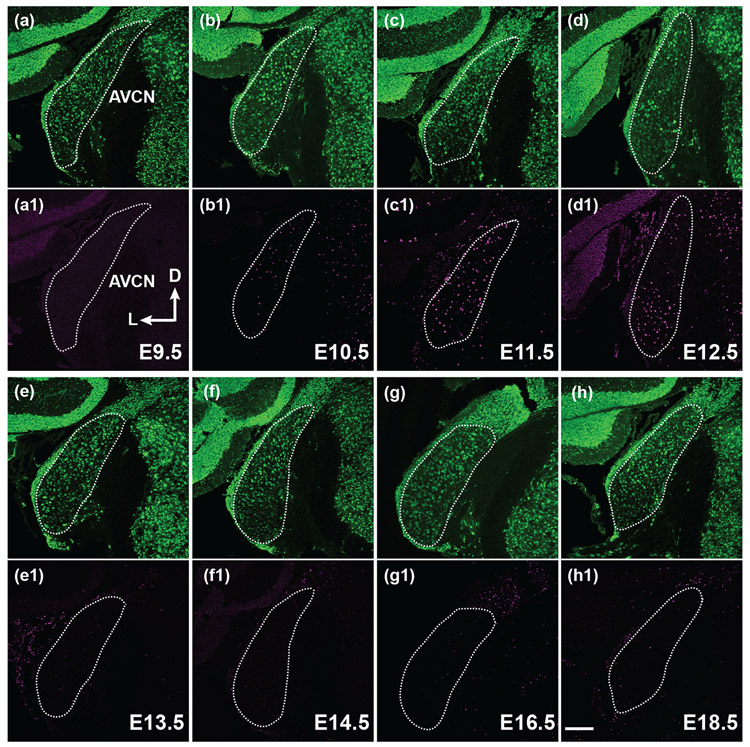
We next investigated when neurons in each of the three subdivisions of the CN are born during development. Previous studies using the H3-thymidine incorporation assay have shown that most CN cells are born between E10-E15 (M. R. Martin & Rickets, 1981; Pierce, 1967). We examined the period of neurogenesis in the CN by administering a single dose of BrdU on pregnant mice at daily intervals between E9.5 and E18.5 and collecting P20 coronal brain sections from mice with BrdU-labeling. We used BrdU antibody staining to reveal the newborn cells and NeuN antibody staining to identify neurons in the tissue sections. In the PVCN (Figure 3) and AVCN (Figure 4), most neurons are born on E10.5, E11.5 and E12.5. The activity of cell birth diminishes on E13.5, and only a few BrdU-positive neurons can be found in the PVCN and AVCN after this stage. In contrast, there are two periods of cell birth in the DCN (Figure 3). The first period of cell birth occurs between E10.5 to E12.5, followed by a pause of cell birth on E13.5 and E14.5. A second period of cell birth resumes after E14.5 and continues to E18.5, the oldest stage when animals receive BrdU injection in this study. We counted the number of BrdU-labeled neurons per unit area in three subdivisions of the CN and plotted the values against the embryonic stages when animals were treated with BrdU (Figure 5). We found that neurogenesis of the PVCN and AVCN occurs mostly in one wave from E10.5 to E13.5 and peaks between E11.5 to E12.5 (Figures 5b and c). A weak second round of cell birth was also observed in the PVCN between E14.5 to E16.5 but it is not clearly recognizable compared to the first peak. On the other hand, DCN neurons arise in two major waves of neurogenesis (Figure 5a). The first wave occurs during E10.5 to E13.5 and the second wave persists from E14.5 until the perinatal stages.
FIGURE 3. Neurogenesis of the DCN and PVCN occurs from E10.5 to 12.5 but the DCN has an additional wave of neurogenesis from E14.5 to 18.5.
(a-j1) Pregnant mice were injected with BrdU on E9.5, 10.5, 11.5, 12.5, 13.5, 14.5, 15.5, 16.5, 17.5 or 18.5. Whole mouse brains were harvested on P20. Confocal stacks from coronal brain sections through the DCN and PVCN were double stained for neuN (green) and BrdU (magenta). White dotted lines outline the DCN and PVCN, as judged by neuN staining. The axis in (a1) indicates the orientation of all the sections in the figure. D, dorsal; L, lateral. Scale bar in (j1) is 200 μm.
FIGURE 4. Most AVCN neurons are born between E10.5 to 12.5.
(a-h1) Pregnant mice were injected with BrdU on E9.5, 10.5, 11.5, 12.5, 13.5, 14.5, 15.5, 16.5, 17.5 or 18.5 (only representative time points shown). Whole mouse brains were harvested on P20. Confocal stacks from coronal brain sections through the AVCN were double stained for neuN (green) and BrdU (magenta). White dotted lines outline the AVCN, as judged by neuN staining. The axis in (a1) indicates the orientation of all the sections in the figure. D, dorsal; L, lateral. Scale bar in (h1) is 200 μm.
FIGURE 5. The average number of neurons generated on specific embryonic days in the three subdivisions of the CN.
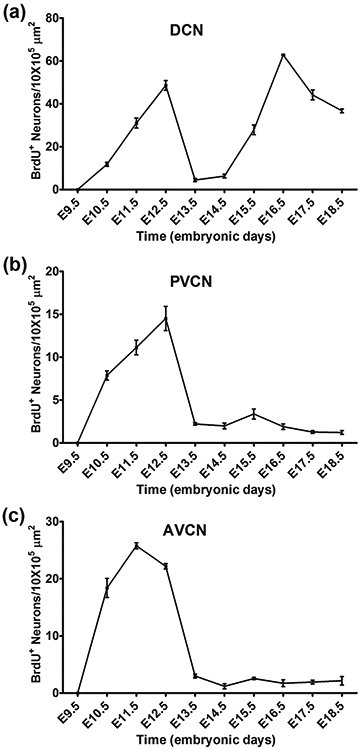
The average number of BrdU-positive neurons per 10 X 105 μm2 in the DCN (a), PVCN (b), and AVCN (c) is plotted against gestational ages with BrdU injection. The points plotted for each embryonic day represent the average from three animals. Means ± SEMs are shown.
A heterogeneous population of neurons are generated during two waves of neurogenesis in the DCN
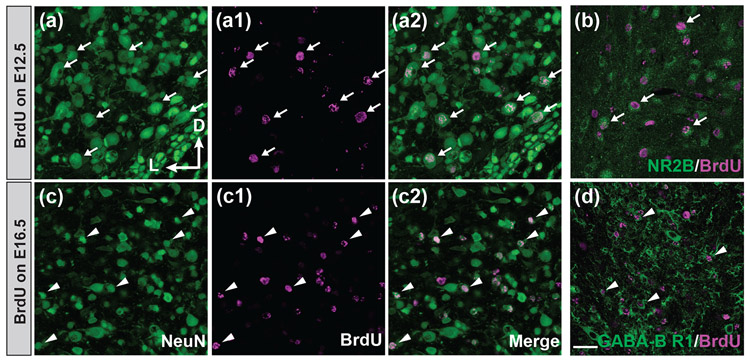
The DCN is made up of several heterogeneous neuronal groups (Browner & Baruch, 1982; Osen, 1969; Ryugo & Willard, 1985). To investigate whether distinct neuronal subtypes are born respectively in the first and second waves of neurogenesis in the DCN, we characterized the morphology of BrdU-labeled neurons from animals with BrdU injections on E12.5 (the peak of the first wave of neurogenesis) and from animals with BrdU injections on E16.5 (the peak of the second wave of neurogenesis). We found that neurons born in the first wave of neurogenesis are mostly large-sized cells (Figures 6a-a2) (average soma diameter = 16.03 ± 0.59 μm, n = 30 BrdU-labeled neurons from three animals). These large BrdU-labeled neurons are also found to be immunopositive to the NR2B subunit of the NMDA glutamate receptor (NR2B, Figure 6b), suggesting that these cells could be glutamatergic pyramidal (fusiform) cells or giant cells, the two principal cell types in the DCN (Trussell & Oertel, 2018). Conversely, most neurons generated in the second wave of neurogenesis are small-sized cells (Figures 6c-c2) (average soma diameter = 7.55 ± 0.20 μm, n = 52 BrdU-labeled neurons from three animals), and they are found to express GABA type B receptor subunit 1 (GABA-B R1, Figure 6d), a marker for GABAergic neurons, suggesting they could be the interneurons in the DCN, such as the Golgi cells or stellate cells. This observation suggested that in the DCN, the large excitatory principal neurons are born early in the first wave of neurogenesis, whereas small-sized local circuit neurons arise late in the second wave of neurogenesis.
FIGURE 6. In the DCN, neurons born in the first wave of neurogenesis are large excitatory neurons and neurons generated in the second wave of neurogenesis are small inhibitory interneurons.
(a-d) Pregnant mice were injected with BrdU on E12.5 (a, a1, a2, and b) or E16.5 (c, c1, c2, and d). Whole mouse brains were harvested on P20. (a-a2 and c-c2) Coronal brain sections through the DCN were double stained for neuN (green) and BrdU (magenta) and imaged by a confocal microscope. Large neurons are indicated by white arrows and small neurons by white arrowheads. Most neurons born on E12.5 (the peak of the first neurogenesis) have large sizes (average soma diameter = 16.03 ± 0.59 μm, n = 30 BrdU-labeled neurons from three animals) while those neurons born on E16.5 (the peak of the second neurogenesis) have small sizes (average soma diameter = 7.55 ± 0.20 μm, n = 52 BrdU-labeled neurons from three animals). (b) Double immunostaining of NR2B (green) and BrdU (magenta) within the DCN indicates that the large neurons born on E12.5 are glutamatergic excitatory neurons. (d) Double immunostaining of GABA-B receptor 1 (green) and BrdU (magenta) within the DCN demonstrates that the small neurons born on E16.5 are GABAergic local circuit neurons. The axis in (a) indicates the orientation of all the sections in the figure. D, dorsal; L, lateral. Scale bar in (d) is 30 μm.
Neurogenesis of the AVCN comprises a homogeneous population of bushy cells
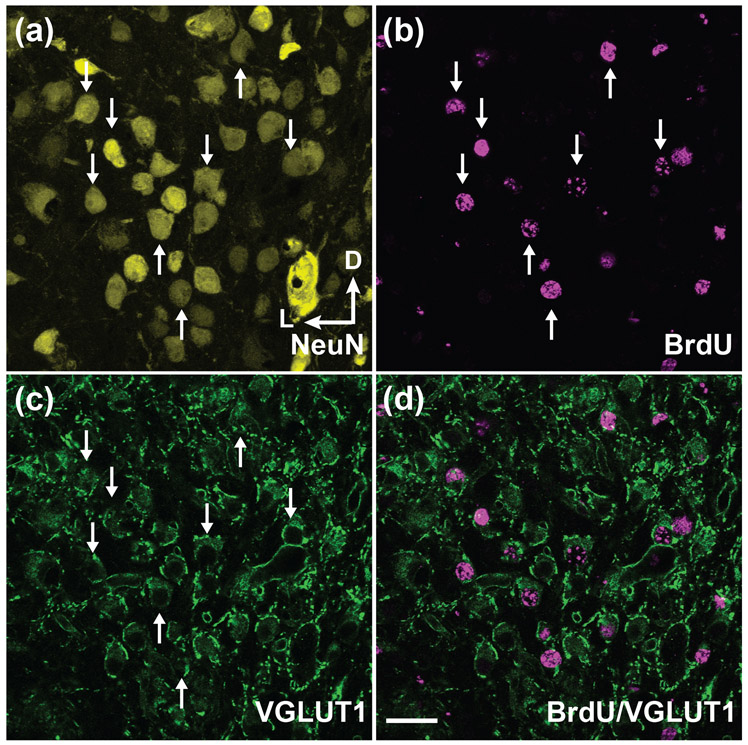
Compared to the DCN, the AVCN contains a fairly homogenous population of the spherical bushy cells (Cant & Morest, 1979; Rubio, 2018) and only has one wave of neurogenesis. It is possible that the majority of neurons in the AVCN generated during neurogenesis are spherical bushy cells. The spherical bushy cell is innervated by the ascending central branch of the SGN afferent fiber with an extraordinarily large synaptic ending, known as the endbulb of Held (Ryugo & Fekete, 1982). To determine whether newborn neurons in the AVCN are mostly spherical bushy cells, we co-immunostained BrdU-positive cells with VGLUT1, a marker predominantly expressed in the glutamatergic endbulb synaptic terminals. We found that almost all BrdU-labeled neurons in the AVCN are surrounded by VGLUT1-positive endbulb synaptic terminals (Figure 7), indicating that neurogenesis of the AVCN generates a homogeneous population of bushy cells.
FIGURE 7. Most neurons generated during neurogenesis in the AVCN are Endbulb-innervated bushy cells.
(a-d) Pregnant mice were injected with BrdU on E12.5. Whole mouse brains were harvested on P20. Coronal brain sections through the AVCN were triple stained for neuN (yellow), BrdU (magenta) and VGLUT1 (green) and imaged by a confocal microscope. White arrows indicate BrdU-labeled neurons innerved by the Endbulb of Held synapses, indicating that they are the bushy cells. (d) The merged image of BrdU (magenta) and VGLUT1 (green) immunostaining demonstrates that most BrdU-labeled neurons in the AVCN are surrounded by VGLUT1-positive endbulb synaptic terminals. The axis in (a) indicates the orientation of all the sections in the figure. D, dorsal; L, lateral. Scale bar in (d) is 30 μm.
No spatial gradient of cell birthdates is observed in the DCN
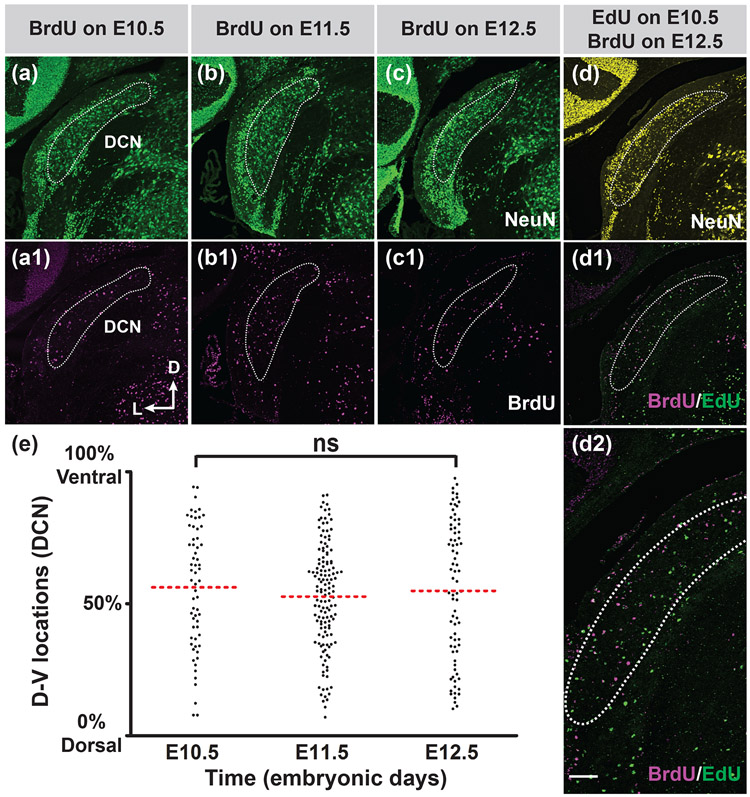
To explore the possibility that central auditory neurons use birthdates to determine the positional identity of neurons along the tonotopic axis, we analyzed the distribution of thymidine analog-labeled neurons in the CN at different developmental stages. We focused our analyses only in the DCN and AVCN but not in the PVCN as the tonotopic axis of octopus cells in the posterodorsal region of the PVCN is not aligned with the conventional dorsal to ventral direction (Oertel, Bal, Gardner, Smith, & Joris, 2000). Octopus cells in the PVCN are arranged tonotopically in a rostral to caudal orientation, which would require another set of animals sectioned horizontally. For the analysis of the DCN, we used coronal sections of the posterior CN as this region contains the largest portion of the DCN with all cell layers (D-V axis > 850 μm, please refer to Figure 8) and we only analyzed DCN neurons born in the first wave of neurogenesis because it is not clear whether interneurons generated in the second wave of neurogenesis have a tonotopic arrangement [although vertical cells in the DCN have been shown to be tonotopically organized (Muniak & Ryugo, 2014)].
FIGURE 8. No spatial gradient of cell birthdates can be observed in the DCN.
Pregnant mice were injected with BrdU on E10.5, 11.5, or 12.5 (a-c1), or sequentially with EdU on E10.5 and BrdU on E12.5 (d-d2). Whole mouse brains were harvested on P20. Coronal brain sections through the largest portion of the DCN were double stained for neuN (green) and BrdU (magenta) (a-c1) or triple stained for neuN (yellow), EdU (green) and BrdU (magenta) (d-d2). (d2) is a high magnification view of the (d1). White dotted lines outline the DCN. The axis in (a1) indicates the orientation of all the sections (a-d2) in the figure. D, dorsal; L, lateral. (e) Measurement of D-V locations of BrdU-labeled DCN neurons on E10.5, E11.5 and E12.5 (n= three mice for each time point). One-way ANOVA indicates that there is no statistical difference between the distribution of DCN neurons born on E10.5 and those born on E12.5. p=0.75. ns: not significant. Scale bar in (d2) is 100 μm (d2) or 200 μm (a-d1).
We examined the distribution of BrdU-positive neurons in the P20 coronal sections of the DCN from mice injected with BrdU on E10.5, E11.5, and E12.5 (Figures 8a-c1). We found that there is no apparent regional spatial gradient of neurons born on E10.5, E11.5, and E12.5 in the DCN. Neurons from different birthdates are scattered randomly along the D-V axis of the DCN and intermingled with each other. To allow us to visualize early- and late-born neurons in the same sample, we also performed EdU/BrdU double labeling to label neurons born on E10.5 with EdU and neurons born on E12.5 with BrdU (Figures 8d-d2). Again, we did not observe a difference between the distribution of EdU-labeled and BrdU-labeled cells in the DCN. Early-born EdU-positive cells (green cells in Figures 8d1 and d2) and late-born BrdU-positive cells (magenta cells in Figures 8d1 and d2) appear to distribute equally along the D-V axis in the DCN and are intermixed. To statistically compare the distribution of neurons generated from different birthdates in the DCN, we used ImageJ software to measure the locations of BrdU-positive neurons along the D-V axis of the DCN from animals labeled with BrdU on E10.5, E11.5 and E12.5. The location of the labeled neuron was then converted to a percentage by assigning the cell at the most dorsal extreme to 0% and the cell at the most ventral extreme to 100%. We compared the cell position along the D-V axis of the DCN between neurons born on E10.5 and E12.5 by one-way ANOVA and found that there is no statistically significant difference of the cell distribution between the two groups (Figure 8e). Cells from different birthdates distribute similarly along the D-V axis of the DCN. In conclusion, we do not observe a spatial gradient of neurons born from different birthdates in the DCN.
AVCN neurons are arranged in a dorsal to ventral progression according to their birthdates
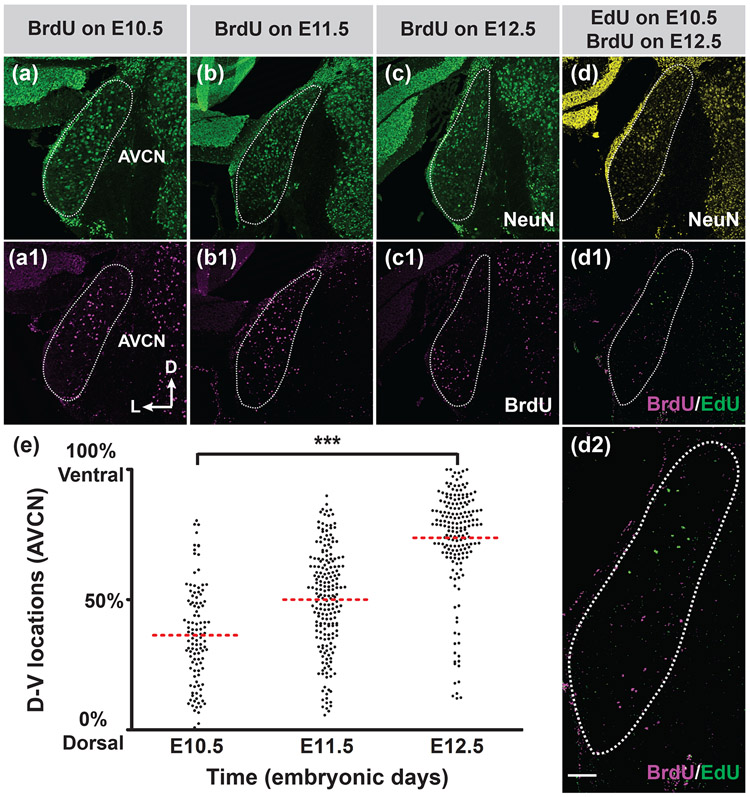
One reason why no spatial gradient in regards to neuronal birthdates can be observed in the DCN may be due to the heterogeneous cell populations of the DCN. If more than one type of DCN neurons are generated in the same wave of neurogenesis but arranged in different spatial orientations, it could be difficult to detect a spatial neurogenic gradient. In contrast to the DCN, the AVCN has a fairly homogenous neuronal population of the spherical bushy cells generated during neurogenesis (Figure 7). Therefore, we next examined whether the AVCN neurons are organized in a spatial gradient based on their birthdates.
We analyzed the distribution of BrdU-labeled neurons in the P20 coronal sections of the AVCN from animals with BrdU injection on E10.5, E11.5, and E12.5 (Figures 9a-c1). We observed that neurons born on E10.5 appeared to be located more toward the dorsal end of the AVCN, while those born on E12.5 were clustered in the ventral side. Neurons born in the middle of neurogenesis (E11.5) were distributed in both the dorsal and ventral parts of the AVCN. Double labeling of early-born neurons with EdU on E10.5 and late-born neurons with BrdU on E12.5 in the same AVCN also revealed that EdU-positive neurons (green cells in Figures 9d1 and d2) are distributed more dorsally along the D-V axis than BrdU-positive neurons (magenta cells in Figures 9d1 and d2). To further elucidate whether there is a correlation between the distribution of neurons and their birthdates in the AVCN, we measured the locations of neurons labeled with BrdU on E10.5, E11.5 and E12.5 along the D-V axis of the AVCN, as described above. We observed a progression of the average location of the cells born on E10.5, E11.5, and E12.5 from the dorsal to ventral end of the AVCN (Figure 9e). Statistical analysis confirmed that neurons born on E10.5 are located more dorsally than neurons born on E12.5. These findings indicate that bushy cells in the AVCN are arranged along the tonotopic axis according to their birthdates.
FIGURE 9. AVCN neurons are arranged in a D-V progression according to their birthdates.
Pregnant mice were injected with BrdU on E10.5, 11.5, or 12.5 (a-c1), or sequentially with EdU on E10.5 and BrdU on E12.5 (d-d2). Whole mouse brains were harvested on P20. Coronal brain sections through the largest portion of the AVCN were double stained for neuN (green) and BrdU (magenta) (a-c1) or triple stained for neuN (yellow), EdU (green) and BrdU (magenta) (d-d2). (d2) is a high magnification view of the (d1). White dotted lines outline the AVCN. The axis in (a1) indicates the orientation of all the sections (a-d2) in the figure. D, dorsal; L, lateral. (e) Measurement of D-V locations of BrdU-labeled AVCN neurons on E10.5, E11.5 and E12.5 (n= three mice for each time point). One-way ANOVA demonstrates that AVCN neurons born on E10.5 are located more dorsally than those born on E12.5. ***: p≤0.001. Scale bar in (d2) is 100 μm (d2) or 200 μm (a-d1).
DISCUSSION
Tonotopy is the most fundamental organizing principle of the vertebrate auditory system. However, up until now, little is known about the cellular and molecular mechanisms that govern the formation of tonotopy in the auditory system. In this study, we seek to gain insight into whether the birthdate of auditory neurons defines their tonotopic position during development. Using the BrdU birthdating assay to label the newborn neurons in the CN, we found that most CN neurons are born between E10.5 to E13.5, but the DCN has an additional wave of neurogenesis from E14.5 to E18.5. In the DCN, large excitatory neurons are born first, followed by small local circuit neurons. We also demonstrated that bushy cells are arranged in a dorsal to ventral gradient based on their birthdates along the tonotopic axis of the AVCN, suggesting that some central auditory neurons may use birthdates to specify their tonotopic positions, similar to the principle used by cochlear SGNs. Taken together, our data identify a possible cellular mechanism that contributes to regional tonotopy in the CN.
Our studies of neurogenesis in the CN indicate that CN neurons are mostly born from E10.5 to E13.5 with a second wave of cell birth from E14.5 to E18.5 in the DCN (Figures 3-5). These observations largely agree with past findings but with some minor differences (M. R. Martin & Rickets, 1981). Previous research demonstrated three periods of cell birth activities occurring in the DCN, while our results only indicate two. This could be due to the different time intervals used for thymidine analog injection between our study and the previous report. In the previous study, pregnant animals were injected with [methyl-3H]thymidine at half-daily intervals between E8 and E13.5 and daily intervals afterward. A pause of the cell birth activity was observed between E11 and E11.5 in the study. In our study, BrdU injection was done at daily intervals from E9.5 to E18.5. The lower resolution of time intervals with BrdU injection in our study may result in the failure to identify the gap in between two days of cell birth. Another possibility is the strain differences used between the studies. Moreover, the authors from the previous study reported a protracted period of cell birth in the DCN from the perinatal stage to postnatal day 4.5 (M. R. Martin & Rickets, 1981). Nevertheless, they concluded that cells born in this late period are most likely glial cells as they are very small without an obvious nucleus.
In our survey of neurogenesis, we went beyond the previous study to define the specific birthdates for large principal neurons and small interneurons in the DCN. Most large excitatory principal projection neurons are born by E13.5, while small inhibitory interneurons are not born until after E14.5 (Figure 6). In line with this observation, excitatory and inhibitory neurons of the DCN are derived from molecularly distinct embryonic neuroepithelia. Excitatory neurons originate from an Atoh1-expressing neuroepithelial domain, whereas inhibitory neurons arise from a Ptf1a-expressing neuroepithelial region (Fujiyama et al., 2009). It is possible that large excitatory principal neurons need to be born first in order to project their axons outside the nucleus and find their targets to establish the connection before small local circuit neurons can be brought into place during the circuit construction. A similar phenomenon for this type of cell birth sequence has been observed in the olfactory system (Huilgol & Tole, 2016). The morphogenesis of the olfactory bulb occurs in two steps. The principal projection neurons are born first in the ventricular zone at the rostral tip of the telencephalon and migrate outward to generate the olfactory bulb anlage by E12 to 13 in the mouse. This is followed by the arrival of small local circuit neurons beginning from E14.
Spatiotemporal gradients of neurogenesis are recurrent themes in many regions of the developing nervous system, including cortical neurons in the neocortex (Sansom & Livesey, 2009), mitral cells in the olfactory bulb (Imamura, Ayoub, Rakic, & Greer, 2011), thalamic neurons in the thalamus (Nakagawa & Shimogori, 2012; Wong et al., 2018), dopaminergic neurons in the midbrain (Bayer, Wills, Triarhou, & Ghetti, 1995), and pyramidal cells and dentate granule cells in the hippocampus (Bayer, 1980; L. A. Martin, Tan, & Goldowitz, 2002). In several regions of the auditory pathway, functionally distinct neurons are arranged in a topographic gradient according to their birthdates, such as SGNs in the cochlea and neurons in the inferior colliculus (Altman & Bayer, 1981; Koundakjian et al., 2007; Matei et al., 2005; Ruben, 1967). Common to all these regions, neurogenic gradients are frequently used to divide different regions into specific functional domains. We also observed a dorsal to ventral neurogenic gradient in the AVCN (Figure 9). The average location for early-born neurons is more dorsal than that of late-born neurons in the AVCN. This neurogenic gradient of the AVCN is aligned with its tonotopic axis, suggesting that neurons in some areas of the auditory system may use neuronal birthdate to specify the regional tonotopic position of neurons. One advantage of arranging auditory neurons tonotopically based on their birthdates is that it can facilitate the diversification of neurons with different frequency responses by the action of concentration gradients from morphogens or molecular guidance cues such as Sonic hedgehog and ephrins/Ephs molecules (Cramer, 2005; Miko, Nakamura, Henkemeyer, & Cramer, 2007; Son et al., 2015).
We did not detect a spatial gradient of cell birth in the DCN (Figure 8), which is consistent with previous findings of the thymidine-radiographic study of the DCN (M. R. Martin & Rickets, 1981). The DCN differs from the ventral part of the CN as its cytoarchitecture resembles that of the cerebellum, forming a layer-like structure. It is thought that the DCN is involved in more complex auditory processing, rather than just simply transmitting sound information (Oertel & Young, 2004). For this reason, it is possible that the DCN may employ a different developmental mechanism as compared to the VCN. Alternatively, the heterogeneous cell population of the DCN could also account for the failure to detect the neurogenic gradient. If several types of neurons are born in the same wave of neurogenesis, but are arranged in different orientations, it could be difficult to recognize any spatial gradient during neurogenesis. Further studies using specific markers to distinguish different subtypes of neurons in the DCN will be needed to better elucidate this possibility. In summary, our data provide a possible mechanism that neuronal birthdates may be used to define the regional tonotopic position of neurons in some areas of the auditory pathway. This information will ultimately lead us to a better understanding of how the tonotopic map is formed in the auditory system.
ACKNOWLEDGMENT
We thank Dr. M. William Rochlin for critical reading of the manuscript. Funding for this work was supported by Loyola University Chicago Faculty Start-Up Grant (AU104818).
Footnotes
CONFLICT OF INTEREST
The authors declare no competing interests.
REFERENCES
- Altman J, & Bayer SA (1981). Time of origin of neurons of the rat inferior colliculus and the relations between cytogenesis and tonotopic order in the auditory pathway. Exp Brain Res, 42(3-4), 411–423. [DOI] [PubMed] [Google Scholar]
- Bayer SA (1980). Development of the hippocampal region in the rat. I. Neurogenesis examined with 3H-thymidine autoradiography. J Comp Neurol, 190(1), 87–114. doi: 10.1002/cne.901900107 [DOI] [PubMed] [Google Scholar]
- Bayer SA, Wills KV, Triarhou LC, & Ghetti B (1995). Time of neuron origin and gradients of neurogenesis in midbrain dopaminergic neurons in the mouse. Exp Brain Res, 105(2), 191–199. [DOI] [PubMed] [Google Scholar]
- Browner RH, & Baruch A (1982). The cytoarchitecture of the dorsal cochlear nucleus in the 3-month- and 26-month-old C57BL/6 mouse: a Golgi impregnation study. J Comp Neurol, 211(2), 115–138. doi: 10.1002/cne.902110203 [DOI] [PubMed] [Google Scholar]
- Cant NB, & Morest DK (1979). Organization of the neurons in the anterior division of the anteroventral cochlear nucleus of the cat. Light-microscopic observations. Neuroscience, 4(12), 1909–1923. [DOI] [PubMed] [Google Scholar]
- Cramer KS (2005). Eph proteins and the assembly of auditory circuits. Hear Res, 206(1-2), 42–51. doi: 10.1016/j.heares.2004.11.024 [DOI] [PubMed] [Google Scholar]
- Di Bonito M, Narita Y, Avallone B, Sequino L, Mancuso M, Andolfi G, … Studer M (2013). Assembly of the auditory circuitry by a Hox genetic network in the mouse brainstem. PLoS Genet, 9(2), e1003249. doi: 10.1371/journal.pgen.1003249 [DOI] [PMC free article] [PubMed] [Google Scholar]
- Duncan LJ, Mangiardi DA, Matsui JI, Anderson JK, McLaughlin-Williamson K, & Cotanche DA (2006). Differential expression of unconventional myosins in apoptotic and regenerating chick hair cells confirms two regeneration mechanisms. J Comp Neurol, 499(5), 691–701. doi: 10.1002/cne.21114 [DOI] [PMC free article] [PubMed] [Google Scholar]
- Fekete DM, Rouiller EM, Liberman MC, & Ryugo DK (1984). The central projections of intracellularly labeled auditory nerve fibers in cats. J Comp Neurol, 229(3), 432–450. doi: 10.1002/cne.902290311 [DOI] [PubMed] [Google Scholar]
- Fujiyama T, Yamada M, Terao M, Terashima T, Hioki H, Inoue YU, … Hoshino M (2009). Inhibitory and excitatory subtypes of cochlear nucleus neurons are defined by distinct bHLH transcription factors, Ptf1a and Atoh1. Development, 136(12), 2049–2058. doi: 10.1242/dev.033480 [DOI] [PubMed] [Google Scholar]
- He S, Li Z, Ge S, Yu YC, & Shi SH (2015). Inside-Out Radial Migration Facilitates Lineage-Dependent Neocortical Microcircuit Assembly. Neuron, 86(5), 1159–1166. doi: 10.1016/j.neuron.2015.05.002 [DOI] [PMC free article] [PubMed] [Google Scholar]
- Huilgol D, & Tole S (2016). Cell migration in the developing rodent olfactory system. Cell Mol Life Sci, 73(13), 2467–2490. doi: 10.1007/s00018-016-2172-7 [DOI] [PMC free article] [PubMed] [Google Scholar]
- Imamura F, Ayoub AE, Rakic P, & Greer CA (2011). Timing of neurogenesis is a determinant of olfactory circuitry. Nat Neurosci, 14(3), 331–337. doi: 10.1038/nn.2754 [DOI] [PMC free article] [PubMed] [Google Scholar]
- Ivanova A, & Yuasa S (1998). Neuronal migration and differentiation in the development of the mouse dorsal cochlear nucleus. Dev Neurosci, 20(6), 495–511. doi: 10.1159/000017350 [DOI] [PubMed] [Google Scholar]
- Kandler K, Clause A, & Noh J (2009). Tonotopic reorganization of developing auditory brainstem circuits. Nat Neurosci, 12(6), 711–717. doi: 10.1038/nn.2332 [DOI] [PMC free article] [PubMed] [Google Scholar]
- Koundakjian EJ, Appler JL, & Goodrich LV (2007). Auditory neurons make stereotyped wiring decisions before maturation of their targets. J Neurosci, 27(51), 14078–14088. doi: 10.1523/JNEUROSCI.3765-07.2007 [DOI] [PMC free article] [PubMed] [Google Scholar]
- Liberman MC (1982). The cochlear frequency map for the cat: labeling auditory-nerve fibers of known characteristic frequency. J Acoust Soc Am, 72(5), 1441–1449. [DOI] [PubMed] [Google Scholar]
- Maricich SM, Xia A, Mathes EL, Wang VY, Oghalai JS, Fritzsch B, & Zoghbi HY (2009). Atoh1-lineal neurons are required for hearing and for the survival of neurons in the spiral ganglion and brainstem accessory auditory nuclei. J Neurosci, 29(36), 11123–11133. doi: 10.1523/JNEUROSCI.2232-09.2009 [DOI] [PMC free article] [PubMed] [Google Scholar]
- Martin LA, Tan SS, & Goldowitz D (2002). Clonal architecture of the mouse hippocampus. J Neurosci, 22(9), 3520–3530. doi: 20026280 [DOI] [PMC free article] [PubMed] [Google Scholar]
- Martin MR, & Rickets C (1981). Histogenesis of the cochlear nucleus of the mouse. J Comp Neurol, 197(1), 169–184. doi: 10.1002/cne.901970113 [DOI] [PubMed] [Google Scholar]
- Matei V, Pauley S, Kaing S, Rowitch D, Beisel KW, Morris K, … Fritzsch B (2005). Smaller inner ear sensory epithelia in Neurog 1 null mice are related to earlier hair cell cycle exit. Dev Dyn, 234(3), 633–650. doi: 10.1002/dvdy.20551 [DOI] [PMC free article] [PubMed] [Google Scholar]
- Miko IJ, Nakamura PA, Henkemeyer M, & Cramer KS (2007). Auditory brainstem neural activation patterns are altered in EphA4- and ephrin-B2-deficient mice. J Comp Neurol, 505(6), 669–681. doi: 10.1002/cne.21530 [DOI] [PubMed] [Google Scholar]
- Molyneaux BJ, Arlotta P, Menezes JR, & Macklis JD (2007). Neuronal subtype specification in the cerebral cortex. Nat Rev Neurosci, 8(6), 427–437. doi: 10.1038/nrn2151 [DOI] [PubMed] [Google Scholar]
- Muniak MA, Rivas A, Montey KL, May BJ, Francis HW, & Ryugo DK (2013). 3D model of frequency representation in the cochlear nucleus of the CBA/J mouse. J Comp Neurol, 521(7), 1510–1532. doi: 10.1002/cne.23238 [DOI] [PMC free article] [PubMed] [Google Scholar]
- Muniak MA, & Ryugo DK (2014). Tonotopic organization of vertical cells in the dorsal cochlear nucleus of the CBA/J mouse. J Comp Neurol, 522(4), 937–949. doi: 10.1002/cne.23454 [DOI] [PMC free article] [PubMed] [Google Scholar]
- Nakagawa Y, & Shimogori T (2012). Diversity of thalamic progenitor cells and postmitotic neurons. Eur J Neurosci, 35(10), 1554–1562. doi: 10.1111/j.1460-9568.2012.08089.x [DOI] [PubMed] [Google Scholar]
- Oertel D, Bal R, Gardner SM, Smith PH, & Joris PX (2000). Detection of synchrony in the activity of auditory nerve fibers by octopus cells of the mammalian cochlear nucleus. Proc Natl Acad Sci U S A, 97(22), 11773–11779. doi: 10.1073/pnas.97.22.11773 [DOI] [PMC free article] [PubMed] [Google Scholar]
- Oertel D, & Young ED (2004). What's a cerebellar circuit doing in the auditory system? Trends Neurosci, 27(2), 104–110. doi: 10.1016/j.tins.2003.12.001 [DOI] [PubMed] [Google Scholar]
- Oishi K, Nakagawa N, Tachikawa K, Sasaki S, Aramaki M, Hirano S, … Nakajima K (2016). Identity of neocortical layer 4 neurons is specified through correct positioning into the cortex. Elife, 5. doi: 10.7554/eLife.10907 [DOI] [PMC free article] [PubMed] [Google Scholar]
- Osen KK (1969). Cytoarchitecture of the cochlear nuclei in the cat. J Comp Neurol, 136(4), 453–484. doi: 10.1002/cne.901360407 [DOI] [PubMed] [Google Scholar]
- Pierce ET (1967). Histogenesis of the dorsal and ventral cochlear nuclei in the mouse. An autoradiographic study. J Comp Neurol, 131(1), 27–54. doi: 10.1002/cne.901310104 [DOI] [PubMed] [Google Scholar]
- Rouiller EM, Cronin-Schreiber R, Fekete DM, & Ryugo DK (1986). The central projections of intracellularly labeled auditory nerve fibers in cats: an analysis of terminal morphology. J Comp Neurol, 249(2), 261–278. doi: 10.1002/cne.902490210 [DOI] [PubMed] [Google Scholar]
- Ruben RJ (1967). Development of the inner ear of the mouse: a radioautographic study of terminal mitoses. Acta Otolaryngol, Suppl 220:221–244. [PubMed] [Google Scholar]
- Rubio ME (2018). Microcircuits of the Ventral Cochlear Nucleus (Vol. 65). Switzerland: Springer International Publishing. [Google Scholar]
- Ryugo DK, & Fekete DM (1982). Morphology of primary axosomatic endings in the anteroventral cochlear nucleus of the cat: a study of the endbulbs of Held. J Comp Neurol, 210(3), 239–257. doi: 10.1002/cne.902100304 [DOI] [PubMed] [Google Scholar]
- Ryugo DK, & May SK (1993). The projections of intracellularly labeled auditory nerve fibers to the dorsal cochlear nucleus of cats. J Comp Neurol, 329(1), 20–35. doi: 10.1002/cne.903290103 [DOI] [PubMed] [Google Scholar]
- Ryugo DK, & Parks TN (2003). Primary innervation of the avian and mammalian cochlear nucleus. Brain Res Bull, 60(5-6), 435–456. [DOI] [PubMed] [Google Scholar]
- Ryugo DK, & Willard FH (1985). The dorsal cochlear nucleus of the mouse: a light microscopic analysis of neurons that project to the inferior colliculus. J Comp Neurol, 242(3), 381–396. doi: 10.1002/cne.902420307 [DOI] [PubMed] [Google Scholar]
- Sansom SN, & Livesey FJ (2009). Gradients in the brain: the control of the development of form and function in the cerebral cortex. Cold Spring Harb Perspect Biol, 1(2), a002519. doi: 10.1101/cshperspect.a002519 [DOI] [PMC free article] [PubMed] [Google Scholar]
- Son EJ, Ma JH, Ankamreddy H, Shin JO, Choi JY, Wu DK, & Bok J (2015). Conserved role of Sonic Hedgehog in tonotopic organization of the avian basilar papilla and mammalian cochlea. Proc Natl Acad Sci U S A, 112(12), 3746–3751. doi: 10.1073/pnas.1417856112 [DOI] [PMC free article] [PubMed] [Google Scholar]
- Trussell LO, & Oertel D (2018). Microcircuits of the Dorsal Cochlear Nucleus (Vol. 65). Switzerland: Springer International Publishing. [Google Scholar]
- Wang VY, Rose MF, & Zoghbi HY (2005). Math1 expression redefines the rhombic lip derivatives and reveals novel lineages within the brainstem and cerebellum. Neuron, 48(1), 31–43. doi: 10.1016/j.neuron.2005.08.024 [DOI] [PubMed] [Google Scholar]
- Wong SZH, Scott EP, Mu W, Guo X, Borgenheimer E, Freeman M, … Nakagawa Y (2018). In vivo clonal analysis reveals spatiotemporal regulation of thalamic nucleogenesis. PLoS Biol, 16(4), e2005211. doi: 10.1371/journal.pbio.2005211 [DOI] [PMC free article] [PubMed] [Google Scholar]
- Yu WM, Appler JM, Kim YH, Nishitani AM, Holt JR, & Goodrich LV (2013). A Gata3-Mafb transcriptional network directs post-synaptic differentiation in synapses specialized for hearing. Elife, 2, e01341. doi: 10.7554/eLife.01341 [DOI] [PMC free article] [PubMed] [Google Scholar]
- Yu WM, Feltri ML, Wrabetz L, Strickland S, & Chen ZL (2005). Schwann cell-specific ablation of laminin gamma1 causes apoptosis and prevents proliferation. J Neurosci, 25(18), 4463–4472. doi: 10.1523/JNEUROSCI.5032-04.2005 [DOI] [PMC free article] [PubMed] [Google Scholar]
- Yu WM, & Goodrich LV (2014). Morphological and physiological development of auditory synapses. Hear Res, 311, 3–16. doi: 10.1016/j.heares.2014.01.007 [DOI] [PMC free article] [PubMed] [Google Scholar]


