Corrections
Glatigny, S., C. A. Wagner, and E. Bettelli. 2016. Cutting edge: integrin α4 is required for regulatory B cell control of experimental autoimmune encephalomyelitis. J. Immunol. 196: 3542–3546.
Simon Glatigny and Estelle Bettelli wish to correct errors made in the preparation of Fig. 2 and the Materials and Methods section. The integrity of the data and the conclusions of the paper are not affected.
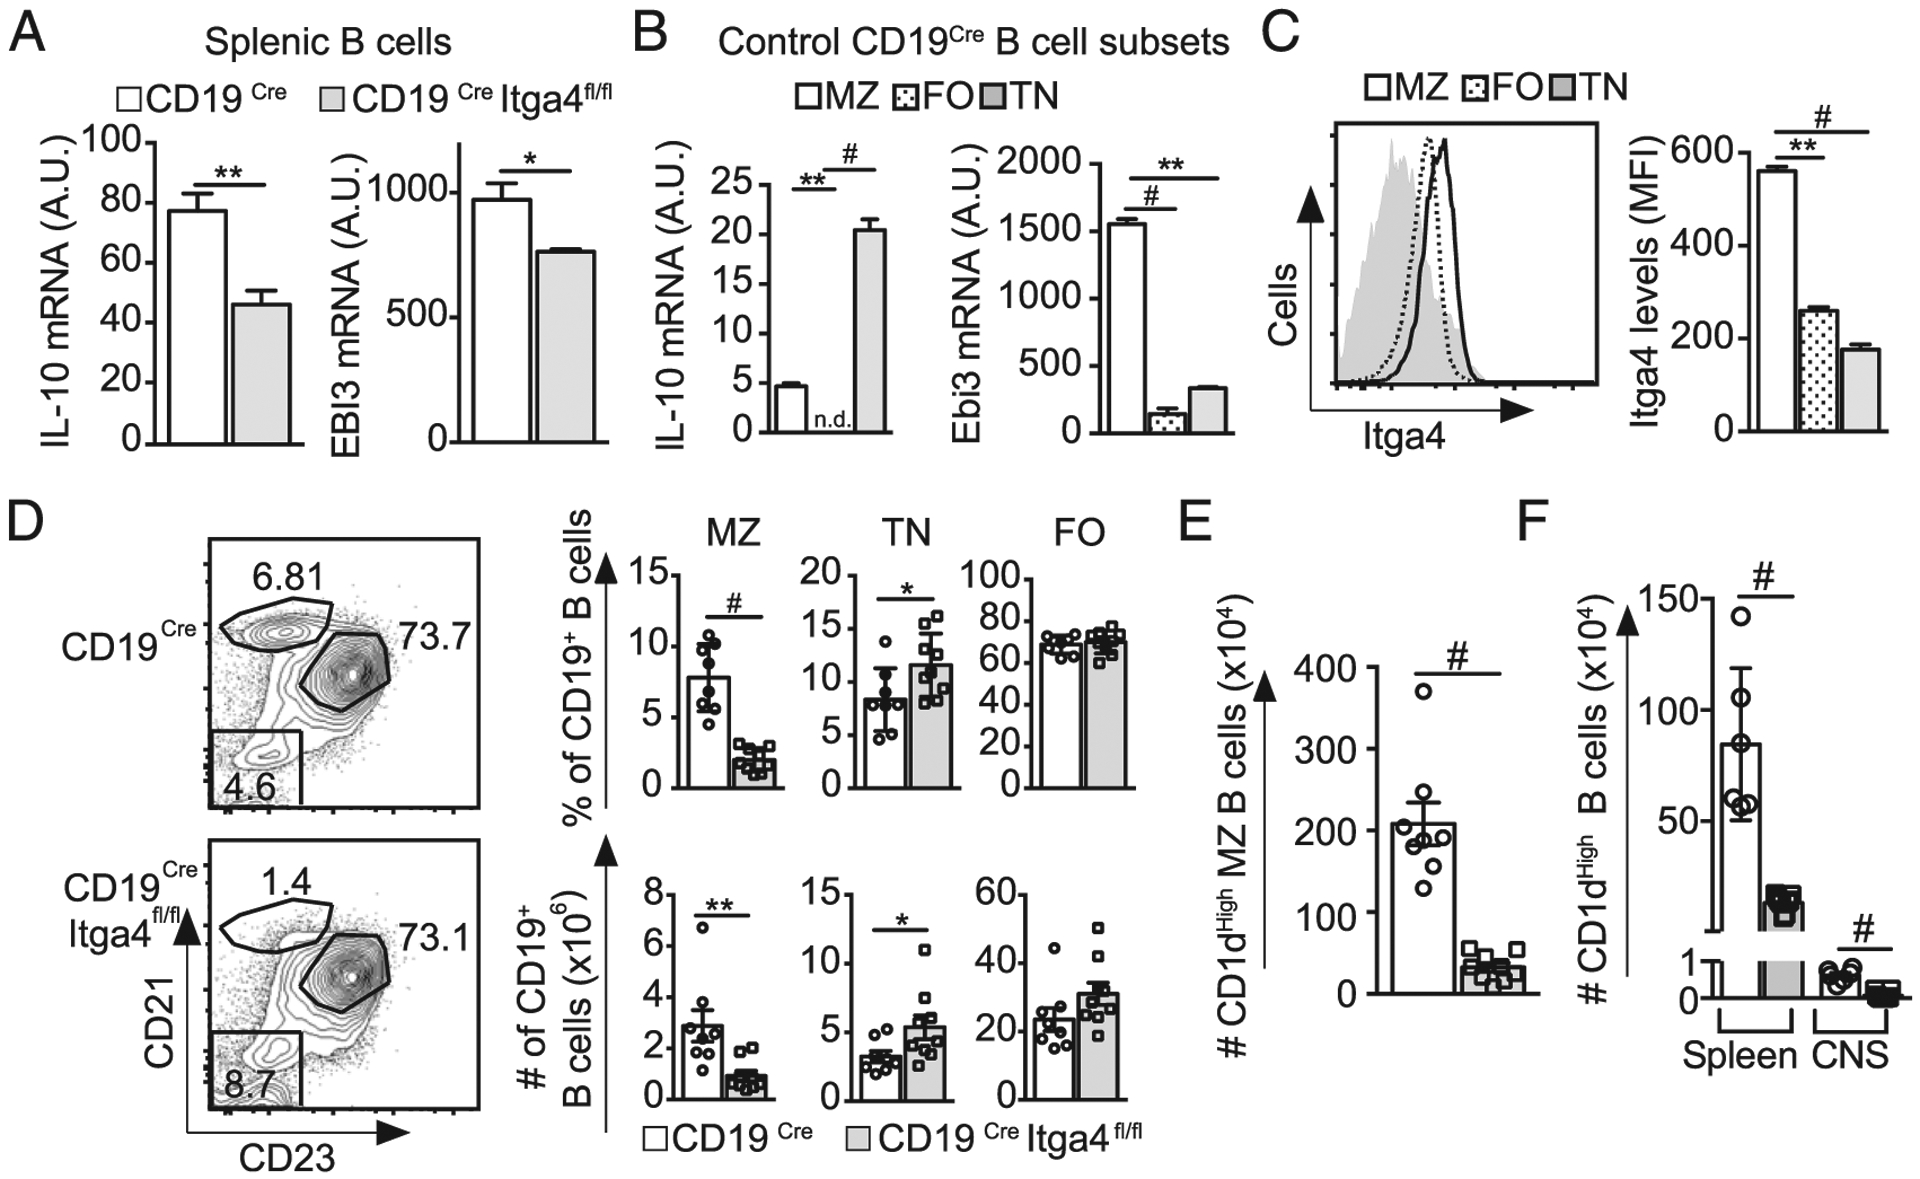
FIGURE 2.

Itga4 expression by B cells is crucial for the presence of Bregs in the spleen. Splenocytes were collected from naive CD19Cre Itga4fl/fl mice and CD19Cre mice. (A) B cells were isolated and IL-10 and Ebi3 mRNA relative expressions were determined by quantitative PCR. (B) IL-10 and Ebi3 mRNA relative expression on sorted MZ (B220+CD21highCD23low), FO (B220+CD21+CD23+), and TN (B220+CD21−CD23−) B cells from CD19Cre mice. (C) Itga4 expression on MZ (black line), FO (dotted line), and TN B cells (gray histogram) from CD19Cre mice as identified in (B). (D) Representative CD21 and CD23 expression gated on CD19+ B cells from CD19Cre Itga4fl/fl mice (bottom) and CD19Cre mice (top) to define three B cell subsets: MZ (CD21highCD23−), TN (CD21−CD23+), and FO (CD21+CD23+). Mean frequency (top) and absolute numbers (bottom) of each B cell subset from CD19Cre Itga4fl/fl mice (gray) and CD19Cre mice (white) determined from three independent experiments with 7–10 mice per group. (E) Absolute numbers of CD1d+ MZ B cells from naive CD19Cre Itga4fl/fl mice and CD19Cre mice. (F) Absolute numbers of CD1d+ among B cells in the spleen and CNS of CD19Cre Itga4fl/fl mice and CD19Cre mice at the peak of EAE. Statistical significance was designated as follows: *,**,#p < 0.05.
In the Materials and Methods section, the statistical tests used in the analysis were incorrectly listed. The statement under the Statistical analysis heading should be replaced by the following description of statistical tests used to analyze the data: “A two-way ANOVA was used for statistical comparison of clinical EAE scores and cell proliferation. A one-way ANOVA was applied for statistical analysis of Fig. 2B and 2C and Fig. 3C and 3E. Unpaired t test was applied for statistical analysis of all of the other experiments. A p value < 0.05 was considered significant.”
In the figure legends, the p value symbols were mislabeled. “*p < 0.05, **p < 0.01, #p < 0.005” should be replaced by “*,**,#p < 0.05.”
In Fig. 2D, the p value symbols in the bottom panels were mislabeled, and the “**” symbol in the bottom right panel for FO, “# of CD19+ B cells (×106),” was duplicated by mistake from the adjacent “TN” panel during the preparation of the figure and should be removed. Fig. 2 and its legend have been corrected and are shown below.
In the fourth paragraph of the Results, “and a slight increased frequency of FO B cells (B220+CD21+CD23+)” should be removed from the sentence, “This drastic reduction of MZ B cell number was associated with an increased frequency of TN B cells (B220+CD21−CD23−) and a slight increased frequency of FO B cells (B220+CD21+CD23+) (Fig. 2D).”
The online version of this article has been corrected and now differs from the print version as originally published.


