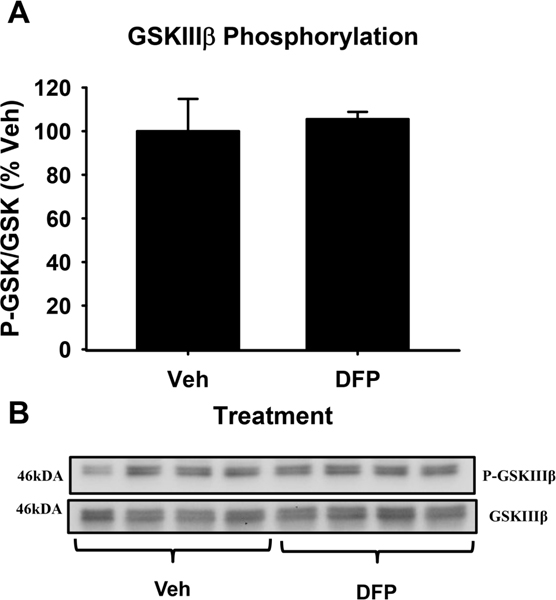
Figure 4.

GSKIIIβ phosphorylation after DFP exposure. Histograms depicting levels of GSKIIIβ phosphorylation (ser9) after 24hr incubation with vehicle or 1.0 nM DFP (A). Immunoblots for P- GSKIIIβ (ser9) and total GSKIIIβ from primary cortical neurons (B). Each bar represents mean ± S.E.M., n=4 with significance assessed at p<0.05.
