Abstract
Precision oncology hinges on linking tumor genotype with druggable enzymatic dependencies1, however targeting the frequently dysregulated metabolic landscape of cancer has proven to be a major challenge2. Here we show that tissue context is the major determinant of NAD metabolic pathway dependence in cancer. By analyzing over 7000 tumors and 2600 matched normal samples of 19 tissue types, coupled with mathematical modeling and extensive in vitro and in vivo analyses, we identify a simple and actionable set of “rules”. If the rate limiting enzyme of de novo NAD synthesis, NAPRT, is highly expressed in a normal tissue type, cancers that arise from that tissue will have a high frequency of NAPRT amplification and will be completely and irreversibly dependent on NAPRT for survival. Tumors arising from normal tissues that do not highly express NAPRT are entirely dependent on the NAD Salvage-pathway for survival. We identify the previously unknown enhancer that underlies this dependence. NAPRT amplification is demonstrated to generate an absolute, pharmacologically actionable tumor cell dependence for survival; dependence on NAMPT generated through enhancer remodeling is subject to resistance through NMRK1-dependent NAD synthesis. These results identify a central role for tissue context in determining NAD biosynthetic pathway choice, explaining the failure of NAMPT inhibitors, and paving the way for more effective treatments.
Nicotinamide adenine dinucleotide (NAD) is an essential small molecule co-factor in metabolic redox reactions3,4, carrying high energy electrons to support oxidative phosphorylation by reversibly oxidizing or reducing NAD5-9, and serving as a substrate for NAD-dependent enzymes that link cellular metabolism with epigenetic regulation and DNA damage repair3-6,10. Mammalian cells make NAD through: 1) de novo synthesis from tryptophan; 2) generation from nicotinic acid (NA) using the Preiss Handler Pathway (PH) or 3) synthesis from nicotinamide (NAM) or nicotinamide riboside (NR) via the Salvage-pathway (Figure 1A, inset)3,4,8,11-14. The molecular mechanisms that dictate NAD synthesis pathway choice are not well understood.
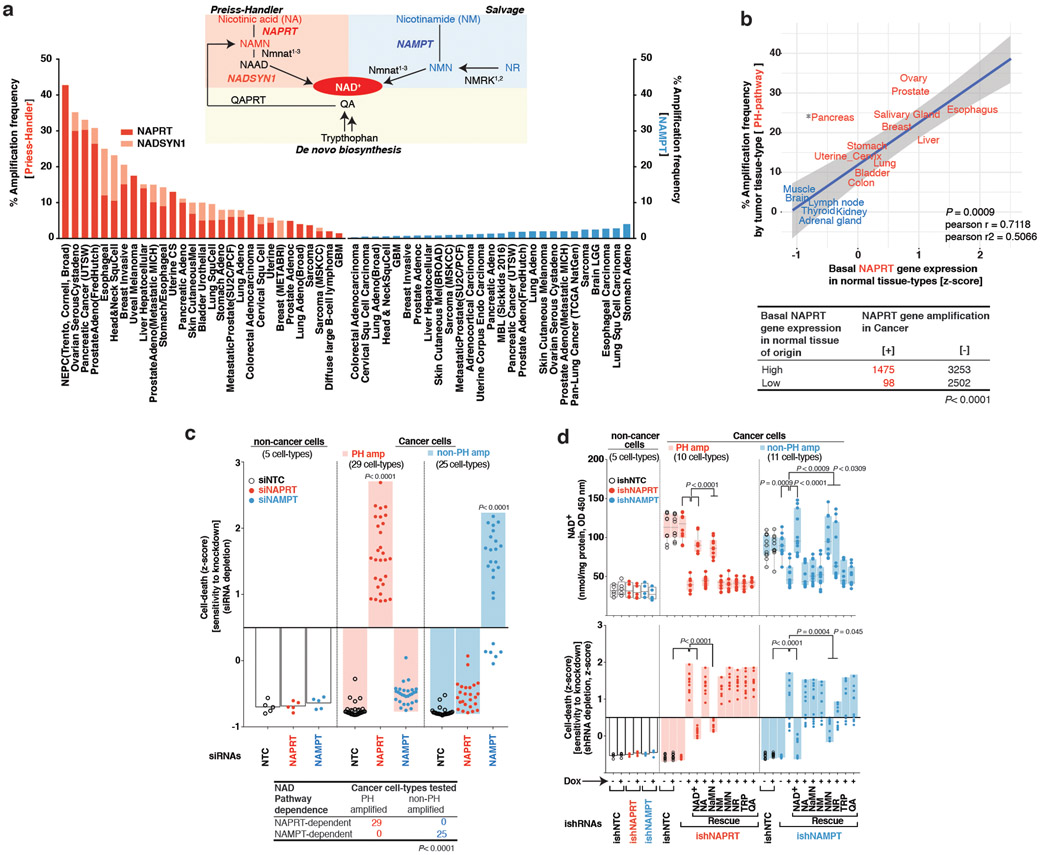
Fig. 1: Tissue lineage-dependent, PH-pathway addiction in cancer driven by gene amplification.
a. NAD+ biosynthesis pathways and gene amplification frequencies in cancer. b. If the rate limiting enzyme (NAPRT) of de novo NAD biosynthesis PH-pathway is highly expressed in a normal tissue-type, cancers that arise from that tissue will have high amplification frequency of genes encoding key enzymes (NAPRT/NADSYN1) of the PH pathway–analysis of >7000 cancer samples of 23 histological types from TCGA, and matched normal tissue samples from GTEx and TCGA. For tissues to be classified as having ‘high’ or ‘low’ expression of the gene critical point of distribution was chosen at 10 RPKM, at which the two distributions have identical density. c. Tissue context determines NAD metabolic pathway dependence of cancer cells–analysis of 54 tumor cell-lines of 13 histological types from NCI-60 panel and 5 non-cancer cell lines. d. Unlike normal cells, PH-pathway amplified tumor cells are completely dependent on NAPRT for survival. Tumor cells lacking these amplicons are entirely dependent on NAMPT for survival. shRNA +/− addback of key pathway intermediates confirms that survival dependence is mediated completely via NAD synthesis. Box and whisker plots showing intracellular NAD+ levels. Centre line, median; box limits; whiskers, min to max, all points. Statistical significance was assessed using Hartigan’s dip test followed by Bayesian probability statistics and Two-sided Fishers exact test (b). Data are representative of three biological replicates, n = 3 (c,d). Data are represented as mean ± s.d, analysed by one-way ANOVA with Tukey’s multiple comparisons test (c,d).
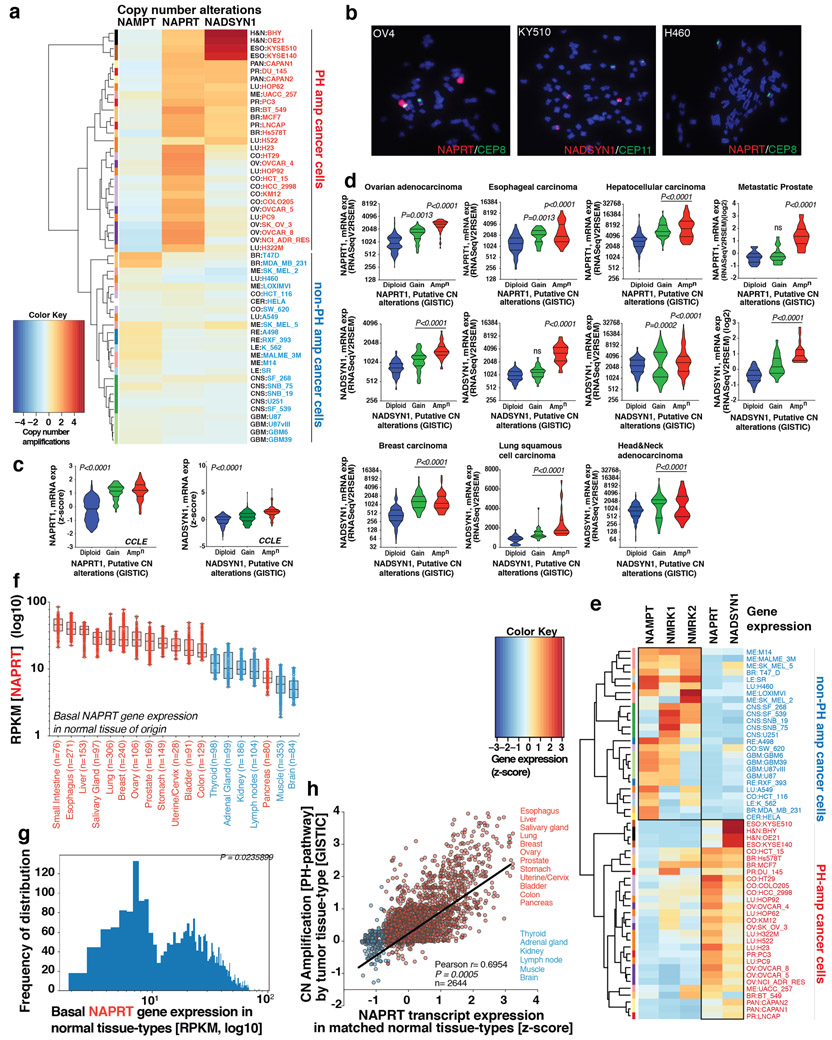
Analysis of 63,865 samples from 216 cancer studies revealed that the rate-limiting enzymes of the PH, Salvage and de novo NAD synthesis pathways, nicotinate phosphoribosyltransferase (NAPRT), nicotinamide phosphoribosyltransferase (NAMPT) and quinolinate phosphoribosyltransferase (QAPRT), respectively, were mutated in <1% of tumors. In contrast, NAPRT and NADSYN1 DNA copy number was increased in many cancer types, including prostate, ovarian and pancreatic (Figure 1A), and in 28/54 cell lines profiled from the NCI-60 panel (Extended Figures 1A,B) and 295/947 (31%) CCLE cell-lines (Extended Figure 1C), significantly elevating gene expression (Extended Figures 1C,D,E).
PH-pathway gene amplification (NAPRT and/or NADSYN1) in 7328 tumors of various histological types was significantly correlated with NAPRT gene expression in 2644 matched normal tissues from which these tumors arose (p<0.0009, Figure 1B). Tissue of origin NAPRT gene expression was bimodally distributed (p<0.02, Supplementary Data Table 1 and Methods), and 1475/1573 NAPRT amplified tumors (93%) arose from tissues expressing high levels of NAPRT transcript (p<0.0001, Methods, Figure 1B, Extended Figures 1F-H), suggesting a role for tissue context in determining which cancers amplify NAPRT.
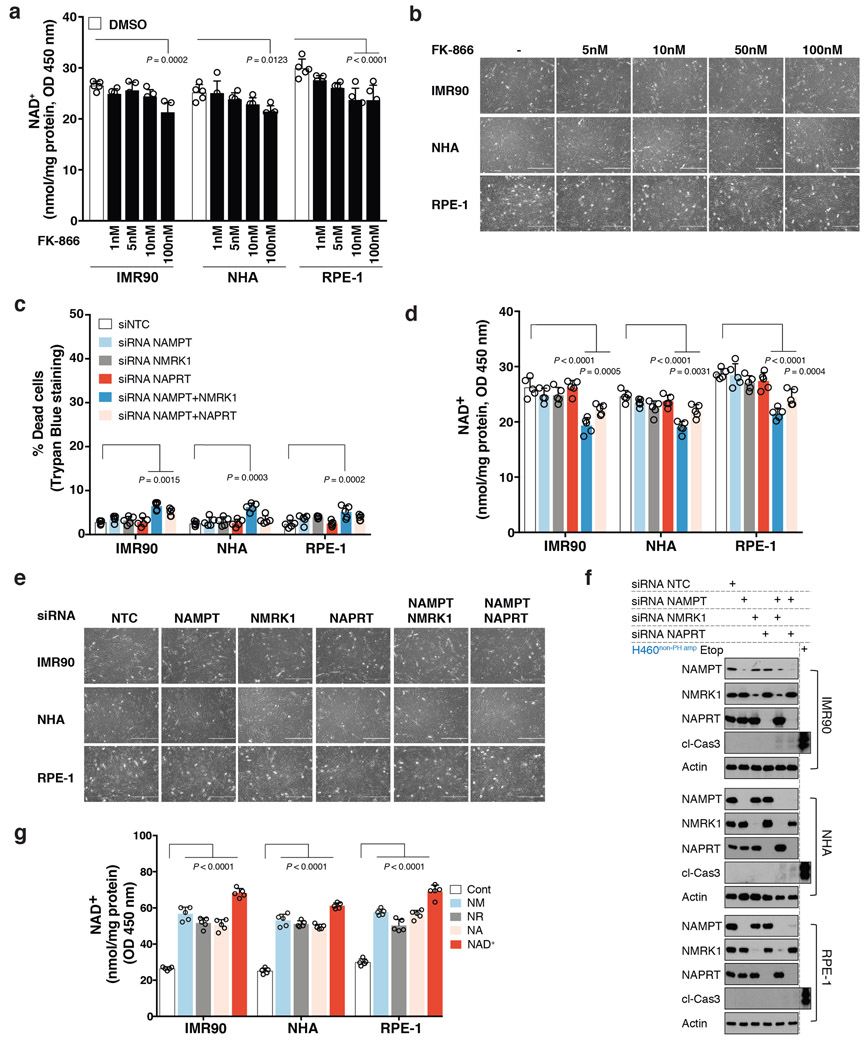
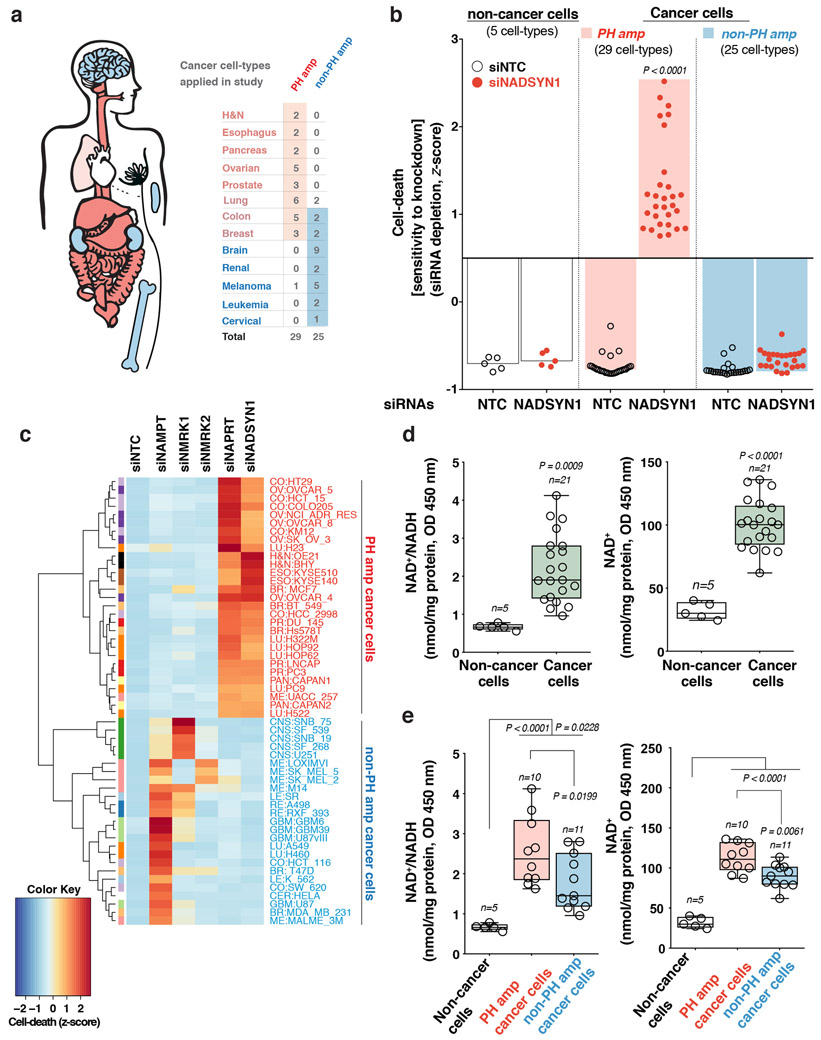
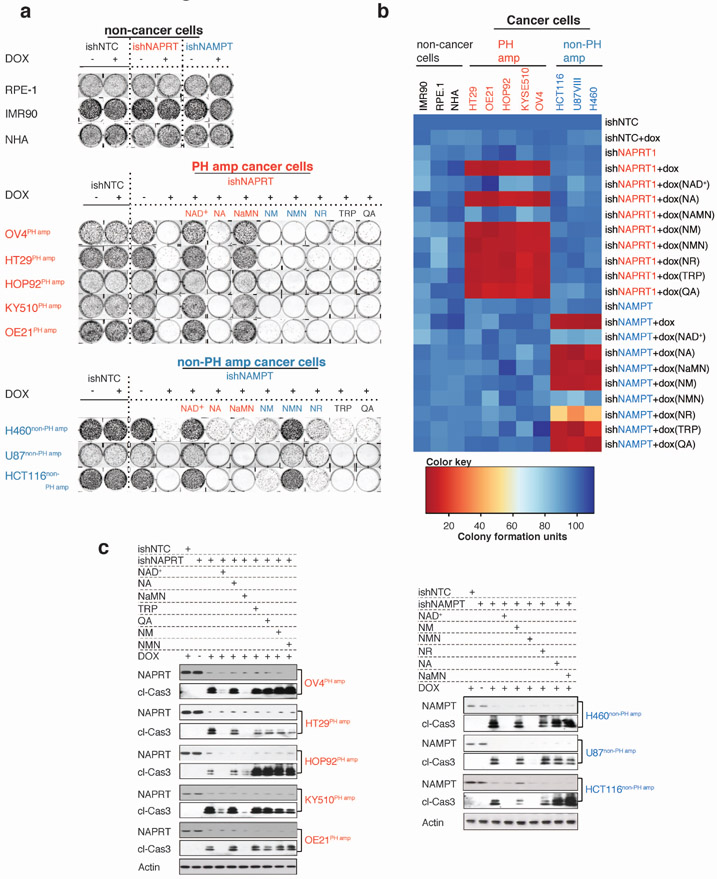
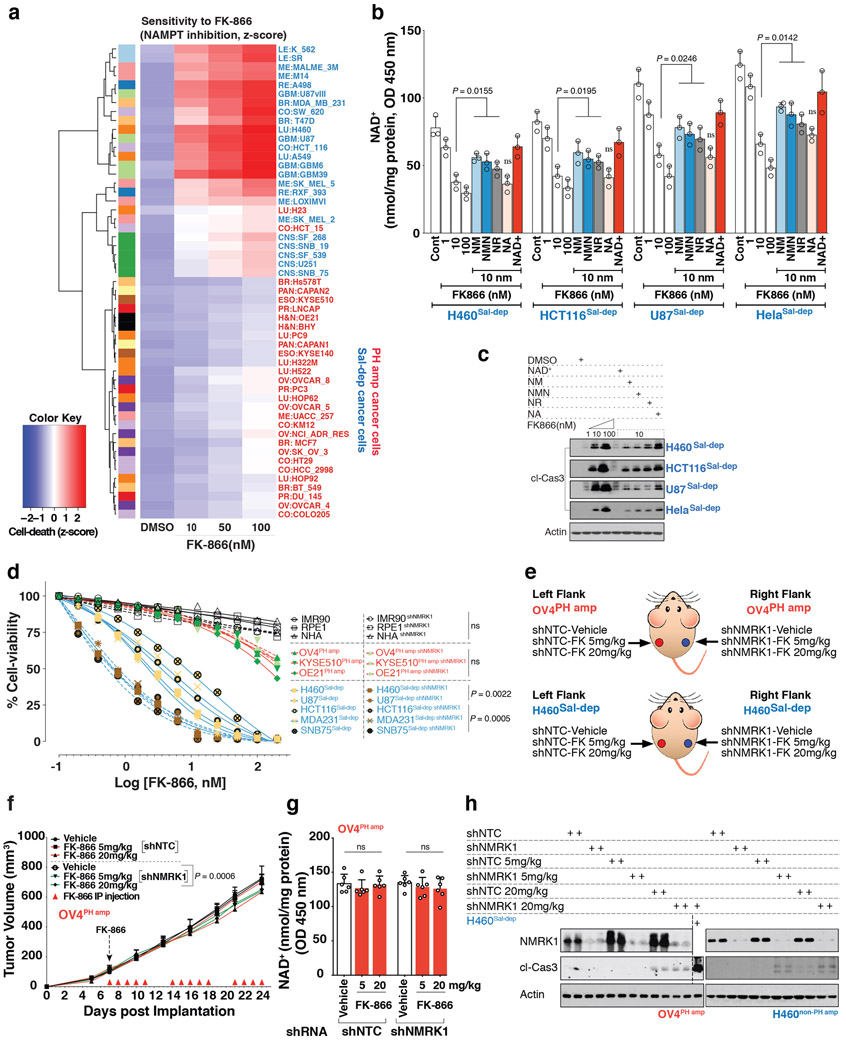
Non-cancerous cells were able to use any of the NAD biosynthetic pathways to maintain intracellular NAD levels and did not die in response to a specific NAMPT inhibitor, FK-866 or small interfering RNA (siRNA)-mediated genetic depletion of the rate-limiting enzymes of de novo NAD synthesis, PH or Salvage-pathways (Extended Figures 2A-G). In contrast, 29/29 cancer cell lines with NAPRT amplification and/or NADSYN1 amplification (PH-amplified), but 0/25 non-PH amplified (non-PH amp) cell lines (Extended Figure 1A), depended on NAPRT and NADSYN1 for survival (Figure 1C, Extended Figures 3A-C, Supplementary Data Table 2). Short hairpin RNAs (shRNAs)-targeting key enzymes of de novo synthesis, PH and Salvage-pathways, confirmed that PH-amplified cancer cells are entirely dependent on the PH-pathway for NAD maintenance and survival. In contrast, non-PH amplified cancer cell-lines depended exclusively on NAMPT and the Salvage-pathway (Figure 1D, Extended Figures 3D, 4A-C).
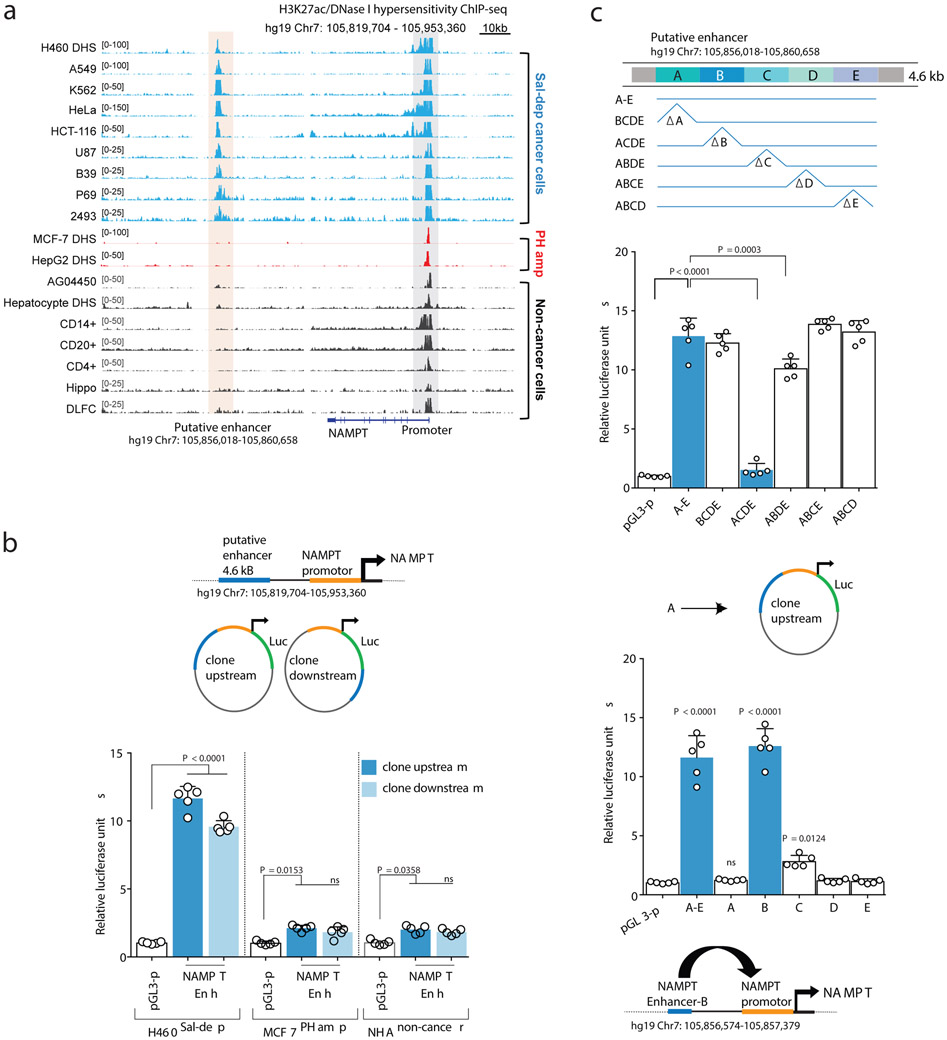
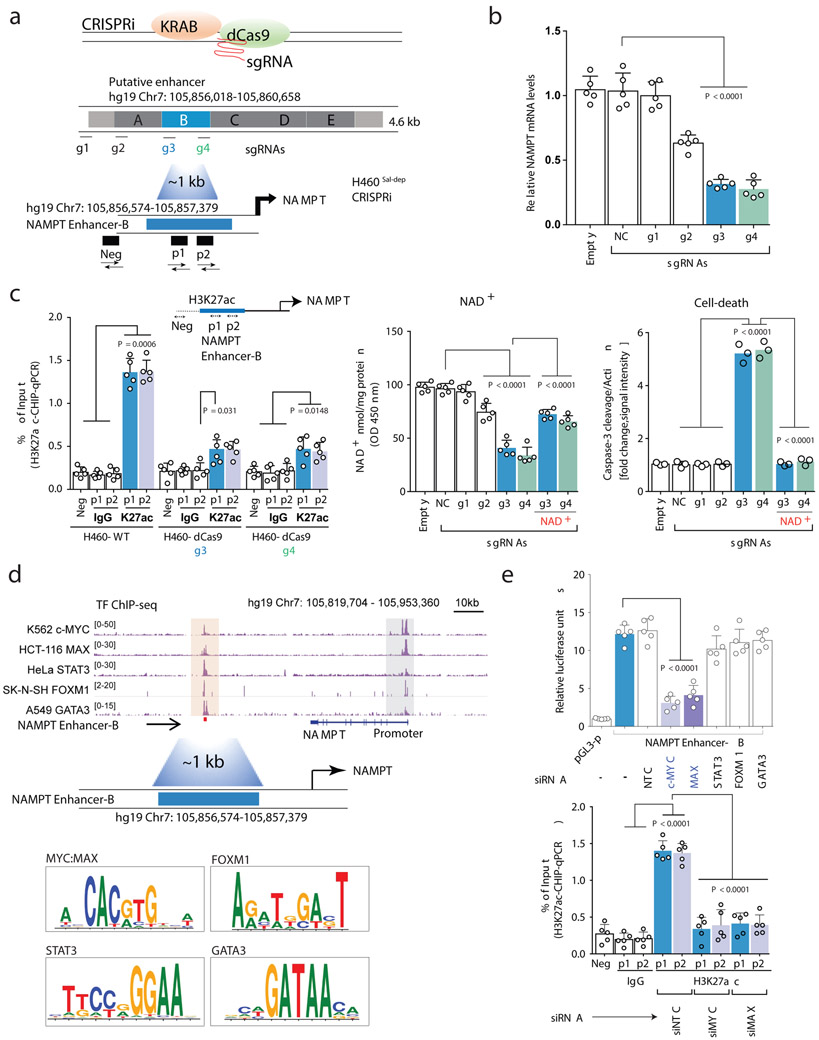
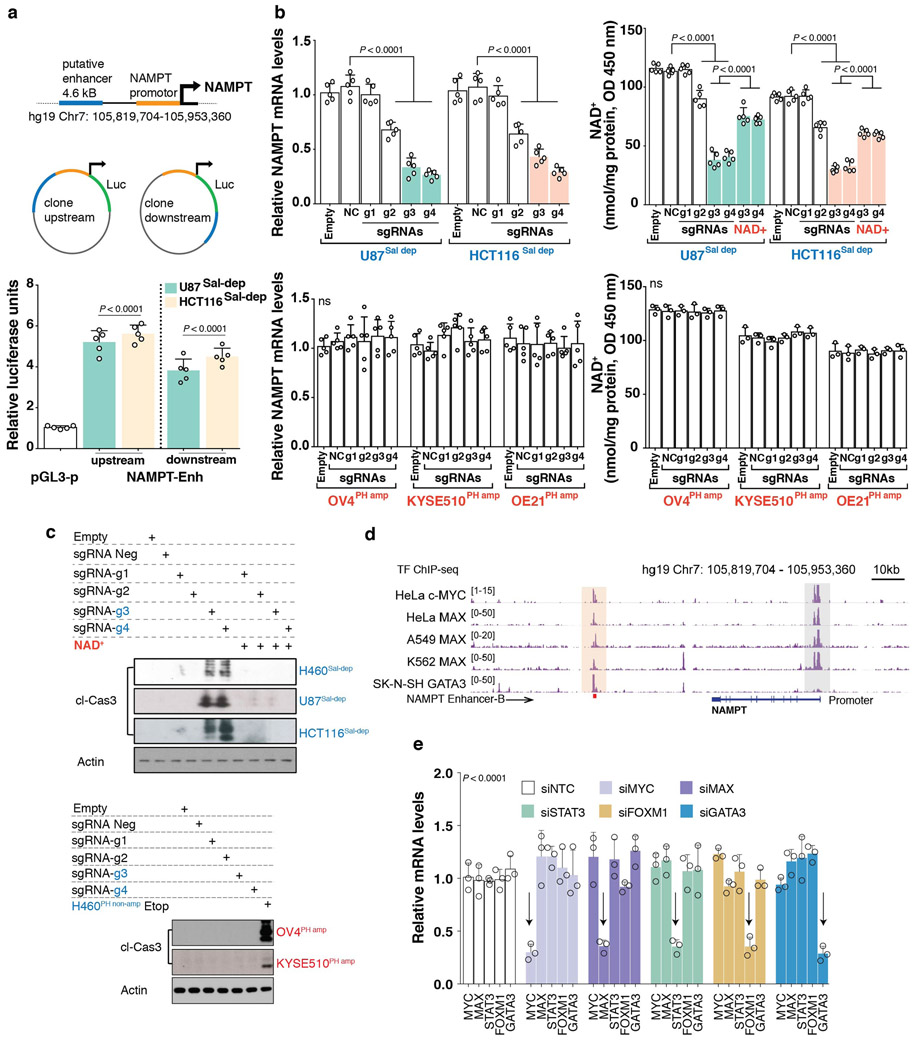
Histone H3 lysine 27 acetylation (H3K27ac) using Chromatin immunoprecipitation followed by sequencing (ChIP-seq)15,16, revealed a long-range, putative NAMPT enhancer 65kb downstream of NAMPT transcription start site (TSS) on Chromosome 7 (hg19: 105,856,018-105,860,658), specifically marked by H3K27ac and/or accessible DNase I hypersensitive (DHS) signal in Salvage-dependent, but not in PH-amplified cancer or normal cell-lines (Figure 2A). This 4.641kb cis regulatory region demonstrated potent enhancer activity when cloned either upstream or downstream of the 1.759kb NAMPT promoter in reporter construct and tested in the Salvage-dependent cancer cell lines, but not in PH-amplified or non-cancer control cell-lines (Figure 2B, Extended Figure 5A). Fine mapping of the 4.6kb putative enhancer by stepwise 1kb deletions or insertions identified the 1kb enhancer “B” region responsible for NAMPT enhancer activity (Figure 2C). CRISPR interference using inactive Cas9 (dCas9) fused to the Krüppel-associated box (KRAB) transcriptional repressor domain17 (Figure 3A), confirmed that enhancer “B”: 1) controls NAMPT gene expression, 2) is the target of H3K27 acetylation, 3) regulates intracellular NAD levels and, 4) is required exclusively for tumor cell survival in an NAD-dependent manner in Salvage-dependent cancer cells (Figures 3B,C and Extended Figures 5B,C).
Fig. 2: Identification of an epigenetic basis for NAMPT-pathway addiction in non-PH amplified Cancers.
a. Genome browser snapshot (top) illustrating H3K27ac and DHS ChIP-seq signal peaks across cancer cell-lines and matched tumor tissue biopsies. Peach shaded region embedding H3K27ac or DHS peaks indicate a putative NAMPT enhancer. b. Putative NAMPT enhancer locus cloned into an engineered luciferase reporter construct, upstream or downstream of the native NAMPT promoter. Bar plot showing luciferase reporter activity. c. Step-wise site-directed mutagenesis to delete or clone (top) small ~1kb long individual enhancer fragments identifies the region required for driving NAMPT transcription in a luciferase reporter assay (bottom). Bar plot showing luciferase reporter activity. Data are representative of five independent biological replicates, n = 5 (b,c). Data are represented as mean ± s.d, analysed by one-way ANOVA with Tukey’s multiple comparisons test (b,c). ns, not significant.
Fig. 3: Dissection of NAMPT enhancer and its regulation in Cancer.
a. Schematic overview (top) of CRISPRi strategy to identify the cis-regulatory element controlling NAMPT pathway addiction in cancer, revealing the specific enhancer element that regulates, b. NAMPT transcript levels, c. H3k27ac ChIP-qPCR (left), NAD+ levels (middle) and Cleaved Caspase-3 abundance (right). d. Genome browser screenshot indicates TF-ChIP-seq signal across multiple cancer cell-types; peach shaded region illustrate putative TF recruitment sites overlapping NAMPT enhancer. TF motif analysis (bottom) e. Bar plots showing luciferase reporter assay (top) and H3k27 acetylation ChIP-qPCR (bottom) to demonstrate Myc-Max dependence of NAMPT enhancer activity. Data are representative of five independent biological replicates, n = 5 (b,c,e). Data are represented as mean ± s.d, analysed by one-way ANOVA with Tukey’s multiple comparisons test (b,c,e).
We examined ChIP-seq data from ENCODE and performed a transcription factor (TF) motif search (Supplementary Data Table 3), focusing on 5 TFs - c-MYC, MAX, STAT3, FOXM1 and GATA3 which bind to the NAMPT distal enhancer for further analysis (Figure 3D and Extended Figure 5D). siRNA-mediated knockdown demonstrated that c-MYC and MAX specifically regulate NAMPT enhancer activity in Salvage-dependent cancer cells, as measured by H3K27ac ChIP-qPCR and luciferase reporter assay (Figure 3E, Extended Figure 5E). These data identify a novel long-range NAMPT enhancer and reveal the epigenetic mechanism underlying the dependence of non-PH-amplified cancer cells on the NAD Salvage-pathway. Future studies will be needed to identify additional transcriptional regulators of this pathway.
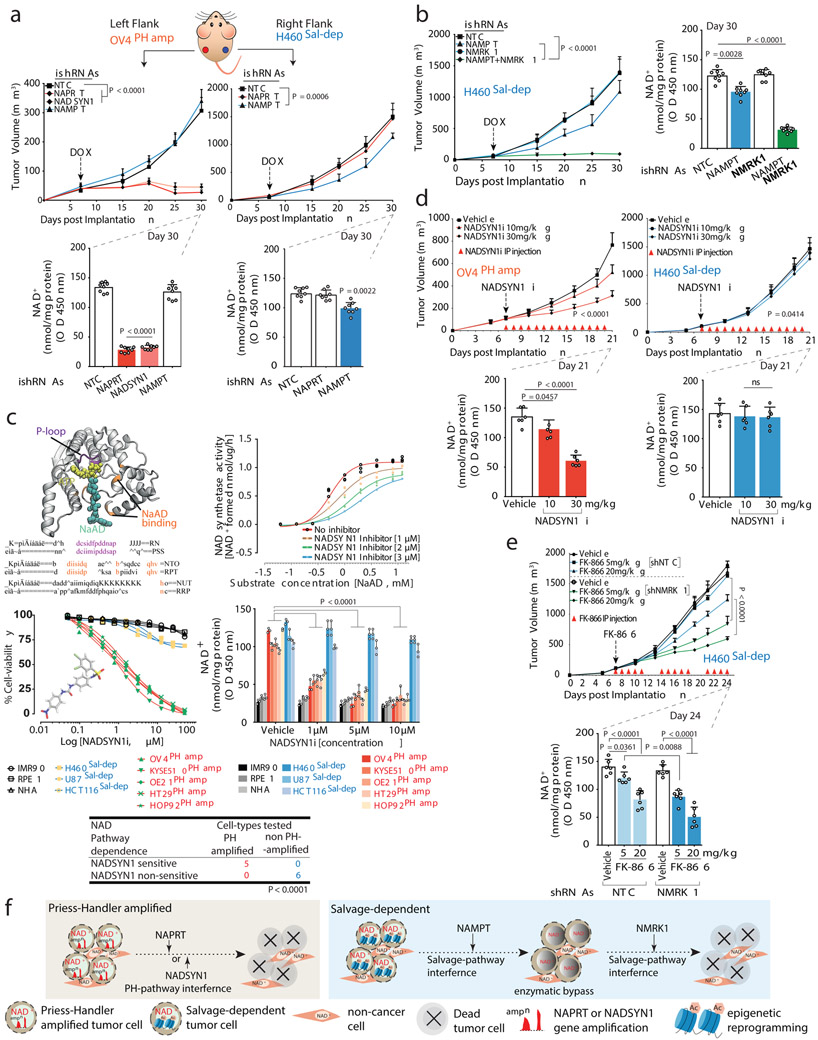
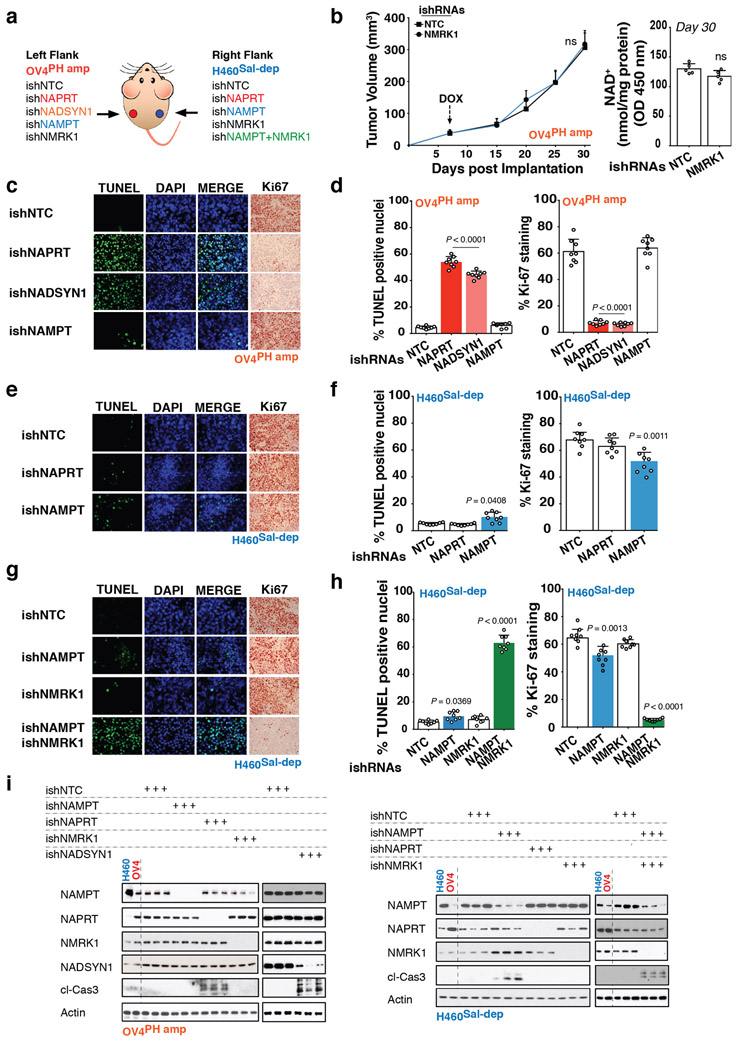
We engineered NAPRT-amplified OV4 ovarian and non-PH pathway amplified H460 lung cancer cells to stably express doxycycline (DOX)-inducible shRNAs targeting NAPRT, NADSYN1, NAMPT or NMRK1, and implanted the OV4 cells into the left flank, and H460 cells into the right flank of nude mice. Intratumoral NAD levels plummeted in OV4 tumors in response to DOX induced expression of NAPRT or NADSYN1 shRNA, causing tumors to completely and durably regress driving massive tumor cell-death. Inducible depletion of NAMPT, or NMRK1 had no effect on intratumoral NAD levels or growth of OV4 tumors in vivo (Figures 4A, Extended Figures 6A-D,I and 7A-D). Therefore, NAPRT-amplified tumors use the PH-pathway exclusively for NAD homeostasis, and are entirely dependent on it for survival.
Fig. 4: PH-pathway survival addiction is not subject to enzymatic bypass, resulting in massive tumor cell death in vivo; epigenetically determined Salvage-pathway dependence is subject to resistance through enzymatic bypass.
a. Tumor volumes (top) of nude mice bearing engineered OV4PH-amp and H460Sal-dep cells implanted subcutaneously into the left or right flank. Intratumoral NAD+ levels (bottom). b. Tumor volume of nude mice bearing engineered H460Sal-dep cells implanted subcutaneously (left). Intratumoral NAD+ levels (right). c. Crystal structure of glutamine-dependent NAD synthetase from B. subtilis, bound to ATP and NaAD. Sequence alignment of P loop (purple) and NaAD binding sites (orange). NAD synthetase activity (top,right) of human recombinant enzyme. Cell viability (middle,left) of non-cancer and cancer cells treated with NADSYNi for 72 h. Intracellular NAD+ levels (middle, right) in non-cancer and cancer cell-lines (‘PH amp’ and ‘Sal-dep’) treated with NADSYN1i. Two-sided Fishers exact test (bottom). d. Tumor volumes (top) of nude mice bearing OV4PH-amp and H460Sal-dep cells implanted subcutaneously into the left or right flank. Mice were IP injected with NADSYN1i once daily. Intratumoral NAD+ levels (bottom). e. Tumor volume of nude mice bearing H460Sal-dep cells implanted subcutaneously into the right flank. Mice were IP injected with FK-866 twice daily. Intratumoral NAD+ levels (bottom). f. Schematic overview of the molecular basis of NAD metabolic pathway addiction in cancer. DOX treatment or drug administration was initiated on day 7 post implantation once the tumors were visible. Data are representative of eight (a,b,d,e: tumor volumes; a,b: NAD+ levels), six (d-e: NAD+ levels) and three (c) independent biological replicates. Mean tumor volume ± s.e.m is shown (n=8 tumors/cohort) with statistical significance assessed using two-way ANOVA to calculate significance on repeated measurements over time. Bar plots are represented as mean ± s.d, analysed by one-way ANOVA with Tukey’s multiple comparisons test (a-e).
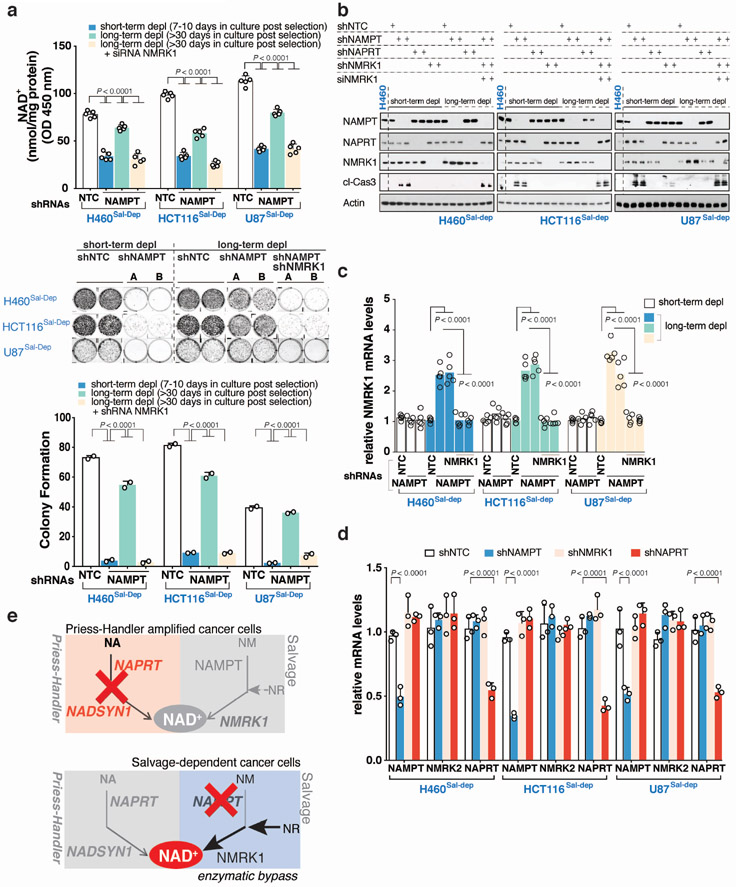
In contrast, the H460 lung cancer cells were insensitive to NAPRT depletion, but experienced a modest reduction in intratumoral NAD levels associated with a small, but significant decrement in tumor proliferation and growth in response to induced NAMPT depletion (Figures 4A, Extended Figures 6A,E,F,I and 7A-D). In skeletal muscle cells, NR has been shown to be an alternative source for NAMPT-independent NAD Salvage synthesis using NMRK18. Endogenous NMRK1 was sufficient to maintain NAD homeostasis and maintain tumor cell-line growth upon NAMPT inhibition (Extended Figures 8A-E). Dual inhibition of NAMPT and NMRK1 caused intratumoral NAD levels to plummet, driving complete and durable tumor regression and massive tumor cell death in vivo (Figure 4B, Extended Figures 6G,H,I and 7A-D), suggesting the need for combined NAMPT and NMRK inhibition in non-PH pathway amplified tumors.
To determine whether NAD biosynthetic dependencies in cancer are pharmacologically actionable, we focused on a substrate competitive inhibitor of bacterial NADSYN119, N-(3,4-dichlorophenyl)-4-{[(4-nitrophenyl)carbamoyl]amino}benzenesulfonamide, hereafter referred to as NADSYN1i. There are no available crystal structures for the human NADSYN1 enzyme, but several high-resolution structures are available for various bacterial species, such as B. Subtilis (PDB ID 1ee1)20. Sequence alignments between the human and B. Subtilis show limited conservation (23%), but a remarkably high degree of sequence conservation in the NaAD binding and ATP binding sites21(Figure 4C). NADSYNi has been suggested to bind competitively to the NaAD binding site of B. Subtilis19,22,23, raising the possibility that NADSYNi could also inhibit the human NADSYN1 enzyme. NADSYN1i inhibited purified human NADSYN1 enzyme activity in a dose-dependent fashion (Figure 4C) and potently and selectively inhibited PH-amplified cancer cell line growth, lowering NAD levels, while having negligible effect on non-PH amplified cancer or normal cells (Figure 4C). NADSYNi significantly inhibited growth of NAPRT amplified OV4 ovarian tumors and lowered intratumoral NAD levels in mice in a dose dependent manner, while having minimal effect on NAD levels or tumor growth in salvage-dependent, H460 lung tumors (Figure 4D).
In contrast, NAMPT inhibitor, FK-866 selectively inhibited the growth of salvage-dependent, cancer cell lines in vitro (Extended Figures 9A-D) and inhibited the growth of H460 lung tumors in mice in a dose-dependent fashion, while having no effect on PH-amplified OV4 tumors in vivo (Figure 4E and Extended Figures 9E-H). Consistent with a central role for NMRK1 in bypassing NAMPT dependence, depletion of NMRK1 by shRNA knockdown significantly lowered the dose of FK-866 needed to inhibit growth of salvage-dependent non-PH pathway amplified tumors in vitro and in vivo (Figure 4E and Extended Figures 9D-H).
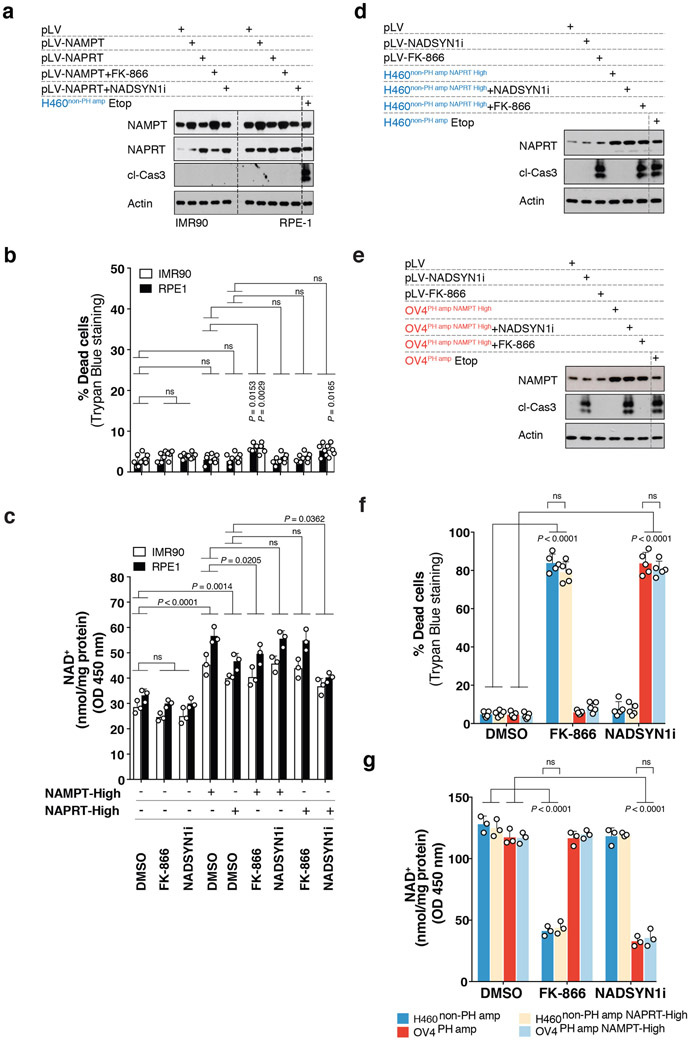
Neither NAPRT nor NAMPT overexpression sensitized non-cancer cells (IMR90 and RPE-1) to NADSYN1i or FK-866 (Extended Figures 10A-C). Further, neither NAMPT overexpression in OV4 nor NAPRT overexpression in H460 cancer cells enabled tumor cells to switch their pathway dependence (Extended Figures 10D-G). Therefore, additional changes are likely to occur during tumorigenesis that contribute to NAD pathway addiction.
The complex interaction between local tissue contexts, lineage-dependent transcriptional repertoires, and altered tumor cell genotypes, and how this interaction affects which particular enzymes cancer cells depend on for survival, is not well understood, raising a critical challenge for translating biochemical and genetic insights about the metabolic landscape of cancer, into more effective treatments for patients. The results presented here suggest that NAD pathway dependence in cancer arise from tissue-lineage-based gene amplification and epigenetic remodeling, revealing genotype-selective, pharmacologically actionable dependencies that may potentially be used to develop more effective, precision cancer treatments targeting NAD metabolism.
Methods:
Cell-lines and Cell-culture:
The NCI-60 cell-line panel (gift from A. Shiau, obtained from NCI) was grown in RPMI-1640 with 10% FBS under standard culture conditions. LNCaP, PC9, CAPAN1, U-87, HEK293, IMR90, HeLa, RPE-1 and MCF10A used in this study were obtained from ATCC and grown according to ATCC recommendations. Normal human astrocytes (NHA) were obtained from Lonza and cultured according to Lonza-specific recommendations. GBM39 and GBM6 patient-derived neurosphere lines were cultured in NeuroCult medium supplemented with epidermal growth factor, fibroblast growth factor, and heparin. KYSE-510, KYSE-140, BHY were obtained from Leibniz-Institut DSMZ-Deutsche Sammlung von Mikroorganismen und Zellkulturen GmbH, Germany, while OE21 was obtained from Sigma and maintained in RPMI-1640 with 10% FBS under standard culture conditions. Cell lines obtained from NCI, ATCC, DSMZ and Sigma were not authenticated. All cell lines were tested for mycoplasma contamination. All cells were cultured in a humidified incubator with 5% CO2 at 37°C. Standard cell-culture media formulations for both cancer and non-cancer models are supplemented with Nicotinamide (NM, 4mg/ml) and Trypthophan (TRP, 16mg/ml) but so far have not been shown to contain traces of Nicotinic acid (NA) and Nicotinamide riboside (NR) as NAD precursor. To address this issue, our experimental cell-culture model system, cells not only had the constant access NM and TRP but also to the missing two precursors, NA (4 mg/ml) and NR (4mg/ml).
Reagents and chemicals:
NM (N0636), NA (N0761), Nicotinic Acid Mononucleotide (NaMN, N7764), TRP (T8941) was purchased form Sigma-Aldrich. Nicotinamide mononucleotide (NMN, 1094-61-7), QA (89-00-9) and NR (1341-23-7), FK-866 (658084-64-1), was purchased form Cayman chemicals, NADSYN1i was purchased form Vitas-M Laboratory (STK459768).
Plasmids:
We developed a luciferase reporter system to assess genomic DNA fragments for promoter and enhancer activity. NAMPT promoter only when cloned upstream of the reporter gene should be able to activate luciferase reporter gene in a plasmid that does not already contain a promoter, while an enhancer is able to activate the luciferase reporter gene when cloned upstream or downstream of this reporter gene in a plasmid already containing an NAMPT promoter. The putative NAMPT enhancer (hg19_dna Chr7: 105,856,018-105,860,658) and the established NAMPT promotor (hg19_dna chr7:105,925,229-105,926,250) were PCR amplified (Clontech, PrimeSTAR GXL DNA #R050A) from human genomic DNA (Bacterial artificial chromosomes, BACPAC Resources Center (BPRC), clone #RP11-151E21, Chromosome: chr7: 105,925,229-105,926,250). The pGL3 Basic (Promega, #E1751) plasmid was digested with BglII/HindIII (New England Biolabs (NEB)) and the NAMPT promotor insert was ligated into a position upstream of the luciferase reporter gene generating pGL3-p reporter construct. To clone the putative NAMPT enhancer, pGL3-p promoter plasmid was digested with MLUI/XHOI (NEB) and the putative NAMPT enhancer insert was ligated into a position upstream of the NAMPT promotor and luciferase reporter gene24, generating the NAMPT-Enh reporter construct (clone upstream). To clone the putative NAMPT enhancer downstream of reporter gene, pGL3-p reporter construct was digested with XBAI and the putative NAMPT enhancer insert was ligated into a position downstream of the NAMPT promotor and luciferase gene24, generating the NAMPT-Enh reporter construct (clone downstream). The internal region of the NAMPT enhancer is identical in both inserts, allowing cloning of a single PCR product into either construct. To dissect the NAMPT enhancer core, deletion mutants were generated using step-wise site-directed mutagenesis approach (Agilent, QuikChange II Site-Directed Mutagenesis #200523) to delete small ~1kB enhancer fragments from the NAMPT-Enh reporter construct generating distinct NAMPT-Enh reporter constructs (BCDE; ACDE; ABDE; ABCE; ABCD). To individually clone small putative NAMPT enhancer fragments, pGL3-p promoter plasmid was digested with MluI/XhoI and ~1kB long NAMPT enhancer fragments inserts PCR amplified from human genomic DNA were ligated into a position upstream of the NAMPT promotor and luciferase reporter gene, generating distinct NAMPT-Enh reporter constructs (A; B; C; D and E). Stable cell lines overexpressing either NAMPT, NAPRT or NMRK1 were established using the lentiviral expression system. Briefly, nampt-FLAG, naprt-FLAG or nmrk1-FLAG plasmids were generated by cloning the respective cDNA into the p3xFLAG-tagged pLV cs2.0 lentiviral expression vector. The plasmid vector was digested using BAMHI and XMAI restriction sites. The PCR products were cloned into the digested plasmid using ligation independent cloning methodology using exonucleaseIII. Primers used are listed in Supplementary Table 4.
Pan-cancer copy number alteration (CNA) analysis:
Pan cancer CNA data from 7328 tumor-tissue samples of 23 histological types was obtained from The Cancer Genome Atlas (TCGA). CNA data for the entire cohort was downloaded and analyzed using cBioPortal25 (www.cbioportal.org). CN amplification data sets within the portal were generated by GISTIC algorithm identifying significantly altered regions of amplification or deletion across sets of patients. GISTIC derived copy number analysis indicate copy-number level per gene, where "−2" is a deep loss (homozygous deletion), "−1" is a shallow loss (heterozygous deletion), "0" is diploid, "1" indicates a low-level gain, and "2" is a high-level amplification. mRNA data used for this analysis was RNA Seq V2 RSEM.
Estimation of lineage specific amplification frequency model:
Basal normalized NAPRT transcript expression (Reads Per Kilobase of transcript, per Million mapped reads (RPKM), z-score) from 19 normal tissue of origin (2644 normal tissue sample) was obtained from Genotype-Tissue Expression data26 (GTEx) and TCGA27 to compute correlations between tissue-specific gene expression and Tissue lineage-dependent PH-pathway gene amplification from matched 23 tumor-types (7328 tumor tissue samples). Processed RNA-Seq files for each sample were downloaded from GDC (https://portal.gdc.cancer.gov/repository) and GTEx data portals (https://gtexportal.org/home/datasets). If the rate limiting enzyme (NAPRT) of de novo NAD biosynthesis PH pathway is highly expressed in a normal tissue type, cancers that arise from that tissue will have high amplification frequency of genes encoding key enzymes (NAPRT/NADSYN1) of the PH pathway. To compute tissue lineage-dependent association between genotype and NAPRT gene expression, Pearson correlation was tested between basal NAPRT transcript expression (RPKM) in normal tissue of origin vs frequency of PH pathway CN amplification in the corresponding tumor tissue-types. This statistically confirmed a strong correlation between normalized transcript expression of NAPRT enzyme in a normal tissue of origin and the probability of CN amplification of PH pathway enzymes in corresponding tumor tissue-type. To further compute the significance of this observation, we made three assertions. Specifically, if samples from a normal tissue of origin, T have ‘high’ expression of the NAPRT gene, close to 50% of the tumor samples from T have PH-pathway CN amplification. In contrast, if a normal tissue of origin, T has ‘low’ expression, less than 10% of the tumor samples from T contain PH-pathway CN amplification.
Basal normalized NAPRT transcript expression (RPKM) in normal tissue of origin in samples across all normal tissue types are bimodally distributed and can be treated as being sampled from one of two distributions (denoted as ‘high’ and ‘low’) [Dip Test of Unimodality Extended data Fig. 1G].
Basal normalized NAPRT transcript expression in all samples from a tissue can be assigned to one of the two distributions but not both. Therefore, each tissue can be classified as having ‘high’ or ‘low’ expression of the gene.
Frequency of CN amplification in a tissue is strongly associated with its classification as ‘high’ or ‘low’ [Two-sided Fishers test, Fig. 1B].
For assertion 1, we computed the distribution on normalized NAPRT gene expression (RPKM). We combined all normalized NAPRT transcript expression data from 2644 samples from 19 normal tissue of origin available from TCGA and GTEx project and generated a frequency distribution. Using Hartigan’s dip test28 with a null hypothesis of unimodality a p-value of 0.0235899 was obtained, suggesting that we can reject the null hypothesis. We chose the critical point of the distribution as 10 RPKM. The critical point is defined as the point at which the two distributions have identical density. Given NAPRT gene expression x from a sample, let P(x∣C1) denote the probability that it is drawn from C1. Assuming normality of the two distributions based on the law of large numbers, we computed the mean and standard deviation of each distribution to obtain C1(μ1, σ1) and C2(μ2, σ2). For the 2644 samples, we obtained (μ1 , σ1) = (6.1935,1.9625), and (μ2, σ2) = (30.906,13.8312) and refer to C1 C2 as ‘low’ and ‘high’ respectively.
We set,
Tissue can be modeled of as a collection of independent sample NAPRT gene expression values, denoted by T = (x1, x2, …, xk}. The posterior probability of a distribution label C for tissue type T can be computed using the Bayesian formula,
Please refer to Supplementary data Table 1 for the posterior class probability of each tissue type. Since Supplementary data Table 1 shows that we can assign a classification for each tissue-type with high confidence. To validate the final assertion, we obtained 7328 tumor samples from 23 tumor-types and assigned to each sample a classification of ‘high’ or ‘low’, based on tissue-type, as well as a binary classification of containing a copy number amplification or not. The 2x2 contingency table for Two-sided Fisher’s exact test in Fig. 1B partitions 7328 tumor samples from 23 tumor-types based on the amplification frequency of genes encoding key enzymes (NAPRT/NADSYN1) of the PH pathway and basal NAPRT transcript expression classification. We used the Fisher’s exact test (Fig. 1B) to test for a null hypothesis of no-association and obtained a p-value of 1.7259e-211, suggesting that we can reject the null hypothesis.
Transient and stable knockdown of genes using siRNA, shRNA and ishRNA:
Transient gene-silencing experiments were performed reverse transfecting siRNAs using Lipofectamine RNAiMAX Transfection Reagent (ThermoFischer Scientific) in growth media supplemented with 10% FBS. Growth media was replaced after 24 h post transfection while cells were harvested 72 h posttransfection. ON-TARGETplus SMART siRNA pools and their deconvoluted versions (Dharmacon), also including Silencer select siRNA’s (Ambion-ThermoFischer Scientific) were used to target NAMPT, NMRK1, NMRK2, NAPRT and NADSYN1. Silencer® Select Negative Control #2 siRNA (Ambion-ThermoFischer Scientific) that does not target any gene product was used as a negative targeting control. For generation of stable knockdown of cell lines lentiviral packaging/delivering system was performed. shRNA expressing pLKO.1 vector was introduced into cancer cell lines by lentiviral infection. Recombinant lentiviral particles were generated by transient transfection of HEK293T cells following a standard protocol. HEK293T cells were plated in a 100-mm dish and transfected (Xtremegene, Roche) with 6 μg of lentiviral DNA and lentiviral packaging system consisting of 0.6 μg of Rev, 0.6 μg of Gal/pol, 0.6 μg of TAT and 6 μg of VSVG. Viral supernatant was collected at 48 h and 72 h post transfection, centrifuged and filtered (0.45 μm) to remove any HEK293T cells. For transduction and stable knockdown of cell lines, lentiviral particles generated were added to cell culture medium containing 4 μg/ml polybrene (Millipore). Forty-eight h post infection, cells were selected using 1mg/ml puromycin for at least one week before being used for further experiments. For generation of stable inducible knockdown of cell lines lentiviral delivering system similar to the procedure described above was performed with the exception of using SMARTvector inducible system (Dharmacon) and also that cells were maintained in dialyzed 10% FBS when generating lentiviral packaging/delivering system for transduction. For inducible RNAi experiments, stable knockdown of respective genes was induced using doxycycline at concentrations of 1.0–2.0 mg ml−1. Sequence of siRNA, shRNA, ishRNA and relevant controls used in the study are listed in Supplementary Table 4.
Cell-death, apoptosis, viability and colonogenic assay:
To examine cell death, cells were treated as indicated in the Figure legends and stained with propidium iodide (Sigma-Aldrich). Adherent and floating cells were then analyzed by flow cytometry using the BD LSRII flow cytometer (BD Biosciences). Data analysis was performed using the FlowJo. For siRNA screen, cells were seeded in duplicate for each condition in six-well culture plates at 100,000-200,000 cells per well. Cell death analyses was performed after 72 h post-transfection. For shRNA screen, cells were seeded in duplicate for each condition in 60 mm dishes at 500,000 cells per dish. Cell death analyses was performed after 7-10 days post infection/selection. For apoptosis assays, adherent and floating cells were lysed and homogenized with RIPA lysis buffer and immunoblotted for cleaved caspase-3 by western blotting. When measuring apoptosis after siRNA transfection, cells were harvested 72 h post transfection, while for shRNA, cells were harvested 7-10 days post infection. To examine cell-viability, cells were seeded in triplicate for each condition in six-well culture plates at 150,000-200,000 cells per well. Cell-viability was analysed 72 h post siRNA transfection or FK-866 treatment29. Total and live cells in each well were quantified by Trypan blue (Gibco) assay using a TC10 automatic cell counter (Bio-Rad). For clonogenic colony-formation assays, 300-500 cells were seeded in duplicate into six-well plates. Growth media was replaced every 2 days. At the indicated time point of ~2 weeks, remaining cells were fixed with 80% methanol and stained with crystal violet solution. Images were taken using digital imaging scanner (Bio-Rad). Colony formation was quantified by ImageJ software (NIH).
Immunoblottting and antibodies:
Cells were washed twice in ice-cold phosphate-buffered saline (PBS), scraped and collected as pellets post centrifugation at 14,000 r.p.m. for 5 min. The pelleted cells were lysed with RIPA lysis buffer supplemented with Protease Inhibitor Cocktail (PIC) and phosphatase inhibitors. Lysates were collected and centrifuged at 14,000 r.p.m. for 10 min at 4°C. Protein concentrations were determined by Bradford Assay using the Protein Assay Dye Reagent Concentrate. Equal amounts of protein extracts were separated and immunoblotted by SDS-PAGE 4%–12% NuPAGE Bis-Tris Mini Gel (ThermoFischer Scientific). Proteins were later transferred using the Trans-Blot Turbo Transfer System (Bio-Rad) onto nitrocellulose membranes according to standard protocols. Membranes were blocked at room temperature with 5% bovine serum albumin in Tris Buffered Saline with Tween buffer and incubated over-night with corresponding primary antibodies. Membranes were later incubated at room-temperature with horseradish peroxidase-conjugated secondary antibodies. The immunoreactivity was detected with SuperSignal West Pico or Femto Chemiluminescent Substrate (Thermo Scientific). The following antibodies were used: PBEF/NAMPT (Cell Signalling Technologies (CST), D1K6D #61122), NAPRT1 (ThermoFischer Scientific, #PA5-31880), NAD Synthetase (Abcam, ab171942), NMRK1 Antibody (Santa cruz, F-8 #sc-398852), NMRK1 (Abcam, Anti-C9orf95 antibody EPR11190 #ab169548), NMRK2 or ITGB1BP3 (ThermoFischer, #PA5-24607).
RNA Extraction and Real-Time PCR (RT-PCR):
Total RNA was extracted using RNeasy Mini Kit (QIAGEN). First-strand cDNA was synthesized using the SuperScript VILO cDNA synthesis kit (ThermoFischer Scientific). Real-time RT-PCR was performed using the iQ SYBR Green Supermix (Bio-Rad) on the CFX96 Touch Real Time PCR Detection system (Bio-Rad) following the manufacturer’s instructions. Results were normalized to TBP, B2M, YWHAZ or RPL13A as the reference gene. Results were analyzed using the delta Ct. Primer sequences are listed in Supplementary Table 4.
DNA copy number:
NAPRT, NADSYN1, NAMPT, NMRK1, NMRK2 copy number was quantified by real-time quantitative PCR (q-PCR), using the CFX96 Touch Real Time PCR Detection system (Bio-Rad). RPPH1 and HBB were used as single copy reference control. PCR primer sequences for NAPRT, NADSYN1, NAMPT, NMRK1, NMRK2, RPPH1 and HBB are listed in Supplementary Table 4. PCR primer (IDT) and the region of interest was selected by Primer Blast (https://www.ncbi.nlm.nih.gov/tools/primer-blast/) and USCS genome browser (http://genome.ucsc.edu/cgi-bin/hgGateway). Genomic DNA from five non-cancer and fifty-four cancer cell models was investigated. PCR reactions were carried in a final volume of 20ul containing 20ng genomic DNA (Qiagen), 300nM primer and 1x SYBR green PCR Master Mix (Bio-Rad). PCR conditions are as follows: one cycle at 95°C for 5 min, followed by 40 cycles each at 95°C for 15 sec and 60°C for 1 min. Samples were analyzed in triplicates. Each amplification reaction was checked for the absence of non-specific PCR products by melting curve analysis. NAPRT, NADSYN1, NAMPT, NMRK1, NMRK2 copy number analysis was carried out using the comparative Ct method after validating that the efficiencies of PCR reactions of reference controls and genes under investigation are equal. Increase in gene copy number by 3–4 copies was defined as ‘gain’ while increase of ≥ 5 copies was categorized as ‘amplification’. Primer sequences are listed in Supplementary Table 4.
Fluorescence in situ hybridization (FISH):
Cells in log-growth phase were arrested in metaphase by the addition of KaryoMAX (Gibco) for 2 h. Cells were then collected and resuspended in a hypotonic solution (0.075 M KCl) for 15-30 min. Carnoy’s fixative (3:1 methanol: glacial acetic acid) was added to stop the reaction. Double FISH was performed on the fixed metaphase spreads by adding the appropriate target DNA and centromere FISH probe. DNA was denatured at 75 °C for 3–5 min and the slides were allowed to hybridize overnight at 37 °C in a humidified chamber. Post overnight incubation slides were washed in pre-warmed 0.4× SSC at 50 °C for 2 min, followed by a final wash in 2× SSC 0.05% Tween-20. DAPI was used to counterstain metaphase cells and interphase nuclei and images were captured30. FISH probes were purchased from Empire Genomics.
NAD Measurement:
Intracellular NAD pools were measured using NAD/NADH kit from Abcam (ab65348) according to the manufacturer’s instructions.
NAD Synthetase 1 enzyme activity assay:
NAD synthetase activity 1 of the human recombinant protein is based on fluorometric measurements of NAD+ formed in the absence and presence of NADSYN1i. Purified recombinant NADSYN1 (0.4 μg) was incubated with varied concentrations of NaAD+ (0-12 mM; 1mM for a standard reaction) in the presence of saturating glutamine (20 mM) or 20 mM NH4Cl as indicated in the reaction mixture (50 mM HEPES (pH 8.8), 2 mM ATP, 56 mM KCl, 5 mM MgCl2, and 10 μg of bovine serum albumin. When glutamine was used as a substrate to measure NADSYN1 activity, 50 mM Tris-HCl (pH 7.5) was included instead of 50 mM HEPES (pH 8.8). The reaction mixture was incubated for 30 min at 37 °C. The enzyme reaction were terminated by adding 7 N NaOH and then incubated at 37 °C for 30 min to obtain the fluorescent product. Final product of the assay was measured by detecting Fluorescence using 380 nm for excitation and 460 nm for emission. Fluorescence intensity of NAD+ standards at known concentrations under similar reaction conditions was used to calculate the amount of NAD+. Specific NAD synthetase 1 activity was determined by subtracting the NAD+ content of enzyme-deficient blanks from the NAD+ content of the complete reaction mixture21,31,32.
Metabolic rescue experiments:
For NAD+ rescue experiments, 200 μM of NAD+ (Sigma-Aldrich) was added to growth medium. For metabolic precursor rescue experiments, 500 μM of NA, NaMN, NM, NMN, NR, TRP or QA was added independently to growth medium. Cells were treated with NAD+ or with individual precursors for the time-periods as indicated in Figure legends.
ChIP seq analysis:
ChIP seq data for H3K27ac; DHS; and TF-CHIP seq data for c-MYC, MAX, STAT3, FOXM1 and GATA3 are public data sets available through Encyclopedia of DNA Elements (ENCODE) Consortium, UCSC. We used the Fisher’s exact test (Fig. 2A) to test for a null hypothesis of no-association and obtained a p-value of 4.1 e-05, suggesting that we can reject the null hypothesis. The putative enhancer was found specifically activated and accessible in 9/9 Salvage-dependent cancer models, but not (0 of 9) in the PH-amplified cancers or normal cell models.
CRISPRi-mediated repression of the enhancer region:
CRISPRi/dCas9 sgRNAs were identified using the MIT CRISPR Design tool, and control, non-targeting sgRNAs were selected from the GeCKOv2 library54. All sgRNA sequences are listed in Supplementary Table 4. For repression of the NAMPT enhancer, lenti-KRAB-dCas9-blast was kindly provided by Mathew Meyerson and Xiaoyang Zhang33. sgRNAs were cloned into lentiGuide-Puro using BsmBI as the restriction site (Addgene, 52963). Salvage dependent H460Sal-dep, U87Sal-dep and HCT116Sal-dep cancer cells were first infected with lenti-KRAB-dCas9-blast and selected with 6 μg/ml blasticidin. Cells stably expressing KRAB-dCas9 were then subsequently infected with sgRNAs and selected with 2 μg/ml puromycin.
Chromatin immunoprecipitation (ChIP)–qPCR.
ChIP experiments were performed according to the manufacturer’s instructions (CST, D1K6D #9004). In brief, around 1–2 × 10⁷ cells were crosslinked with 1% formaldehyde for 10 min at room temperature. Cells were washed twice in ice-cold PBS, scraped in ice-cold PBS + PIC and collected as pellets post centrifugation at 2,000 x g for 5 min at 4°C. Nuclei pellet was incubated with Micrococcal Nuclease for 20 min at 37°C with frequent mixing to digest DNA to length of approximately 150-900 bp. Samples were sonicated to break nuclear membrane and centrifuged at 9,400 x g for 10 min at 4°C to clarify lysates. Chromatin samples were treated with RNaseA (5 μg ml−1) and protease K (0.2 mg ml−1) and purified using DNA purification spin columns. For chromatin immunoprecipitation 5 to 10 μg of digested, cross-linked chromatin per immunoprecipitation was used. Positive control Histone H3 (CST, D2B12 #4620) and negative control normal Rabbit IgG (CST, #2729 samples) was included in all ChIP-qPCR experiments to test for the enrichment of RPL30 promotor. Sonicated chromatin samples were incubated with 5 μg H3K27ac antibody (Active motif, #39133) or respective controls at 4°C with rotation. After overnight incubation, protein G Magnetic beads were added to the ChIP reactions and incubated for additional four hours at 4°C with rotation to collect the immunoprecipitated chromatin. Magnetic beads were subsequently washed twice, each with 1 ml of low to high salt buffer. The chromatin was eluted in CHIP elution buffer upon incubation of magnetic beads at 65°C for 30 min with gentle mixing. Input and chromatin samples were treated with 0.1 M NaCl, Proteinase K (0.2 mg ml−1), RNaseA (5 μg ml−1) and reverse crosslinked at 65°C overnight followed up with purification using DNA purification spin columns. Quantitative PCR was performed on the purified ChIP DNA using iQ SYBR Green Supermix (Bio-Rad) on the CFX96 Touch Real Time PCR Detection system (Bio-Rad) following the manufacturer’s instructions. Enhancer occupancy was calculated as percentage of input DNA using the ΔΔCt method. Primer sequences are listed in Supplementary Table 4.
Luciferase assay:
Cells were transfected at 70% confluence using Lipofectamine2000® Reagent (ThermoFischer Scientific), according to the manufacturer’s guidelines. In all transfections the pRL-TK Renilla reporter vector (Promega) was used as an internal control. Cells were lysed and Renilla and firefly luciferase activities were measured using the Dual-Luciferase® Reporter Assay System (Promega) and a Tecan Infinite M1000 microplate reader. Luciferase activities were normalized to Renilla internal control luminescence.
Xenografts:
All procedures were reviewed and approved by the Institutional Animal Use and Care Committee (IACUC) at University of California, San Diego. Tumor size must not exceed 20 mm at the largest diameter and this tumor threshold was never exceeded in any experiment. Five-six-week-old female athymic nu/nu mice were purchased from Harlan Sprague Dawley. Subcutaneous tumors were established by injection of 5X10⁵ parental or genetically engineered lung cancer H460 cells, and 3X10⁶ parental and 2.5X10⁶ genetically engineered Ovarian adenocarcinoma OV4 cells, implanted subcutaneously into the flanks of immune-compromised female mice. Genetically engineered OV4PH amp cells stably expressing DOX-inducible shRNA either against NAPRT (ishNAPRT), NADSYN1 (ishNADSYN1), NAMPT (ishNAMPT) or NMRK1 (ishNMRK1) were independently inoculated at the left flank, while H460Sal-dep cells stably expressing DOX-inducible shRNA either against NAPRT (ishNAPRT), NAMPT (ishNAMPT), NMRK1 (ishNMRK1) or both NAMPT (ishNAMPT) and NMRK1 (ishNMRK1) were independently inoculated at the right flank in individual mice. To test for the rescue of the knockdown phenotype, OV4PH amp or H460Sal-dep cells stably expressing DOX-inducible shRNA targeting the 3' UTR of the target genes, NAPRT (ishNAPRT), NAMPT (ishNAMPT), NMRK1 (ishNMRK1) or co-deletion of NAMPT+NMRK1 (ishNAMPT+NMRK1) were subcutaneously implanted at the left flank in individual mice. Same clone of stably engineered OV4PH amp or H460Sal-dep cells but with an expression of exogenous cDNA corresponding to the target not susceptible to silencing compared to the endogenous copy, (ishNAPRT(+naprt-FLAG)), (ishNAMPT(+nampt-FLAG)) or (ishNAMPT+NMRK1(+nmrk1-FLAG)) were subcutaneously implanted at the right flank in individual mice. ishNTC was used as a non-targeting control inducible shRNA for both the tumor types. Each cohort categorized for both tumor-types consisted of 8 mice. Post tumor cell implantation, mice were randomized and then allocated into cages. Mice were fed doxycycline(dox)-containing chow (200 mg kg−1, Bio-Serv), starting seven days after implantation until the end of the experiment. For FK-866 treatment, tumor bearing mice were intraperitoneally injected with FK-866 at 5 mg/kg−1 or 20 mg/kg−1 or PBS twice daily for 5 days/week for 3 weeks. For NADSYN1i treatment, tumor bearing mice were intraperitoneally injected with NADSYN1i at 10 mg/kg−1 or 30 mg/kg−1 or PBS once daily for 2 weeks. Tumor volume was monitored every three-five days over a 30-day period using electronic calipers. Tumor volumes were calculated by caliper measurements of the short (a) and long (b) tumor diameters (volume = a2 × b / 2) or of tumor height (h), short (a) and long (b) tumor width (volume = h × a × b / 2) depending on tumor shape (Mean tumor volume ± s.e.m). In vivo tumor models do not mimic human physiology considering the bioavailability of NAD precursors. In the mouse dox diet only Niacin (86.9 mg/kg) and TRP (2.5G/kg) are present while NA and NR availability is unique and only orally bioavailable. Therefore, to mimic human physiology and pathophysiology where there is a ubiquitous presence of all the NAD precursors, NM, NR, NA and TRP were orally provided in the drinking water ad libitum (200mg/kg/day) to nude mice bearing tumors
Immunohistochemistry and Tissue Ki67 staining:
Formalin-fixed, paraffin-embedded (FFPE) tissue sections were prepared by the Histology Core Facility at UCSD Moores Cancer Center. Immunohistochemistry was performed according to standard procedures. Antigen was retrieved by boiling slides in 0.01 M of sodium citrate (pH 6.0) in a microwave for 15 min. Sections were incubated with primary Ki67 antibody (Thermo Scientific, #PA5-16785) at 4°C overnight, followed by incubation with biotinylated secondary antibodies at room temperature for 30 min. Three representative images from each immunostained section were captured using DP 25 camera mounted on an Olympus BX43 microscope at 40x magnification. Quantitative analysis of the IHC images was performed using image analyzing software (Visiopharm).
Tissue TUNEL staining:
Cell death analysis was conducted in xenografts using the In Situ Cell Death Detection kit, Fluorescein (Sigma-Aldrich) according to the manufacturer’s protocol. In brief, paraffin embedded tissues were deparaffinized with xylene and rehydrated with ethanol, followed by treatment with proteinase K (5 μg ml−1, New England Biolabs). Sections were then incubated with reaction buffer for 1 h at 37°C in a humidified chamber with no access to light. DAPI was used to stain DNA. Images were acquired with an Olympus IX81 microscope. Three representative images from each section were captured using DP 25 camera mounted on an Olympus BX43 microscope at 40x magnification. Quantitative analysis of the images detecting TUNEL+ nuclei was performed using ImageJ software (NIH).
Statistics and Reproducibility:
Graphpad Prism software was used to conduct the statistical analysis of all data. No statistical methods were used to predetermine sample size. For xenograft experiments, female athymic nu/nu mice injected with tumor cells were randomized before being allocated to respective cages. All other experiments conducted for the study were not randomized, and the investigators were not blinded to either allocation during experiments or to outcome assessments. Experiments in Figs. 1A, 1B, 2A, 3D, 4C (structural analysis), Extended Data Figs. 1C, 1D, 1F-H and 5D were performed once; Experiments in Figs. 4A, 4B, 4D, 4E, Extended Data Figs. 1A, 2A-G, 4A, 4C, 5C, 6A-I, 7A-D, 8A (crystal violet staining), 8B, 9C, 9E, 9F, 9G, 9H and 10A, 10D, 10E were performed twice with similar observations. All other experiments were performed three times with similar observations. Variation in data in all experiments is presented as mean ± s.d. except for variation for xenograft tumor volume which is illustrated as the standard error of the mean. In Extended Data Figs. 1C, 1D, quantitative results were assessed by unpaired Student’s t-test after confirming that the data met appropriate assumptions. The Student’s t-test assumed two-tailed distributions to calculate statistical significance between groups. For comparisons among three or more groups, statistical significance was assessed using one-way ANOVA followed by Tukey’s multiple comparisons test. To examine significance in xenograft tumor growth between two or among three or more groups, statistical significance was assessed using two-way ANOVA, to calculate significance on repeated measurements over time followed by Tukey’s multiple comparisons test. As required for ANOVA, we first tested, if there was homogeneity of variation among the groups using the Brown–Forsythe test. In all xenograft assays, subcutaneous tumors were established in five-six-week-old female athymic nu/nu mice and randomized into different cohorts. Each categorized cohort for both tumor-types consisted of 8 mice.
Extended Data
Extended Data Fig. 1: Tissue lineage-dependent, PH-pathway gene amplification in Cancer.
a. Heatmap illustrating copy number (CN) alterations (z-score) for NAMPT; NAPRT and NADSYN1 across cancer cell types (n=54 cell-types). b. Representative FISH images of cells in metaphase from two independent experiments with similar observations displaying NAPRT and NADSYN1 gene amplification on Homogenously Staining Regions (HSRs) in PH-amplified (OV4PH amp and KYSE510PH amp) and non-PH amplified cancer cell lines (H460non-PH amp) as indicated. c. Violin plots of NAPRT (left) or NADSYN1 (right) mRNA expression against putative CN alterations from multiple tumor-types from CCLE (n=947 from biologically independent samples including shallow/deep deletion). d. Violin plots of NAPRT or NADSYN1 mRNA expression stratified by NAPRT and NADSYN1 CN alterations in multiple tumor-types from cBioportal (Ovarian adenocarcinoma: n=403; Esophageal carcinoma: n=150; Hepatocellular carcinoma: n=341; Metastatic Prostate adenocarcinoma: n=99; Breast carcinoma: n=311; Lung Squamous cell carcinoma: n=163; Head & Neck adenocarcinamoma: n=503, from biologically independent samples). e. Heatmap illustrating differential gene expression profiles of NAD biosynthesis enzymes in ‘PH-amp’ and ‘non-PH amp’ cancer cell types (z-score, n=54). Cancer cell-lines amplified for the PH-pathway enzymes (NAPRT or NADSYN1) are denoted as ‘PH amp’ marked in ‘red’, while cancer cell-lines that are not amplified for NAPRT or NADSYN1 are denoted as ‘non-PH amp’ marked in ‘blue’. f. Box and whisker plots showing normalized NAPRT transcript level (RPKM) in 19 distinct normal tissue of origin obtained from GTEx and TCGA portal (www.gtexportal.org) (www.portal.gdc.cancer.gov/repository). Centre line, median; box limits; whiskers, min to max, all points are plotted according to the Tukey method g. Bimodal distribution based on Dip Test of unimodality of two distributions stratified as ‘high’ and ‘low’ (n=2644 biologically independent samples). For tissues to be classified as having ‘high’ or ‘low’ expression of the gene critical point of distribution was chosen at 10 RPKM, at which the two distributions have identical density. h. Pearson correlation between NAPRT transcript expression (RPKM, z-score) in 19 normal tissues and NAPRT or NADSYN1 CN in 23 cancer types (n=2644 biologically independent samples). Statistical significance for violin plots display median, first and third quartiles, showing mRNA expression against putative CN alterations assessed using two-tailed unpaired Student’s t-test (c,d).
Extended Data Fig. 2: Non-cancer cells are not dependent on a single NAD biosynthetic pathway for survival.
a. Intracellular NAD+ level measurement in non-cancer cells upon treatment with increasing doses of NAMPT inhibitor FK-866 for 72 h. b. Representative images of non-cancer cells from one of the two independent experiments, treated with increasing doses of NAMPT inhibitor FK-866 for 72 h. Both biological replicates showed similar results. Images taken on 10X objective. c-f. Non-cancer cells transfected with siRNAs targeting NAMPT (siNAMPT); NMRK1 (siNMRK1) and NAPRT (siNAPRT) either individually or in combination. A non-targeting siNTC was used a negative control. c. Scattered data plots with bars representing (%) cell death assessed by trypan blue exclusion assay in non-cancer cells. d. Intracellular measurement of NAD+ levels in non-cancer cells. e. Representative images of non-cancer cells from one of the two independent experiments, transfected with siRNAs targeting NAMPT (siNAMPT); NMRK1 (siNMRK1) and NAPRT (siNAPRT) either individually or in combination. Both biological replicates showed similar results. Images taken on 10X objective. f. Immunoblotting for cleaved-caspase 3 as a measure of cell-death and to test for abundance of NAMPT, NMRK1 and NAPRT protein expression. Protein lysates from etoposide (Etop) treated H460 cancer cells was used as a control, when immunoblotting for cleaved-caspase 3. Actin was used as a loading control. Representative blots are from one of the two independent experiments. Both biological replicates showed similar results. g. Intracellular measurement of NAD+ levels in non-cancer cells supplemented with exogenous NAD+ (200 μM) or with the indicated precursors, NA; NM or NR at a concentration of 500 μM. Data are representative of five independent biological replicates, n=5 (a,c,d,g). Data are represented as mean ± s.d, analysed by one-way ANOVA with Tukey’s multiple comparisons test (a,c,d,g). For gel source data, see Supplementary Fig. 1.
Extended Data Fig. 3: Tissue context determines the NAD metabolic pathway dependence of cancer cells.
a. Schematic overview of 54 distinct established cancer models of 13 histological types analyzed in the study. b. Waterfall plot of cell death by Propidium Iodide staining (z-score). Both non-cancer and cancer cells (n=59 cell-types) were transfected with siRNAs targeting NADSYN1. Four different siRNAs were used to target NADSYN1 (siNADSYN1: red circle) and a non-targeting siNTC (clear circle) was used a negative control. c. Heatmap illustrating cell death measured by Propidium Iodide staining (z-score). Different cancer cell types (n=54 cell-types) were transfected with siRNAs. Four different siRNAs were used for each gene (siNAMPT; siNMRK1; siNMRK2; siNAPRT and siNADSYN1). Non-targeting siNTC was used a negative control. Figure 3c is a heatmap illustration of RNAi screen already shown in Figure 1c and Extended Data Figure 3b, but also contains siNMRK1 and siNMRK2 screen datasets to provide a complete perspective. d. Intracellular measurement of NAD+/NADH (left) and NAD+ (right) levels in non-cancer (n=5 cell-types) and cancer cell-lines (n=21 cell-types). e. Intracellular measurement of NAD+/NADH (left) and NAD+ (right) levels in non-cancer (n=5 cell-types), PH amp or non-PH amp cancer cell-lines (n=21 cell-types). Cancer cell-lines amplified for the PH-pathway enzymes (NAPRT or NADSYN1) are denoted as ‘PH amp’ marked in ‘red’, while cancer cell-lines not amplified for NAPRT or NADSYN1 are denoted as ‘non-PH amp’ marked in ‘blue’. Box and whisker plots showing intracellular measurement of NAD+/NADH and NAD+ levels display center line, median; box limits; whiskers, min to max, all points. Data are representative of independent biological replicates. Statistical significance for was assessed using one-way ANOVA with Tukey’s multiple comparisons test (b), while for (d) and (e)a two-tailed unpaired Student’s t-test was used.
Extended Data Fig. 4: Genetic depletion of genes encoding key enzymes of NAD biosynthesis pathways combined with metabolic addbacks identify mechanistic basis of NAD pathway addiction.
Cancer cell-lines (n=8 cell-types) amplified for the PH-pathway enzymes (NAPRT or NADSYN1) denoted as ‘pH amp’ marked in ‘red’ or not amplified for NAPRT or NADSYN1 denoted as ‘non-PH amp’ marked in ‘blue’ were transduced independently with the indicated DOX-inducible ishRNAs, including, non-targeting control (ishNTC); NAPRT (ishNAPRT) or NAMPT (ishNAMPT), followed up with DOX treatment post puromycin selection. Non-cancer cell-lines (n=3 cell-types) marked in ‘black’ used as controls were also transduced with the indicated DOX-inducible ishRNAs. During this time, cells were supplemented with fresh growth media and exogenous NAD+ (200 μM) or with the indicated precursors, NA; NaMN; NM; NMN; NR; TRP or QA at a concentration of 500 μM every 2-3 days. a. Representative images of colony formation assay using Crystal violet staining from one of the two independent experiments. Both biological replicates showed similar results. Cells stably expressing different ishRNAs were stained with crystal violet after 15-18 days post transduction and selection. b. Heatmap illustrating absolute colony formation units. c. Immunoblotting for cleaved-caspase 3 as a measure of cell-death and to test for protein abundance for NAPRT and NAMPT in ‘PH amp’ (left) and ‘non-PH amp’ (right) cancer cells transduced with respective ishRNAs. Actin was used as a loading control. Representative blots from one of the two independent experiments. Both biological replicates showed similar results. For gel source data, see Supplementary Fig. 1.
Extended Data Fig. 5: NAMPT enhancer drives NAD Salvage-pathway addiction in cancer.
a. Luciferase enhancer-reporter assay of the putative downstream enhancer. To test the effect of a predicted enhancer, cis regulatory region of the NAMPT locus was cloned into pGL3 reporter constructs in the direction indicated. Enhancer activity of the 4.641 kb cis regulatory region corresponding to the H3k27ac/DHS peak was tested using luciferase reporter assay, when present both upstream and downstream of the luciferase gene in a construct containing the NAMPT promoter. The pGL3 reporter plasmid containing the NAMPT promoter but without the enhancer region is used as a negative control (pGL3). Luciferase reporter assay measuring the enhancer activity (NAMPT-Enh) was tested in Salvage-dependent, U87Sal-dep and HCT116Sal-dep cancer cells. Relative luciferase units are normalized to Renilla luciferase. b. NAMPT transcript levels (left) as measured by quantitative PCR and Intracellular measurement of NAD+ levels (right) in cells transduced with the KRAB-dCAS9 genetic repression system (Top left-right: U87Sal-dep and HCT116Sal-dep; bottom left-right: OV4PH amp, KYSE510PH amp and OE21PH amp). c. Immunoblotting for cleaved caspase-3 abundance (top, H460Sal-dep, U87Sal-depand HCT116Sal-dep; bottom, OV4PH amp and KYSE510PH amp), in cells transduced with the KRAB-dCAS9 genetic repression system. Representative blots are from one of the two independent experiments. Both biological replicates showed similar results. Actin was used as loading control. When quantifying NAD+ measurement and cleaved caspase-3 abundance in H460Sal-dep, U87Sal-dep and HCT116Sal-dep, cells were treated with exogenous NAD+ (200 μM) to test for the rescue of the phenotype. Please refer to the schematic overview (Fig 3a) for the design of KRAB-dCas9 mediated repression of the NAMPT-enhancer embedded within the ‘B’ sub-region. Five different guide RNAs were individually fused to dCAS9 expressing construct (‘NC’, ‘g1’ to ‘g4’). ‘Empty’: no sgRNA; ‘NC’: sgRNA that is predicted to not recognize any genomic regions; ‘g1’: sgRNA recognizing Chr7 genomic loci >20kb away from the NAMPT ‘B’ enhancer region; ‘g2’: sgRNA recognizing 4.641 kb long cis regulatory region; ‘g3’ and ‘g4’: sgRNAs recognizing NAMPT ‘B’ enhancer region. d. Genome browser screenshot illustrating TF (transcription factor)-ChIP-seq epigenome profiles across multiple ‘Sal-dep’ cancer cells (HeLa, A549, K562 and SK-N-SH). The peach shaded region embedding the TF-ChIP-seq peaks indicate putative TF recruitment sites that overlap NAMPT ‘B’ enhancer region (marked by a red square box at the bottom of the clustering, hg19 Chr7: 105,856,541-105,858,299). The grey shaded region corresponds to the NAMPT promoter (hg19_dna chr7:105,925,229-105,926,250). e. Transcript levels of MYC, MAX, STAT3, FOXM1 and GATA3 transcription factors (TFs) in H460Sal-dep cancer cells upon siRNA mediated depletion of the respective TFs. Non-targeting siNTC was used a negative control. Scatter data plots with bars are representative of five (a,b, n = 5) and three (b-bottom-right, e, n = 3) independent biological replicates. Data are represented as mean ± s.d, analysed by one-way (a,b) or two-way ANOVA (e) with Tukey’s multiple comparisons test. For gel source data, see Supplementary Fig. 1.
Extended Data Fig. 6: In vivo demonstration of NAD metabolic pathway dependencies.
a. Schematic diagram of experiment - OV4PH amp cells (Ovarian adenocarcinoma) stably expressing DOX-inducible shRNA either against NAPRT (ishNAPRT), NADSYN1 (ishNADSYN1), NAMPT (ishNAMPT) or NMRK1 (ishNMRK1) were inoculated into the left flank of nude mice. H460Sal-dep NSCLC cells stably expressing DOX-inducible shRNA either against NAPRT (ishNAPRT), NAMPT (ishNAMPT), NMRK1 (ishNMRK1) or both NAMPT (ishNAMPT) and NMRK1 (ishNMRK1) were inoculated into the right of the same nude mice. ishNTC was used as a non-targeting control inducible shRNA for both the tumor types. b. Tumor volume (left) and Intratumoral NAD+ measurement (right) of nude mice bearing OV4PH amp stably expressing DOX-inducible shRNA against NMRK1 (ishNMRK1) taken at the end of experiment on Day 30. Tumor volume was monitored over a 30-day period. DOX treatment was initiated on day 7 post implantation until the end of the experiment. c, e and g. Representative images illustrating TUNEL+ nuclei and Ki67+ cells from one of the two independent experiments. Both biological replicates showed similar results. d, f and h. Quantification for TUNEL+ nuclei and Ki67+ cells in tumor tissues from respective tumor types. DAPI was used to stain DNA for TUNEL staining. When measuring TUNEL+ nuclei, 10000-12000 cells were counted for each cohort, whereas for Ki67+ cells, 15000-20000 cells were counted for each cohort. I. Immunoblotting for cleaved-caspase 3 as a measure of cell-death and to test for protein abundance for NAMPT, NAPRT, NMRK1 and NADSYN1 in tumor tissues obtained from the indicated tumor types. Representative blots are from one of the two independent experiments. Both biological replicates showed similar results. Actin was used as a loading control. Data are representative of eight (b-left,d,f,h, n=8) and five (b-right, n=5) independent biological replicates. Mean tumor volume ± s.e.m is shown (n=8 tumors/cohort) with statistical significance assessed using two-way ANOVA to calculate significance on repeated measurements over time (b-left). Data as scatter plots with bars are represented as mean ± s.d, analysed by one-way ANOVA with Tukey’s multiple comparisons test (d,f,h). For gel source data, see Supplementary Fig. 1 ns, not significant.
Extended Data Fig. 7: In vivo genetic depletion of genes encoding key enzymes of NAD biosynthesis pathways combined with genetic rescue identify mechanistic basis of NAD pathway addiction.
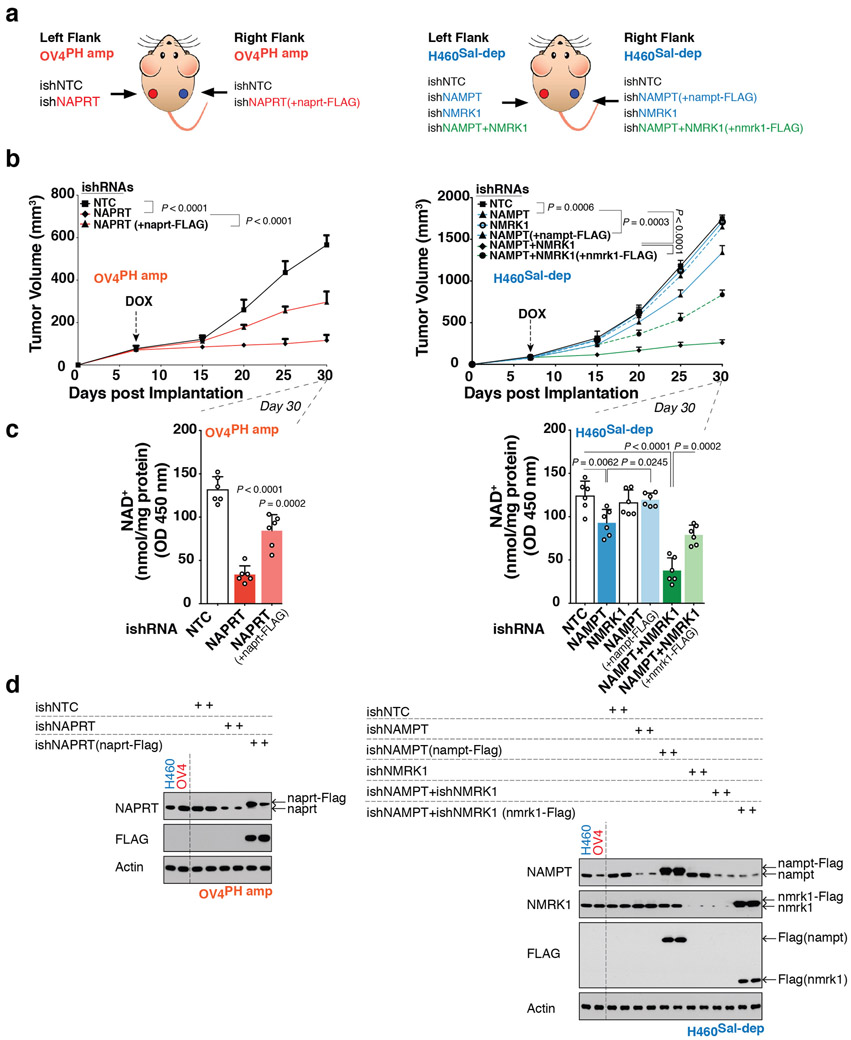
a. Schematic diagram of experiment - OV4PH amp or H460Sal-dep cells stably expressing DOX-inducible shRNA targeting the 3' UTR of the target genes, NAPRT (ishNAPRT), NAMPT (ishNAMPT), NMRK1 (ishNMRK1) or co-deletion of NAMPT+NMRK1 (ishNAMPT+NMRK1) were inoculated into the left flank of individual nude mice as indicated. Same clone of stably engineered OV4PH amp or H460Sal-dep cells but with an expression of exogenous cDNA corresponding to the target not susceptible to silencing compared to the endogenous copy, (ishNAPRT(+naprt-FLAG)), (ishNAMPT(+nampt- FLAG)) or (ishNAMPT+NMRK1(+nmrk1-FLAG)) were inoculated into the right flank of individual mice as indicated. ishNTC was used as a non-targeting control inducible shRNA for both the tumor types. b. Tumor volume from different tumor types as indicated. Tumor volume was monitored over a 30-day period. DOX treatment was initiated on day 7 post implantation until the end of the experiment. c. Intratumoral NAD+ measurement of nude mice bearing tumors taken at the end of experiment on Day 30 for the indicated tumor types. d. Immunoblotting for NAPRT, NAMPT, NMRK1 and FLAG in tumor tissues obtained from the indicated tumor types to check for protein abundance. Representative blots are from one of the two independent experiments. Both biological replicates showed similar results. Actin was used as a loading control. Data are representative of eight (b, n=8) and six (c, n=6) independent biological replicates. Mean tumor volume ± s.e.m is shown (n=8 tumors/cohort) with statistical significance assessed using two-way ANOVA to calculate significance on repeated measurements over time (b). Data as scatter plots with bars are represented as mean ± s.d, analysed by one-way ANOVA with Tukey’s multiple comparisons test (c). For gel source data, see Supplementary Fig. 1.
Extended Data Fig. 8: NAMPT deficiency leads to enzymatic bypass of the Salvage-pathway successfully reprogramming NAD biosynthesis in Cancer.
Genetically engineered Salvage-dependent cancer cells including, H460Sal-dep, HCT116Sal-dep and U87Sal-dep were transduced with stable a silencing system targeted against NAMPT using shRNA followed up with puromycin selection. Two different shRNAs were tested against NAMPT. A non-targeting shNTC was used a control. a. Intracellular NAD+ measurement (top). Representative images of clonogenic survival assay using Crystal violet staining (middle) from one of the two independent experiments. Both biological replicates showed similar results. Quantification of colony formation units (bottom). For ‘short-term depl’ cells were seeded 7-10 days post transduction/selection for clonogenic survival assay, while for ‘long-term depl’, cells were seeded ≥30 days post transduction/selection. Cells were stained with crystal violet after 15-18 days of seeding. Salvage-dependent cancer cells stably silenced for NAMPT grown for an extended duration of time (long-term depl), were later silenced for NMRK1 using shRNA. b. Immunoblotting for cleaved-caspase 3 as a measure of cell-death and to test for protein abundance for NAMPT, NMRK1 and NAPRT. Representative blots are from one of the two independent experiments. Both biological replicates showed similar results. Actin was used as a loading control. Salvage-dependent cancer cells stably silenced for NAMPT and grown for an extended duration of time (long-term depl), were later silenced for NMRK1 using siRNA. For ‘short-term depl’ cells were harvested for protein extraction 7-10 days post transduction/selection, while for ‘long-term depl’, cells were harvested for protein extraction ≥30 days post transduction/selection (including transient transfection using siRNA) and later immunoblotted. c. Relative NMRK1, d. Relative NAMPT, NMRK2 or NAPRT transcript levels as measured by quantitative PCR. For ‘short-term depl’, cells were harvested for RNA extraction 7-10 days post transduction/selection, while for ‘long-term depl’ cells were harvested for RNA ≥30 days post transduction/selection. Salvage-dependent cancer cells stably silenced for NAMPT and grown for an extended duration of time (long-term depl), were later silenced for NMRK1 using shRNA. e. Schematic overview of the model illustrating NAD pathway addiction in cancer is driven through two separate mechanisms, one that gets shaped by gene amplification (left) while the other through epigenetic reprogramming (right). The model demonstrates tissue context-based amplifications of genes encoding key enzymes (NAPRT/NADSYN1) of the PH-pathway and subsequent tumor cell dependence that is absolute and not subjected to enzymatic bypass rewiring. In contrast, epigenetically-determined dependence on the NAMPT driven Salvage-pathway is subject to enzymatic bypass, requiring combination therapies. Data are representative of five (a-top,c, n=5), three (d, n=3) and two (a-middle, a-bottom, n=2) independent biological replicates. Data as scatter plots with bars are represented as mean ± s.d, analysed by one-way ANOVA with Tukey’s multiple comparisons test (a,c,d). For gel source data, see Supplementary Fig. 1.
Extended Data Fig. 9: Genetic depletion of NMRK1 in non-PH amplified tumor cells enhances sensitivity to FK-866 inducing tumor cell death.
a. Heatmap illustrating cell death measured by Propidium Iodide staining (z-score). Cancer cells were treated with increasing doses of NAMPT inhibitor, FK-866 for 72 h. Cancer cells amplified for the PH-pathway enzymes (NAPRT or NADSYN1) are denoted as ‘PH amp’ marked in ‘red’, while cancer cells not amplified for NAPRT or NADSYN1 are denoted as ‘Sal-dep’ marked in ‘blue’. b. Intracellular NAD+ level measurement, and c. Immunoblotting for cleaved-caspase 3, in ‘Sal-dep’ cancer cells treated with 10nM FK-866 for 72 h. To rescue depleted (b) intracellular NAD+ pools and (c) apoptosis as measured by cleaved-caspase 3 abundance, cells were supplemented with exogenous NAD+ (200 μM) or with the indicated precursors, NM; NMN; NR or NA at a dose of 500 μM. d. Cell viability of non-cancer and cancer cells (PH amp and Sal-dep) stably silenced using shRNA against NMRK1 (shNMRK1) as the target gene, treated with increasing doses of FK-866 for 72 h. shNTC was used as a non-targeting control shRNA. e. Schematic diagram of experiment - OV4PH amp (top) and H460Sal-dep (bottom) cells stably expressing shRNA against the target gene NMRK1 (shNMRK1), implanted subcutaneously. shNTC was used as a non-targeting shRNA control for both the tumor types, f. Tumor volume of nude mice bearing stably engineered OV4PH amp cells implanted subcutaneously. Tumor volume was monitored over a 24-day period. Mice were IP injected with FK-866 twice daily, g. Intratumoral NAD+ measurement of nude mice bearing stably engineered OV4PH amp tumors, taken at the end of experiment on Day 24. h. Immunoblotting for cleaved-caspase 3 as a measure of cell-death and to test for protein abundance for NMRK1 in tumor tissues obtained from the indicated tumor types. Representative blots are from one of the two independent experiments. Both biological replicates showed similar results. Actin was used as a loading control (c,h). Data are representative of three (b,d, n=3), eight (f, n=8) and six (g, n=6) independent biological replicates. Data as scatter plots with bars are represented as mean ± s.d, analysed by one-way ANOVA with Tukey’s multiple comparisons test (b,g). Statistical significance for cell-viability data was assessed using two-tailed unpaired Student’s t-test (d). Mean tumor volume ± s.e.m is shown (n=8 tumors/cohort) with statistical significance assessed using two-way ANOVA to calculate significance on repeated measurements over time (f). For gel source data, see Supplementary Fig. 1. ns, not significant.
Extended Data Fig. 10: Overexpression of rate-limiting NAD biosynthesis enzymes is not sufficient to generate or reverse metabolic addiction.
a. Immunoblotting for cleaved-caspase 3 as a measure of cell-death and to test for abundance of NAMPT and NAPRT protein expression in non-cancer cells (IMR90, RPE-1) stably over-expressing NAMPT or NAPRT. Protein lysates from etoposide (Etop) treated H460 cancer cells was used as a control, b. Scattered plots with bars represent (%) cell death assessed by trypan blue exclusion assay, c. Intracellular measurement of NAD+ levels. d,e. Immunoblotting for cleaved-caspase 3 as a measure of cell-death and to test for abundance of NAPRT (d, top, in H460non-PH amp) and NAMPT (e, bottom, in OV4PH amp) protein expression. Protein lysates from etoposide (Etop) treated H460 or OV4 cancer cells was used as a control, f. Scattered plots with bars represent (%) cell death assessed by trypan blue exclusion assay, g. Intracellular measurement of NAD+ levels, upon stable over-expression of NAPRT or NAMPT in H460 or in OV4 cancer cells as indicated. Stably engineered non-cancer and cancer cells (10a-g) post selection were treated with FK-866 (10nM) or NADSYNUi (2μM) as indicated for 72 h. Representative blots are from one of the two independent experiments. Both biological replicates showed similar results. Actin was used as a loading control (a,d,e). Data are representative of five (b,f, n=5) and three (c,g, n=3) independent biological replicates. Data as scatter plots with bars are represented as mean ± s.d, analysed by two-way ANOVA with Tukey’s multiple comparisons test (b,c,f,g). For gel source data, see Supplementary Fig. 1. ns, not significant.
Supplementary Material
Acknowledgments:
We thank Dr. Mathew Meyerson (Broad Institute) for CRISPRi plasmids. Mischel laboratory members and Dr Andrew Shiau made helpful suggestions. Amini Hwang generated Extended Figure 3A diagram. Supported by Ludwig Institute for Cancer Research (P.S.M., B.R., F.B.F.), Defeat GBM program of the National Brain Tumor Society (P.S.M., F.B.F.), NVIDIA Foundation, (P.S.M.), the Ben and Catherine Ivy foundation (P.S.M.), the Ziering Family Foundation in memory of Sigi Ziering (P.S.M.) and NIH grants T32 CA009253 (R.R.), CA121938 (E.B.), NS73831 (P.S.M.), GM114362 (V.B.), NS80939 (F.B.F.), and NSF grants: NSF-IIS-1318386 and NSF-DB1-1458557 (V.B.).
Footnotes
Competing Interests:
P.S.M. and V.B. are co-founders of Pretzel Therapeutics, Inc., have equity in the company and serve as consultants.
Data availability statement (DAS)
The data supporting the findings of this study are available within the paper and its Supplementary Information. Source Data for Figs. 1-4 and Extended Data Figs. 1-10 are available with the online version of the paper. Data are available from the corresponding author upon reasonable request.
References:
- 1.Roychowdhury S and Chinnaiyan AM. Translating genomics for precision cancer medicine. Annu Rev Genomics Hum Genet. 15: 395–415. 2014. [DOI] [PubMed] [Google Scholar]
- 2.Mayers JR and Vander Heiden MG. Nature and Nurture: What Determines Tumor Metabolic Phenotypes. Cancer Res. 77(12): 3131–4. 2017. [DOI] [PubMed] [Google Scholar]
- 3.Canto C et al. NAD(+) Metabolism and the Control of Energy Homeostasis: A Balancing Act between Mitochondria and the Nucleus. Cell Metabolism. 22(1):31–53. 2015 [DOI] [PMC free article] [PubMed] [Google Scholar]
- 4.Verdin E NAD+ in aging, metabolism, and neurodegeneration. Science. 350(6265):1208–1213. 2015. [DOI] [PubMed] [Google Scholar]
- 5.Vander Heiden MG and DeBerardinis RJ. Understanding the Intersections between Metabolism and Cancer Biology. Cell. 168(4): 657–669. 2017. [DOI] [PMC free article] [PubMed] [Google Scholar]
- 6.Pavlova and Thompson. The Emerging Hallmarks of Cancer Metabolism. Cell Metabolism. 23(1):27–47. 2016. [DOI] [PMC free article] [PubMed] [Google Scholar]
- 7.Liu et al. Quantitative Analysis of NAD Synthesis-Breakdown Fluxes. Cell Metabolism. 27(5):1067–1080. 2018. [DOI] [PMC free article] [PubMed] [Google Scholar]
- 8.Chiarugi et al. The NAD metabolome-a key determinant of cancer cell biology. Nat Rev Can. 12(11):741–52. 2012. [DOI] [PubMed] [Google Scholar]
- 9.Ryu et al. Metabolic regulation of transcription through compartmentalized NAD+ biosynthesis. Science. 360(6389). 2018 [DOI] [PMC free article] [PubMed] [Google Scholar]
- 10.Kaelin and McKnight. Influence of metabolism on epigenetics and disease. Cell. 153(1):56–69. 2013. [DOI] [PMC free article] [PubMed] [Google Scholar]
- 11.Bogan KL and Brenner C. Nicotinic acid, nicotinamide, and nicotinamide riboside: a molecular evaluation of NAD+ precursor vitamins in human nutrition. Annu Rev Nutr. 28:115–30. 2008. [DOI] [PubMed] [Google Scholar]
- 12.Katsyuba E et al. De novo NAD+ synthesis enhances mitochondrial function and improves health. Nature. [Epub ahead of print]. 2018. [DOI] [PMC free article] [PubMed] [Google Scholar]
- 13.Tateishi K et al. Extreme Vulnerability of IDH1 Mutant Cancers to NAD+ Depletion. Cancer Cell. 28(6):773–784. 2015. [DOI] [PMC free article] [PubMed] [Google Scholar]
- 14.Piacente F et al. Nicotinic Acid Phosphoribosyltransferase Regulates Cancer Cell Metabolism, Susceptibility to NAMPT Inhibitors, and DNA Repair. Cancer Res. 77(14):3857–3869. 2017. [DOI] [PubMed] [Google Scholar]
- 15.Hnisz D et al. Super-enhancers in the control of cell identity and disease. Cell. 155(4):934–47. 2013. [DOI] [PMC free article] [PubMed] [Google Scholar]
- 16.Leung D et al. Integrative analysis of haplotype-resolved epigenomes across human tissues. Nature. 518(7539):350–354. 2015. [DOI] [PMC free article] [PubMed] [Google Scholar]
- 17.Gilbert LA. et al. CRISPR-Mediated Modular RNA-Guided Regulation of Transcription in Eukaryotes. Cell. 154 (2): 442–451. 2013. [DOI] [PMC free article] [PubMed] [Google Scholar]
- 18.Frederick DW. et al. Loss of NAD Homeostasis Leads to Progressive and Reversible Degeneration of Skeletal Muscle. Cell Metabolism. 24: 269–282. 2016. [DOI] [PMC free article] [PubMed] [Google Scholar]
- 19.Moro W et al. Virtual screening to identify lead inhibitors for bacterial NAD synthetase (NADs). Bioorg Med Chem Lett. 19(7):2001–5. 2009. [DOI] [PMC free article] [PubMed] [Google Scholar]
- 20.Devedjiev Y et al. Stabilization of active-site loops in NH3-dependent NAD+ synthetase from Bacillus subtilis. Acta Crystallogr D Biol Crystallogr. 57:806–812. 2001. [DOI] [PubMed] [Google Scholar]
- 21.Hara N et al. Molecular Identification of Human Glutamine- and Ammonia-dependent NAD Synthetases. JBC. 278(13):10914–109231. 2003. [DOI] [PubMed] [Google Scholar]
- 22.Velu SE. et al. Tethered Dimer Inhibitors of NAD Synthetase: Parallel Synthesis of an Aryl-Substituted SAR Library. J. Comb. Chem 7(6): 898–904. 2005. [DOI] [PubMed] [Google Scholar]
- 23.Wang X et al. Design, synthesis, and evaluation of substituted nicotinamide adenine dinucleotide (NAD+) synthetase inhibitors as potential antitubercular agents. Bioorg Med Chem Lett. 27(18):4426–4430. 2017. [DOI] [PMC free article] [PubMed] [Google Scholar]
Supplementary References
- 24.Heintzman ND. et al. Distinct and predictive chromatin signatures of transcriptional promoters and enhancers in the human genome. Nat Genet. 39: 311–318. 2007. [DOI] [PubMed] [Google Scholar]
- 25.Cerami E et al. The cBio Cancer Genomics Portal: An Open Platform for Exploring Multidimensional Cancer Genomics Data. Cancer Discovery. 2 (5):_401–404. 2012. [DOI] [PMC free article] [PubMed] [Google Scholar]
- 26.Lonsdale J et al. The Genotype-Tissue Expression (GTEx) project. Nature Genetics 45:580–585. 2013. [DOI] [PMC free article] [PubMed] [Google Scholar]
- 27.Grossman RL. Toward a Shared Vision for Cancer Genomic Data. New England Journal of Medicine. 375(12):1109–1112. 2016. [DOI] [PMC free article] [PubMed] [Google Scholar]
- 28.Hartigan JA; Hartigan PM The Dip Test of Unimodality. Ann. Statist. 13 (1):70–84. 1985. [Google Scholar]
- 29.Max Hasmann and Isabel Schemainda. FK866, a Highly Specific Noncompetitive Inhibitor of Nicotinamide Phosphoribosyltransferase, Represents a Novel Mechanism for Induction of Tumor Cell Apoptosis. 63 (21): 7436–7442. 2003. [PubMed] [Google Scholar]
- 30.Turner KM. et al. Extrachromosomal oncogene amplification drives tumour evolution and genetic heterogeneity. Nature. 543(7643):122–125. 2017. [DOI] [PMC free article] [PubMed] [Google Scholar]
- 31.Wojcik M et al. Glutamine-dependent NAD+ Synthetase how a two-domain, three-substrate enzyme avoids waste. JBC. 281(44):33395–33402. 2006. [DOI] [PubMed] [Google Scholar]
- 32.Zalkin H NAD synthetase. Methods in Enzymology. 113:297–302. 1985. [DOI] [PubMed] [Google Scholar]
- 33.Zhang X et al. Identification of focally amplified lineage-specific super-enhancers in human epithelial cancers. Nat Genet. 48(2):176–182. 2016. [DOI] [PMC free article] [PubMed] [Google Scholar]
Associated Data
This section collects any data citations, data availability statements, or supplementary materials included in this article.


