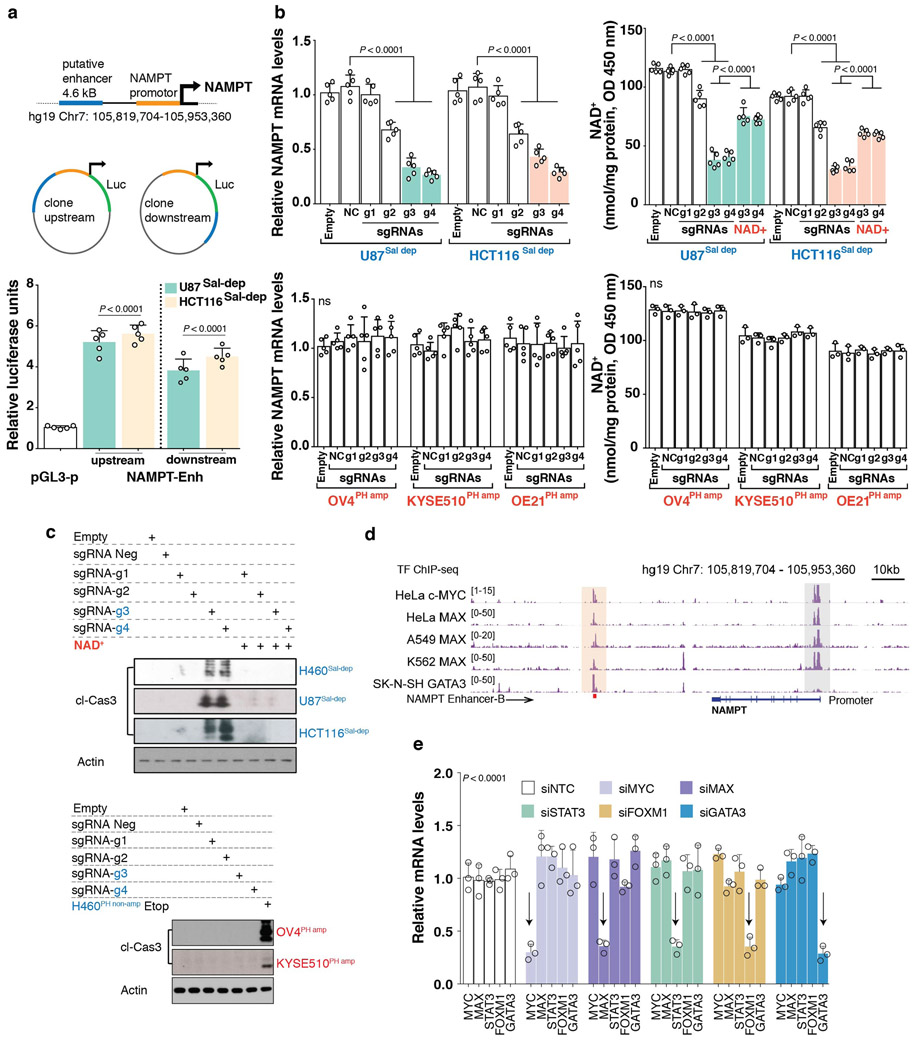
Extended Data Fig. 5: NAMPT enhancer drives NAD Salvage-pathway addiction in cancer.
a. Luciferase enhancer-reporter assay of the putative downstream enhancer. To test the effect of a predicted enhancer, cis regulatory region of the NAMPT locus was cloned into pGL3 reporter constructs in the direction indicated. Enhancer activity of the 4.641 kb cis regulatory region corresponding to the H3k27ac/DHS peak was tested using luciferase reporter assay, when present both upstream and downstream of the luciferase gene in a construct containing the NAMPT promoter. The pGL3 reporter plasmid containing the NAMPT promoter but without the enhancer region is used as a negative control (pGL3). Luciferase reporter assay measuring the enhancer activity (NAMPT-Enh) was tested in Salvage-dependent, U87Sal-dep and HCT116Sal-dep cancer cells. Relative luciferase units are normalized to Renilla luciferase. b. NAMPT transcript levels (left) as measured by quantitative PCR and Intracellular measurement of NAD+ levels (right) in cells transduced with the KRAB-dCAS9 genetic repression system (Top left-right: U87Sal-dep and HCT116Sal-dep; bottom left-right: OV4PH amp, KYSE510PH amp and OE21PH amp). c. Immunoblotting for cleaved caspase-3 abundance (top, H460Sal-dep, U87Sal-depand HCT116Sal-dep; bottom, OV4PH amp and KYSE510PH amp), in cells transduced with the KRAB-dCAS9 genetic repression system. Representative blots are from one of the two independent experiments. Both biological replicates showed similar results. Actin was used as loading control. When quantifying NAD+ measurement and cleaved caspase-3 abundance in H460Sal-dep, U87Sal-dep and HCT116Sal-dep, cells were treated with exogenous NAD+ (200 μM) to test for the rescue of the phenotype. Please refer to the schematic overview (Fig 3a) for the design of KRAB-dCas9 mediated repression of the NAMPT-enhancer embedded within the ‘B’ sub-region. Five different guide RNAs were individually fused to dCAS9 expressing construct (‘NC’, ‘g1’ to ‘g4’). ‘Empty’: no sgRNA; ‘NC’: sgRNA that is predicted to not recognize any genomic regions; ‘g1’: sgRNA recognizing Chr7 genomic loci >20kb away from the NAMPT ‘B’ enhancer region; ‘g2’: sgRNA recognizing 4.641 kb long cis regulatory region; ‘g3’ and ‘g4’: sgRNAs recognizing NAMPT ‘B’ enhancer region. d. Genome browser screenshot illustrating TF (transcription factor)-ChIP-seq epigenome profiles across multiple ‘Sal-dep’ cancer cells (HeLa, A549, K562 and SK-N-SH). The peach shaded region embedding the TF-ChIP-seq peaks indicate putative TF recruitment sites that overlap NAMPT ‘B’ enhancer region (marked by a red square box at the bottom of the clustering, hg19 Chr7: 105,856,541-105,858,299). The grey shaded region corresponds to the NAMPT promoter (hg19_dna chr7:105,925,229-105,926,250). e. Transcript levels of MYC, MAX, STAT3, FOXM1 and GATA3 transcription factors (TFs) in H460Sal-dep cancer cells upon siRNA mediated depletion of the respective TFs. Non-targeting siNTC was used a negative control. Scatter data plots with bars are representative of five (a,b, n = 5) and three (b-bottom-right, e, n = 3) independent biological replicates. Data are represented as mean ± s.d, analysed by one-way (a,b) or two-way ANOVA (e) with Tukey’s multiple comparisons test. For gel source data, see Supplementary Fig. 1.

