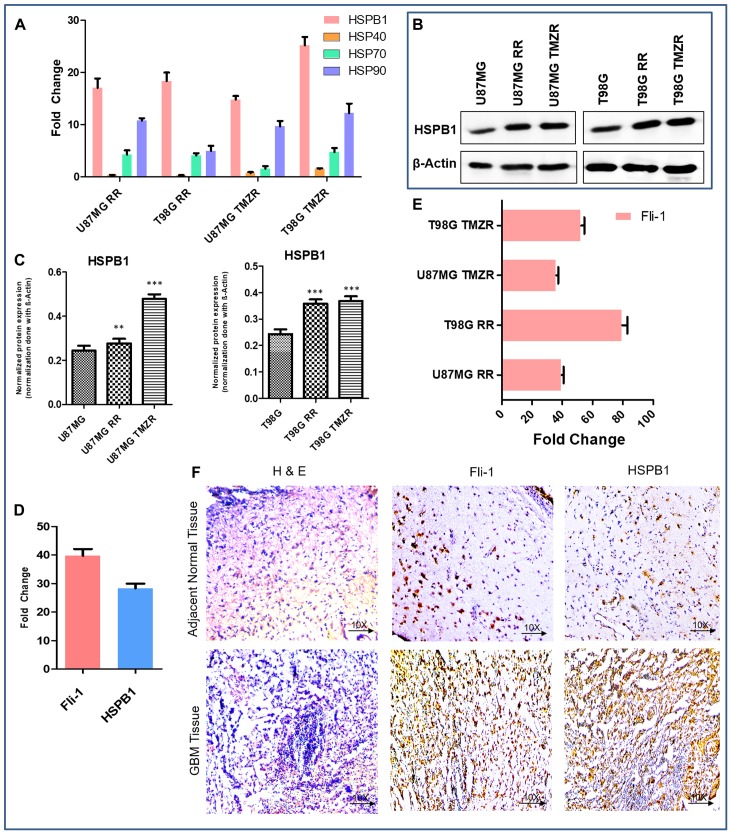
Figure 3. Comparative expression pattern of different HSPs and Fli-1 in GBM.
(A) Relative expression of different HSPs involved in radiation-resistance and TMZ-resistance (RR/TMZR) in GBM cells. Normalization of data is performed with 18S rRNA. (B) Western blotting analysis of HSPB1 in U87MG, U87MG-RR, U87MG-TMZR and T98G, T98G-RR, T98G-TMZR cells. During contrast adjustments of certain blots in panel b, background removal occurred. (C) Densitometry plot of (B). Each bar represents the average of three independent experiments. The level of significance is indicated by * P < 0.05, ** P < 0.01, *** P < 0.001. (D) Relative expression of Fli-1 and HSPB1 in GBM tissue samples presented as fold-change vs. normal adjacent tissue. (E) Relative expression of Fli-1 involved in radiation-resistant and TMZ resistant (RR/TMZR) GBM cells. (F) Immunohistochemistry of human adjacent normal and GBM tissue sections. Hematoxylin and Eosin staining and expression of Fli-1 and HSPB1.

