

ABSTRACT
Macroautophagy/autophagy deficit induces intracellular MAPT/tau accumulation, the hallmark pathology in Alzheimer disease (AD) and other tauopathies; however, the reverse role of MAPT accumulation in autophagy and neurodegeneration is not clear. Here, we found that overexpression of human wild-type full-length MAPT, which models MAPT pathologies as seen in sporadic AD patients, induced autophagy deficits via repression of autophagosome-lysosome fusion leading to significantly increased LC3 (microtubule-associated protein 1 light chain 3)-II and SQSTM1/p62 (sequestosome 1) protein levels with autophagosome accumulation. At the molecular level, intracellular MAPT aggregation inhibited expression of IST1 (IST1 factor associated with ESCRT-III), a positive modulator for the formation of ESCRT (the Endosomal Sorting Complex Required for Transport) complex that is required for autophagosome-lysosome fusion. Upregulating IST1 in human MAPT transgenic mice attenuated autophagy deficit with reduced MAPT aggregation and ameliorated synaptic plasticity and cognitive functions, while downregulating IST1 per se induced autophagy deficit with impaired synapse and cognitive function in naïve mice. IST1 can facilitate association of CHMP2B (charged multivesicular body protein 2B) and CHMP4B/SNF7-2 to form ESCRT-III complex, while lack of IST1 impeded the complex formation. Finally, we demonstrate that MAPT accumulation suppresses IST1 transcription with the mechanisms involving the ANP32A-regulated mask of histone acetylation. Our findings suggest that the AD-like MAPT accumulation can repress autophagosome-lysosome fusion by deregulating ANP32A-INHAT-IST1-ESCRT-III pathway, which also reveals a vicious cycle of MAPT accumulation and autophagy deficit in the chronic course of AD neurodegeneration.Abbreviations: AAV: adeno-associated virus; Aβ: β-amyloid; aCSF: artificial cerebrospinal fluid; AD: Alzheimer disease; ANP32A: acidic nuclear phosphoprotein 32 family member A; ATG: autophagy related; AVs: autophagic vacuoles; CEBPB: CCAAT enhancer binding protein beta; CHMP: charged multivesicular body protein; DMEM: Dulbecco’s modified eagle’s medium; EBSS: Earle’s balanced salt solution; EGFR: epidermal growth factor receptor; ESCRT: endosomal sorting complex required for transport; fEPSPs: field excitatory postsynaptic potentials; GAPDH: glyceraldehyde-3-phosphate dehydrogenase; GSK3B: glycogen synthase kinase 3 beta; HAT: histone acetyl transferase; HDAC: histone deacetylase; INHAT: inhibitor of histone acetyl transferase; IST1: IST1 factor associated with ESCRT-III; LAMP2: lysosomal associated membrane protein 2; LTP: long-term potentiation; MAP1LC3: microtubule associated protein 1 light chain 3; MAPT/tau: microtubule associated protein tau; MVB: multivesicular bodies; MWM: Morris water maze; PBS: phosphate-buffered saline solution; RAB7: member RAS oncogene family; SNAREs: soluble N-ethylmaleimide-sensitive factor attachment protein receptors; SQSTM1/p62: sequestosome 1
KEYWORDS: Alzheimer disease, autophagy, ESCRT-III, IST1, MAPT
Introduction
Intracellular accumulation of wild-type full-length MAPT/Tau (microtubule associated protein tau) forming neurofibrillary tangles is hallmark pathology of AD (Alzheimer disease) and other tauopathies [1,2]. Many factors induce MAPT accumulation, such as MAPT hyperphosphorylation [3], glycosylation [4], SUMOylation [5], and the proteasome inhibition [6]. Studies also suggest that autophagy deficit is involved in MAPT accumulation. For instance, the phosphorylated MAPT and GSK3B (glycogen synthase kinase 3 beta) are redistributed into ubiquitin-SQSTM1/p62 (sequestosome 1)-positive inclusions in ATG7 (autophagy related 7)-deficient neurons [7], while activation of autophagy by rapamycin [8], trehalose [9], or methylene blue [10] could limit intracellular MAPT aggregates. In the AD brains, the autophagy processes in neurons are blocked, evidenced by massive accumulation of AVs (autophagic vacuoles) including autophagosomes and autolysosomes within the dystrophic neuritis [11]. The neurons treated with lysosomal inhibitor exhibit accumulation of AVs with morphologies similar to those seen in the AD brains [12].
Intracellular MAPT accumulation plays a crucial role in AD neurodegeneration, but the mechanisms are still elusive. Recent studies indicate that the intracellular accumulated MAPT can in turn serve as an upstream causative factor to impair the cellular functions. For instance, MAPT accumulation disrupts intracellular calcium homeostasis leading to CREB dephosphorylation by activating PPP3C/calcineurin [13]. With the increasing cytoplasmic accumulation, MAPT proteins are translocated concentration-dependently into the mitochondria where they disrupt mitochondrial dynamics and cause mitophagy deficit [14,15]. More interestingly, overexpressing MAPT in rats increases LC3 (microtubule-associated protein 1 light chain 3)-II with massive accumulation of MAPT in AVs [16], and accumulation of AVs has been observed in the AD brains and mouse model of tauopathies [11,17]. These data suggest either an enhanced autophagy induction or an impaired autophagy completion in the pathogenesis of AD, but the molecular mechanisms are not known.
An intact autophagy process consists of 3 sequential steps, induction, autophagosome formation, and autophagosome-lysosome fusion and degradation [18,19]. Induced by nutritional or trophic deprivation under conditions of cell stress, autophagy provides substrates for energy or new synthesis by turning over nonessential cytoplasmic constituents, including organelles. The autophagosome-lysosome fusion and degradation require the formation of ESCRT complex [20]. Among various ESCRT machineries, ESCRT-III which contains IST1 and CHMP (charged multivesicular body proteins) subunits [20,21], is crucial in biogenesis of MVB (multivesicular bodies), budding, and abscission during cytokinesis [22]. Depletion of ESCRT-III subunits or its dysfunction results in autophagosome accumulation [23,24], indicating that ESCRT complex is required for autophagy completion.
Many studies show that autophagy deficit can cause MAPT accumulation [9,25], while much less attention has been paid on the cellular role of the accumulated MAPT proteins. Here, we found that MAPT accumulation induced autophagy deficit that reversely exacerbated MAPT aggregation with synapse and behavior impairments. MAPT accumulation inhibited IST1 expression and thus disrupted ESCRT-III complex formation with repressed autophagosome-lysosome fusion. The reduction of IST1 involved upregulation of ANP32A (acidic nuclear phosphoprotein 32 family member A), a key component of INHAT (inhibitor of histone acetyl transferase) complex, which blocked histone acetylation. Simultaneous upregulation of IST1 rescued MAPT-induced autophagy regression with improvement of synaptic plasticity and cognitive functions.
Results
MAPT accumulation induces autophagy deficit by blocking autophagosome-lysosome fusion
To investigate the role of MAPT in autophagy, we first established cell lines (HEK293) with Transient (T293MAPT) or Stable overexpression of human wild-type full-length MAPT (S293MAPT) or the vector (T293vec or S293vec). We exposed the cell lines to starvation for 6 h and then measured the level of LC3-II. The expression of MAPT proteins was confirmed by polyclonal antibodies (R134d or tau5) (Figure 1). We observed that LC3-II level was significantly increased in both vec- and MAPT-expressing cells after starvation, but the increase was much more significant in cells with transient and stable overexpression of MAPT (Figure 1A,B). Interestingly, the increase of LC3-II in S293MAPT-cell line was already significant at 0 h of starvation (Figure 1B), which supports a critical role of MAPT accumulation per se in autophagy induction. By immunofluorescence staining, we observed that number of LC3 puncta was remarkably increased in pEGFP-MAPT-expressing cells and AAV-pEGFP-MAPT-expressing neurons compared with the AAV-pEGFP vector controls (Figure 1C,E, Figure S1D,E). By co-transfection of MAPT with DsRed-LC3 in HEK293 cells or co-infection of AAV-MAPT with lenti-RFP-LC3 in primary cultured hippocampal neurons, we further confirmed by direct fluorescence imaging that MAPT accumulation remarkably increased the number of LC3 puncta (Figure 1D and Figure S1A–C). These data together demonstrate that MAPT accumulation increases LC3-II.
Figure 1.
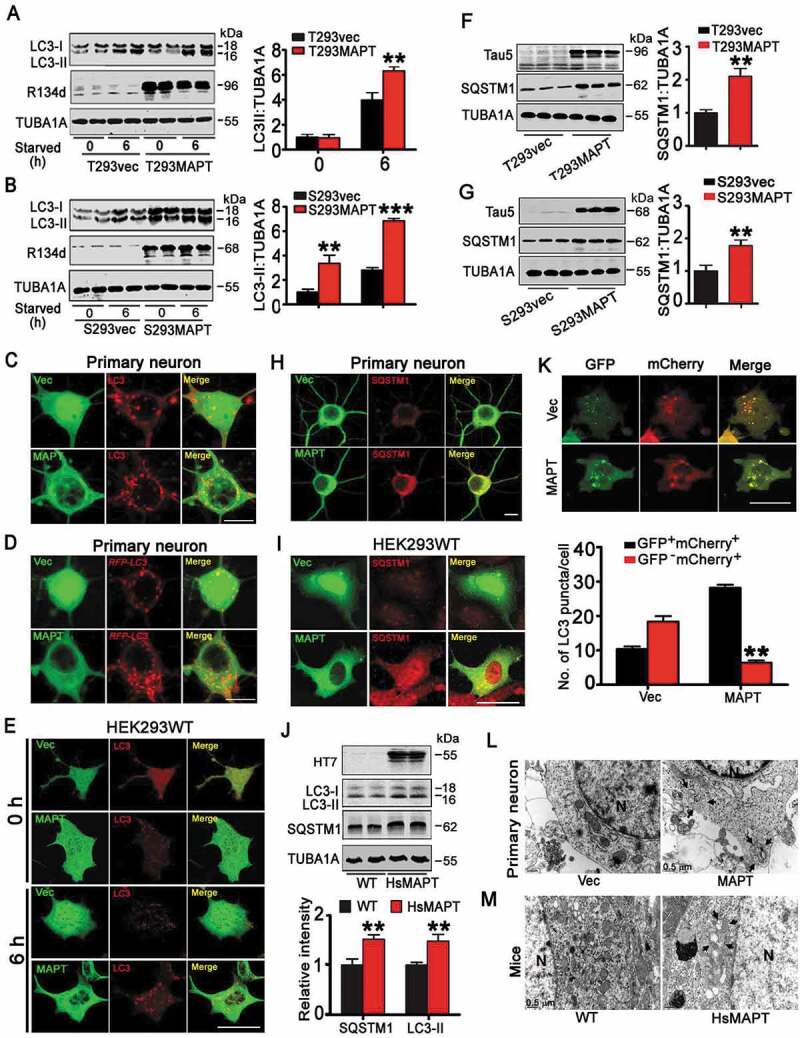
Overexpression of HsMAPT induces autophagy deficit with autophagosome accumulation. (A, B) HEK293 cells, with transient expression of pEGFP-C1-HsMAPT (human tau40) for 48 h (A) or with stable expression of pcDNA-HsMAPT (B) or their vectors (pEGFP-C1 or pcDNA), were starved for 6 h, and then LC3-II level was measured by western blotting. R134d reacts with total MAPT; TUBA1A against tubulin was used as loading control. Densitometric analyses of LC3-II were expressed as a ratio of LC3-II:TUBA1A (right). (n = 3 independent experiments for each group). **, p < 0.01, ***, p < 0.001 vs vec. (C) Primary cultured hippocampal neurons (7 div) were transfected with AAV-GFP-HsMAPT or the AAV-GFP virus and continued to culture for another 7 d, and then starved for 6 h. The increased LC3 puncta in HsMAPT-expressing neurons were visualized by immunofluorescence using anti-LC3 antibody (also see Figure S1E). Scale bar: 10 µm (at least 28 neurons were analyzed from 3 independent experiments for each group). (D) Primary cultured hippocampal neurons (div 7) co-transfected with AAV-GFP-HsMAPT and lenti-RFP-LC3 cultured for 7 d, and then starved for 6 h. The increased LC3 puncta in HsMAPT-expressing neurons was measured by direct fluorescence (also see Figure S1C). Scale bar: 10 µm (at least 29 neurons were analyzed for each group). (E) HEK293 cells with transient expression of HsMAPT (pEGFP-C1-tau40) or the vector (pEGFP-C1) and starved for 6 h. The increased LC3 puncta in HsMAPT-expressing cells were visualized by immunofluorescence with anti-LC3 antibody (also see Figure S1D). Scale bar: 20 µm (at least 38 cells were analyzed for each group). (F and G) The increased SQSTM1 in HEK293 cells with transient (F) or stable (G) expression of HsMAPT measured by western blotting. Tau5 reacts with total MAPT proteins (n = 3 for each group). **, p < 0.01 vs vec. (H and I) Overexpression of HsMAPT increased SQSTM1 level in primary cultured hippocampal neurons transfected with AAV-GFP-HsMAPT or AAV-GFP as vector control (H) and in HEK293 cells transfected with pEGFP-C1-HsMAPT or pEGFP-C1 (I), measured by immunofluorescent staining after starved for 6 h. Scale bar: 10 µm (H), 20 µm (I). (J) The increased levels of LC3-II and SQSTM1 in the hippocampi of HsMAPT transgenic mice (12-month-old) compared with the age-matched wild-type littermates (WT) measured by western blotting (n = 4 mice for each group). **, p < 0.01 vs WT. (K) HEK293 cells co-transfected with mCherry-GFP-LC3 and pcDNA-MAPT (human tau40, non-eGFP tag) or the vectors for 36 h and then starved for 6 h. The reduced GFP− mCherry+ puncta was seen in HsMAPT-expressing cells measured by direct fluorescence imaging (at least 40 cells were analyzed for each group). Scale bar: 10 µm. **, p < 0.05 vs Vec. (L) Primary hippocampal neurons (div 7) were transfected with AAV-GFP-HsMAPT or AAV-GFP and continued to culture for 7 d, and then starved for 6 h. The increased autophagosomes in HsMAPT-expressing cells were measured by transmission electron microscopy and quantitative analysis (see Figure S1F). N, nucleus; arrow, autophagosome. (n = 5 cells for each group). **, p < 0.01 vs Vec. (M) The increased autophagosomes were shown in hippocampal CA3 of HsMAPT transgenic mice (12-month-old), measured by transmission electron microscopy and quantitative analysis (see Figure S1G). N, nucleus; arrow, autophagosome. (n = 3 mice for each group). **, p < 0.01 vs WT. Data were expressed as means ± SD.
As the increase of LC3-II can be an indicator of an enhanced autophagy induction or an impaired LC3-II degradation during autophagy progression [26], we further studied the role of MAPT in autophagy. We measured the level of SQSTM1, a well-accepted substrate of autophagy. Upon 6 h starvation, SQSTM1 level was much higher in MAPT-expressing HEK293 cells and neurons than in the vector-controls detected by western blotting (Figure 1F,G) and immunofluorescent staining (Figure 1H,I), suggesting the suppression of the clearance of SQSTM1 in MAPT-expressing cells. The levels of LC3-II and SQSTM1 were also much higher in the hippocampus of 12-month-old human MAPT transgenic mice (termed HsMAPT herein) than the age-matched wild-type littermates (Figure 1J). Taken together, these data indicate that MAPT accumulation induces autophagy deficit by blocking autophagy progression.
To verify whether MAPT accumulation blocks autophagy progression, we measured autophagic flux. By using a double-tagged LC3 (GFP-mCherry-LC3) that contains an acid-sensitive GFP and an acid-insensitive mCherry, we could distinguish autophagosome from autolysosome. In this method, the change from autophagosome (neutral pH) to autolysosome (acidic pH) can be visualized by imaging the quench of GFP fluorescence, leaving only red fluorescence. HEK293 were transiently co-expressed with a tandem mCherry-GFP-LC3 fusion protein and pcDNA-MAPT (non-eGFP tag) or pcDNA-vector, and the numbers of autophagosomes (GFP+mCherry+, yellow puncta) or mature autolysosomes (GFP−mCherry+, red puncta) were measured using confocal microscopy. Compared with T293vec cells, number of yellow puncta increased and the number of red puncta decreased in MAPT-expressing cells (Figure 1K), indicating an increased number of autophagosomes not fused with the lysosome. By electron microscopy, the increased autophagosome was also detected in primary hippocampal neurons after overexpressing MAPT and in HsMAPT transgenic mice (Figure 1L,M), Figure S1F,G). These data together demonstrate that MAPT accumulation represses autophagy completion by disrupting autophagosome-lysosome fusion.
MAPT accumulation inhibits expression of IST1
To explore the mechanism underlying MAPT-induced autophagy repression, we used mRNA microarray to search for the altered autophagy-related genes by MAPT accumulation. We found that overexpressing MAPT decreased mRNA level of IST1 by ~40% of the control level, while had little influence on ATG3 and several other autophagy-related genes (Figure S2). The reduction of IST1 mRNA in MAPT-transfected cells was confirmed by quantitative real-time PCR (Figure 2A). Accordingly, IST1 protein level was also decreased in MAPT-expressing cells (Figure 2B,C), the hippocampus of HsMAPT mice (Figure 2D), and the cortex of AD patient brain (Figure 2E,F). As IST1 is required for ESCRT-associated autophagic pathway [20], we speculate that IST1 deficit must play a role in MAPT-induced autophagy impairment.
Figure 2.
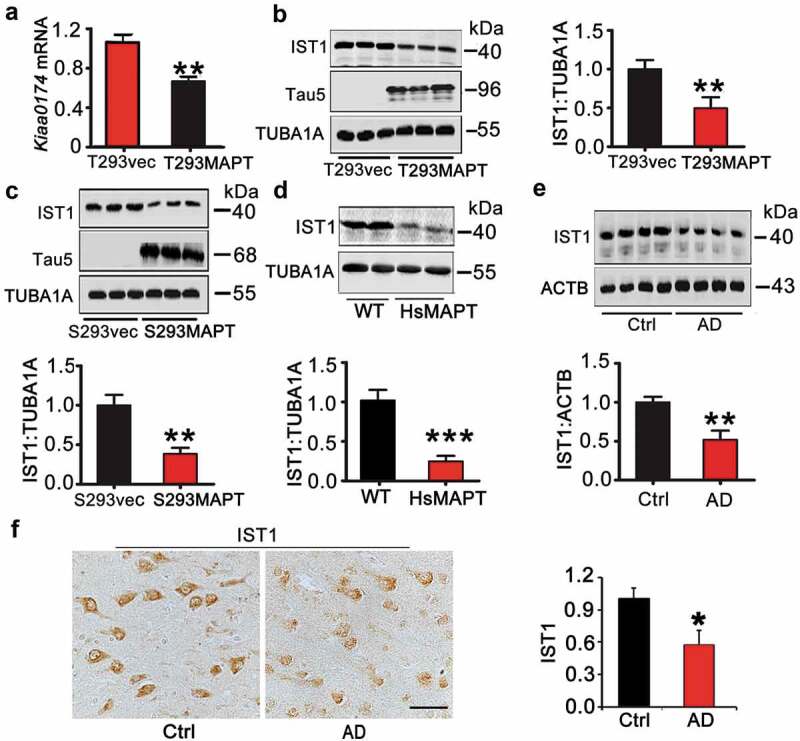
Overexpression of HsMAPT decreases IST1 mRNA and protein levels. (A–C) Both transient and stable expression of HsMAPT decreased IST1 mRNA (A) and protein (B, C) levels in HEK293 cells measured by qRT-PCR and western blotting, respectively (n = 3 independent experiments for each group). (D–F) IST1 protein level was decreased in hippocampus of HsMAPT transgenic mice (12-month-old) and the brain cortex of AD patients measured by western blotting and immunohistochemistry (n = 4 mice or human cases for each group). Data were expressed as means ± SD. *, p < 0.05, **, p < 0.01 vs vec, WT, or Ctrl. Scale bar: 50 µm.
Therefore, we measured the age- and organ-specific expression pattern of IST1. The results showed that IST1 was expressed throughout the mouse embryos, and in most adult tissues including different brain regions, with high level in liver and the cortex (Figure S3A–C). In primary cultured hippocampal neurons 12 days in vitro (div 12), IST1 was mainly detected in the cell body and the proximal end of dendrites (Figure S3D).
Knockdown of IST1 represses autophagy by inducing autophagosome accumulation
To verify the role of IST1 in MAPT-induced autophagy repression, we first examined the impact of IST1 knockdown on autophagy in HEK293WT cells (using pCMV-G&NR-RNU6-siIST1) and in primary cultured hippocampal neurons (using lenti-CMV-eGFP-siIST1). The knockdown efficiency and the effects on autophagy were confirmed by the reduced IST1 protein level with significantly increased LC3-II and SQSTM1 after 6 h starvation (Figure 3A–D, Figure S4). Immunofluorescent staining showed increased red LC3 puncta in siIST1-eGFP-expressing cells and primary cultured hippocampal neurons, indicating autophagosome accumulation (Figure 3B,C). Autophagosome accumulation was also observed in HEK293 cells co-transfected with siIST1-eGFP and DsRed-LC3, and primary cultured hippocampal neurons co-infected with lenti-eGFP-siIST1 and lenti-RFP-LC3 respectively (Figure S4A–D). These in vitro data demonstrate that IST1 deficit represses autophagy by inducing autophagosome accumulation.
Figure 3.
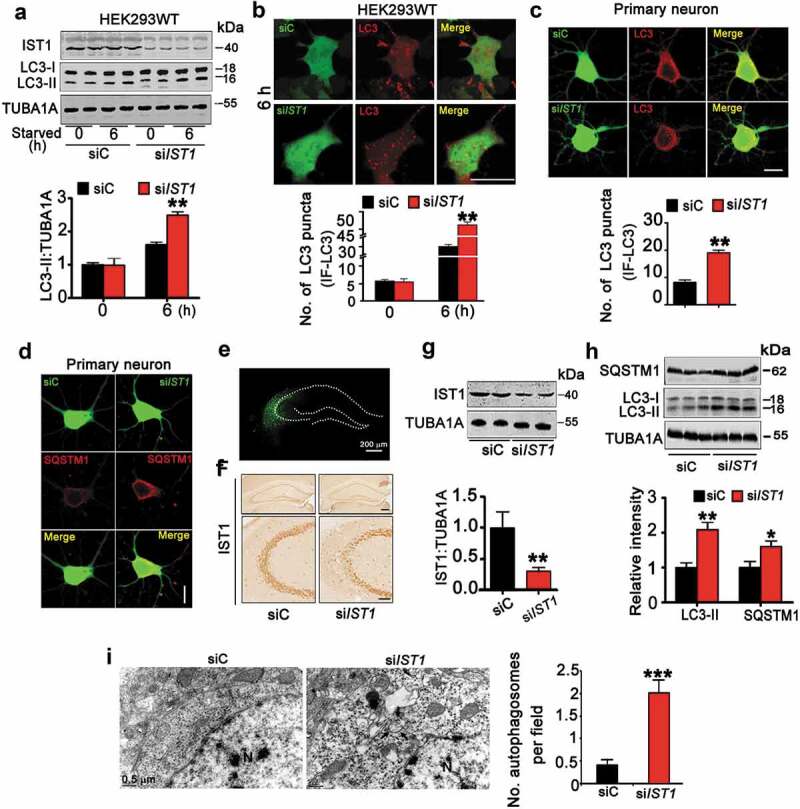
Downregulation of IST1 induces autophagosome accumulation. (A and B) HEK293 cells were transfected with siIST1 (pCMV-G&NR-RNU6-siIST1) or its vector for 48 h and then starved for 6 h. The increased LC3-II protein (A) and LC3 puncta (B) were detected by western blotting and immunofluorescent staining in the cells with downregulating IST1. Scale bar: 20 µm. **, p < 0.01 vs siC (at least 45 cells were analyzed for each group). (C and D) Primary cultured hippocampal neurons (div 7) were infected with lenti-GFP-siIST1 and continued to culture for another 7 d, and starved for 6 h. Downregulating IST1 increased LC3 puncta (C) and SQSTM1 (D). Scale bar: 10 µm (at least 38 neurons were analyzed for each group). (E–G) Lenti-eGFP-siIST1 (siIST1) or its vector virus (siC) was injected stereotaxically into the hippocampal CA3 of 3-month-old C57 mice. The efficiency of virus infection and IST1 downregulation were confirmed by direct immunofluorescent imaging (E), immunohistochemical staining with anti-IST1 antibody (F) and western blotting (G, hippocampal CA3 subset was dissected under a fluorescent microscope), respectively (n = 3 mice for each group). Data were expressed as mean ± SD. **, p < 0.01 vs siC. Scale bar: 100 µm or 50 µm (enlarged). (H and I) Downregulation of IST1 increased LC3-II and SQSTM1 levels with increased autophagosome in mouse hippocampal CA3 measured by western blotting and transmission electron microscopy (N, nucleus; arrow, autophagosome; n = 3 mice for each group). Data were expressed as means ± SD. *, p < 0.05, **, p < 0.01, ***, p < 0.001 vs vec or siC.
To verify the in vivo role of IST1 deficit in MAPT-induced autophagy repression, we infused lenti-siIST1-eGFP into the hippocampal CA3 of 3-month-old C57 mice. After one month, the knockdown efficiency of IST1 was confirmed by direct fluorescence imaging (Figure 3E), immunohistochemistry (Figure 3F) and western blotting (Figure 3G). Simultaneously, downregulating IST1 significantly increased protein level of SQSTM1 and LC3-II (Figure 3H). The increased number of autophagosomes was shown in hippocampal CA3 subset upon IST1 knockdown (Figure 3I). These in vivo data confirm that IST1 deficit impairs autophagy by blocking autophagosome degradation.
Upregulating IST1 rescues MAPT-induced autophagy impairment
Secondly, we explored whether upregulating IST1 can rescue MAPT-induced autophagy repression. We overexpressed IST1 in S293MAPT cells and measured the levels of LC3-II and SQSTM1. Compared with the control, overexpressing IST1 by transfection with eGFP-N1-IST1 remarkably suppressed MAPT-induced elevation of LC3-II (Figure 4A) and SQSTM1 (Figure 4B). By co-transfection of eGFP-N1-IST1 and DsRed-LC3 in S293MAPT cells for 48 h, we observed that expression of IST1 significantly attenuated MAPT-induced accumulation of LC3 puncta (Figure 4C). By co-transfection of mCherry-GFP-LC3 with eCFP-N1-IST1 or CFP-vec in S293MAPT cells for 48 h, we also observed that the red LC3 puncta (indicating mature autolysosomes) was much more abundant in IST1-overexpressing cells than the vector control (Figure 4D), which confirms that overexpressing IST1 attenuates HsMAPT-induced deficits in autophagosome and lysosome fusion. Altogether, these in vitro data demonstrate that simultaneous upregulating IST1 rescues MAPT-induced autophagy repression by promoting autophagosome-lysosome fusion.
Figure 4.
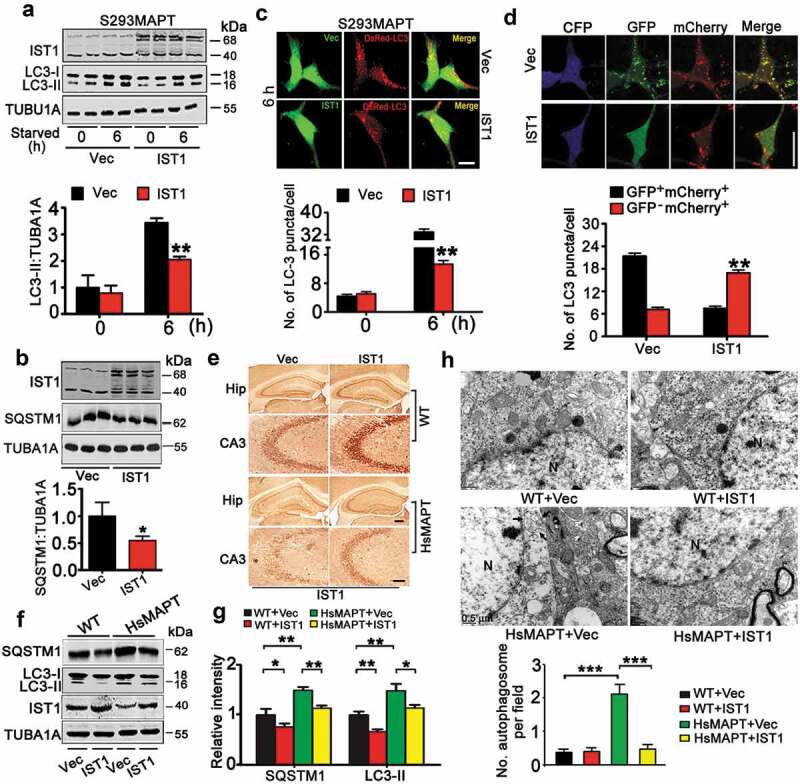
Upregulating IST1 rescues HsMAPT-induced autophagy impairment by promoting autophagosome and lysosome fusion. (A and B) HEK293 cells with stable expression of HsMAPT (S293MAPT) were transfected with eGFP-N1-IST1 or its vector for 48 h and then starved for 6 h, the LC3-II and SQSTM1 protein levels were measured by western blotting (n = 3 independent experiments for each group). *, p < 0.05; **, p < 0.01 vs Vec. (C) S293MAPT cells were co-transfected with DsRed-LC3 and eGFP-N1-IST1 or the vector for 48 h and starved for 6 h. The reduced LC3 puncta by overexpressing IST1 was detected by direct fluorescence imaging. Scale bar: 10 µm (at least 48 cells were analyzed for each group). **, p < 0.01 vs Vec. (D) S293MAPT were co-transfected with mCherry-GFP-LC3 and eCFP-N1-IST1 or the vector for 48 h and starved for 6 h, and then the increased GFP−mCherry+ puncta by overexpressing IST1 were detected by direct fluorescence imaging. Scale bar: 20 µm (at least 40 cells were analyzed for each group). *, p < 0.05 vs Vec. (E–H) AAV-mCherry-IST1 or AAV-mCherry was injected stereotaxically into the hippocampal CA3 of 12-month-old HsMAPT transgenic mice and the age-matched littermates for 1 m. (E) The efficiency of IST1 overexpression was confirmed by immunohistochemical staining with anti-IST1 antibody. Scale bar: 100 µm or 50 µm (enlarged). (F and G) Overexpression of IST1 decreased SQSTM1 and LC3-II levels in hippocampal CA3 of HsMAPT transgenic mice and the age-matched wild-type littermates measured by western blotting (n = 3 mice for each group). *, p < 0.05, **, p < 0.01. (H) Increased number of autophagosomes (arrow) in hippocampal CA3 of HsMAPT transgenic mice, and overexpressing IST1 decreased the autophagosomes number measured by electron microscopy and quantitative analysis. N, nucleus; arrow, autophagosome. (n = 3 mice for each group). Data were expressed as means ± SD. ***, p < 0.001.
In vivo, AAV-mCherry-IST1 was infused stereotaxically into the hippocampal CA3 (the most enriched phosphorylated MAPT expression subset) of 12-month-old HsMAPT transgenic mice and the age- and sex-matched wild-type littermates. After one month, the overexpression of IST1 in hippocampal CA3 was confirmed by direct fluorescence imaging (Figure S5), immunohistochemical staining with anti-IST1 antibody (Figure 4E), and western blotting (Figure 4F,G). Overexpressing IST1 significantly reduced protein level of LC3-II and SQSTM1 in wild-type and the HsMAPT mice (Figure 4F,G). By transmission electron microscopy, we also observed that overexpression of IST1 significantly decreased autophagosome in HsMAPT mice (Figure 4H). These in vivo data further confirm that upregulating IST1 promotes autophagosome-lysosome fusion and rescues MAPT-induced autophagy repression. To distinguish between autophagic and endocytic effects of IST1, we analyzed EGFR (epidermal growth factor receptor) which is known to be degraded through endocytic trafficking. The results showed that knockdown of IST1 in HEK293 cells and hippocampal neurons did not affect EGFR degradation kinetics following EGF stimulation (Figure S6), which was in consistence with a previous report [27]. These data indicate that IST1 knockdown may not affect endocytic trafficking.
Figure 6.
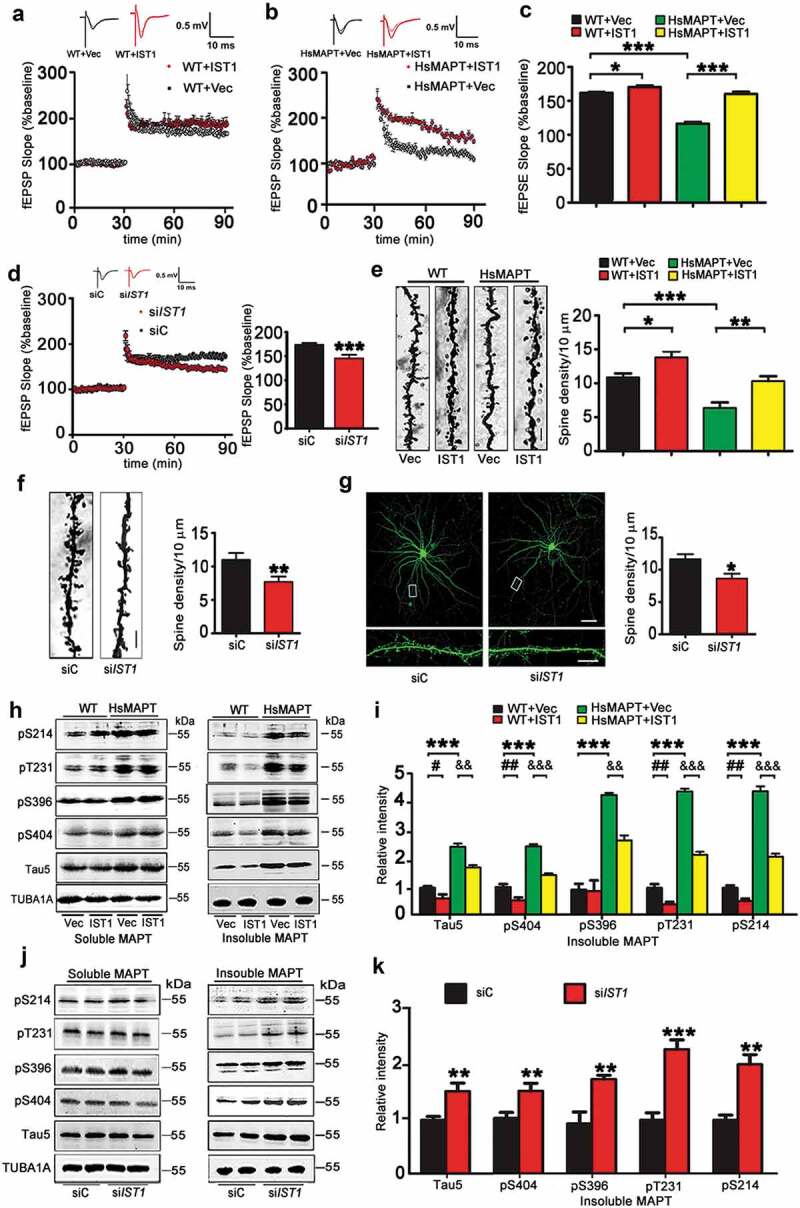
IST1 modulates synaptic plasticity and MAPT degradation. (A–C) AAV-mCherry-IST1 (IST1) or AAV-mCherry (Vec) was infused stereotaxically into the hippocampal CA3 of 12-month-old HsMAPT transgenic mice and the wild-type littermates. After 30 days, the fEPSP was recorded in hippocampal CA3 by stimulating mossy fibers in slices from HsMAPT transgenic mice and the wild-type littermates. LTP magnitude was calculated as the average (normalized to baseline) of the responses recorded 50–60 min after conditioning stimulation. Overexpression of IST1 reversed the HsMAPT-suppressed slope of fEPSP (n = 7 ~ 8 slices from 4 mice for each group). *, p < 0.05, ***, p < 0.001. (D) Lenti-eGFP-siIST1 or its vector was infused stereotaxically into the hippocampal CA3 of 3-month-old C57 mice. After 30 days, the fEPSP was recorded in hippocampal CA3 by stimulating mossy fibers in slices from C57 mice. LTP magnitude was calculated as the average (normalized to baseline) of the responses recorded 50–60 min after conditioning stimulation. Downregulation of IST1 decreased the slope of fEPSP (n = 7 ~ 8 slices from 4 mice for each group). ***, p < 0.001 vs siC. (E) AAV-mCherry-IST1 (IST1) or AAV-mCherry (Vec) was infused stereotaxically into the hippocampal CA3 of 12-month-old HsMAPT transgenic mice. After 30 days, spine density was detected by Golgi staining. Overexpression of IST1 in HsMAPT transgenic mice restored the spine density in hippocampal CA3 neurons (at least 18 neurons were analyzed from 3 mice per group). Scale bar: 5 µm. *, p < 0.05, **, p < 0.01, ***, p < 0.001. (F) Lenti-eGFP-siIST1 or its vector was infused stereotaxically into the hippocampal CA3 of 3 m-old C57 mice. After 30 days, spine density was detected by Golgi staining. Downregulation of IST1 in wild-type mice decreased dendritic spine density in hippocampal CA3 neurons (at least 20 neurons were analyzed from 3 mice per group). Scale bar: 5 µm. **, p < 0.01 vs siC. (G) Lenti-GFP-siIST1 or its vector was transfected to primary cultured hippocampal neurons at div 12, and a significantly decreased spine density was detected in neurons with IST1 knockout at div 18 by direct fluorescence imaging (at least 20 neurons were analyzed per group). Scale bar: 50 µm (upper) or 5 µm (lower). *, p < 0.05 vs siC. (H and I) AAV-mCherry-IST1 (IST1) or AAV-mCherry (Vec) was infused stereotaxically into the hippocampal CA3 of 12 m-old HsMAPT transgenic mice. After 30 days, soluble and insoluble MAPT levels were detected by western blotting. Overexpression of IST1 decreased the phosphorylated MAPT at S214, T231, S396 and S404, and total MAPT (Tau5) in the insoluble fraction without influencing the MAPT levels in the soluble fraction in hippocampal CA3 extracts of HsMAPT transgenic mice (n = 3 mice for each group). ***, p < 0.001; #, p < 0.05, ##, p < 0.01; &&, p < 0.01, &&&, p < 0.001. (J, K) Lenti-eGFP-siIST1 or Lenti-eGFP was infused into the hippocampal CA3 of 3-month-old C57 mice. After 30 days, soluble and insoluble MAPT levels were detected by western blotting. Downregulation of IST1 significantly increased phosphorylated and total MAPT levels in the insoluble fraction without influencing the MAPT levels in the soluble fraction in the hippocampal CA3 extracts of wild-type mice (n = 3 mice for each group). **, p < 0.01; ***, p < 0.001 vs siC. Data were expressed as mean ± SD (A-D) or mean ± SEM (E-G).
Upregulating IST1 ameliorates cognitive deficits in HsMAPT transgenic mice
After confirming that upregulating IST1 could rescue MAPT-induced autophagy repression, we further detected whether upregulating IST1 could improve HsMAPT-induced cognitive deficit. In MWM (Morris water maze) test, the HsMAPT transgenic mice showed learning and memory deficits compared with the age-matched littermates (Figure 5B–D), while overexpressing IST1 (Figure 4E,F) improved learning ability both in wild-type (day 2 and 5) and HsMAPT (day 3 and 6) mice shown by the decreased latency to find the submerged platform during 6 consecutive days training (Figure 5A,B). The improved memory of HsMAPT mice was shown by the decreased latency to find the platform site, the increased crosses in the platform area and increased time stayed in the platform quadrant measured at day 8 after removed the platform (Figure 5C,D). No significant difference in swimming speed was seen among the 4 groups (Figure 5D). By step-down avoidance test, we also observed that overexpressing IST1 ameliorated the short- and long-term memory deficits of HsMAPT mice (Figure S7).
Figure 5.
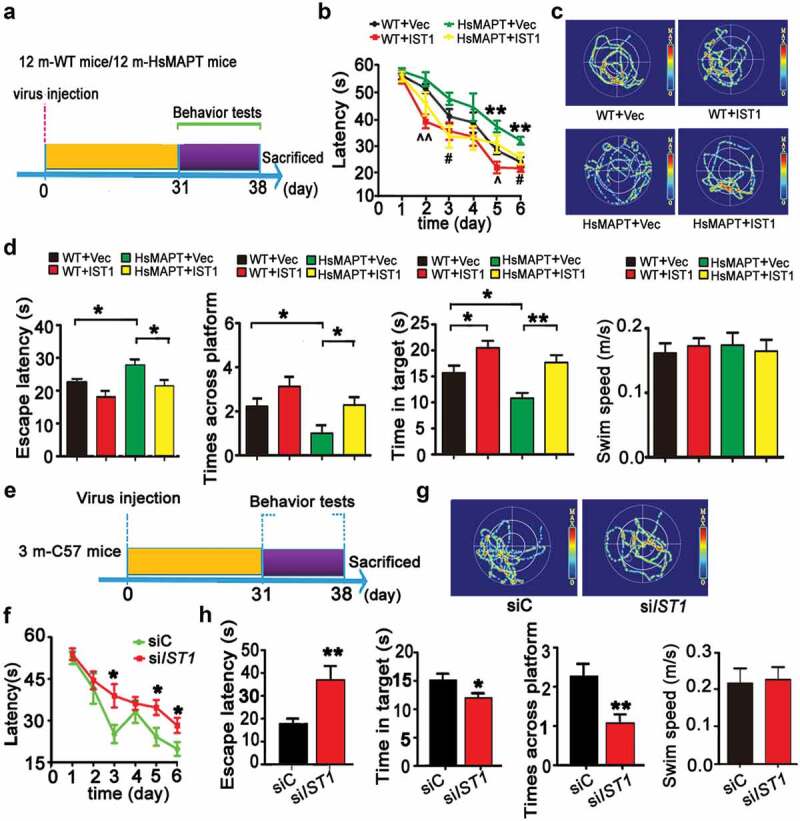
Upregulating IST1 ameliorates cognitive deficits in human MAPT transgenic mice. (A–D) AAV-mCherry-IST1 (IST1) or AAV-mCherry (vec) was infused stereotaxically into the hippocampal CA3 of 12-month-old HsMAPT transgenic mice and the age-matched wild-type littermates for 30 days, and then the cognitive behavior was detected. (A) Diagram of the experimental procedure. (B) Overexpression of IST1 improved learning ability shown by decreased escape latency during water maze training test (n = 8 mice for each group). **, p < 0.01 (HsMAPT+vec vs WT+vec); #, p < 0.05 (HsMAPT+IST1 vs HsMAPT+vec); ^, p < 0.05, ^^, p < 0.01 (WT+IST1 vs WT+vec). (C) The representative swimming trace of the mice during memory test in water maze after removed the platform. (D) Overexpression of IST1 improved the memory capacity shown by the decreased escape latency, more crosses on the site where the platform was placed, and longer retention time in the target quadrant after the platform was removed on day 8. There was no significant difference in swimming speed among the 4 groups (n = 8 mice for each group). *, p < 0.05, **, p < 0.01. (E–H) Lenti-eGFP-siIST1 or its vector was infused stereotaxically into the hippocampal CA3 of 3-month-old C57 mice for 30 days, and then the cognitive behavior was detected. (E) Diagram of the experimental procedure. (F) Downregulation of IST1 impaired learning ability shown by the increased escape latency during training (n = 9 mice for each group). (G) the representative swimming trace of the mice during memory test in water maze. (H) Downregulation of IST1 impaired spatial memory shown by the increased latency to find the previous platform, and the decreased time stayed in the target quadrant and the decreased crosses in the previous platform area. There was no significant difference in swimming speed between the siIST1 and siC infused mice (n = 9 mice for each group). *, p < 0.05, **, p < 0.01 vs siC. The data were expressed as mean ± SEM.
We also studied the influence of IST1 per se on cognitive functions in wild-type mice through hippocampal knockdown of IST1 (Figure 5E–H). Compared to the lenti-siC control mice, knockdown of IST1 by expressing lenti-siIST1 significantly decreased the latency to find the submerged platform measured at day 3, 5, and 6 by MWM test (Figure 5F). In memory test measured at day 8 by removed the platform, the mice with IST1 knockdown showed much longer average latency to find the site where the platform was placed before, less crosses in the platform area and less time stayed in the platform quadrant than the control mice (Figure 5G,H). No significant difference in swimming speed was seen between the 2 groups (Figure 5H). These data demonstrate that IST1 plays an essential role in spatial learning and memory.
IST1 can modulate synaptic plasticity and MAPT degradation in mice
To investigate the mechanisms underlying IST1-modulated cognitive functions, we first measured the effect of IST1 on LTP (long-term potentiation) on acute hippocampal slices. The results showed that overexpressing IST1 increased fEPSP slope recorded in CA3 by stimulating mossy fibers in both HsMAPT transgenic mice and the wild-type littermates (Figure 6A–C). By Golgi staining, overexpressing IST1 increased spine density in hippocampal CA3 subset of HsMAPT and the wild-type mice (Figure 6E). On the other hand, downregulating IST1 in hippocampal CA3 of 3-month-old C57 mice decreased fEPSP slope of mossy fiber-CA3 (Figure 6D) with reduction of spine density (Figure 6F). In primary cultured hippocampal neurons, expressing lenti-siIST1-eGFP at div 12 also significantly decreased spine density measured at div 18 (Figure 6G). These data suggest that IST1 can modulate synaptic plasticity.
To further explore the mechanisms underlying the improved synaptic plasticity, we measured the levels of soluble and insoluble MAPT proteins. We found that overexpressing IST1 in S293MAPT cells significantly decreased total MAPT level (Tau 5) (Figure S8A,B). Further study by fractionating soluble and insoluble MAPT showed that overexpressing IST1 decreased insoluble MAPT without significantly changing the soluble MAPT (Figure S8C–F). In HsMAPT mice, reduced total MAPT and insoluble phosphorylated MAPT at multiple AD-associated sites were detected by overexpressing IST1 (Figure S9A, Figure 6H,I), while knockdown of IST1 increased MAPT in total extracts and the insoluble fraction without affecting MAPT in the soluble fraction (Figure S9B, Figure 6J,K). These data indicate that IST1 may improve synaptic plasticity by regulating autophagic clearance of insoluble MAPT.
IST1 deficits underlie MAPT-induced autophagy repression by disrupting ESCRT assembly
We further studied how IST1 reduction mediates MAPT-induced autophagy repression. IST1, CHMP4B/SNF7-2, and CHMP2B are major components of ESCRT-III [24], and interaction of CHMP4B and CHMP2B has been reported for the formation of ESCRT-III complex which is required for the lysosomal degradation of autophagosome [23]. By incubating the purified recombinant proteins, we found the association of IST1 with both CHMP4B and CHMP2B (Figure 7A). Further studies reveal that IST1 interacted with CHMP2B and CHMP4B respectively at N-terminal 1–64 amino acids and C-terminal 300–366 amino acids (Figure 7B). To further explore the mechanisms underlying MAPT-induced autophagosome accumulation, we measured the effects of MAPT and IST1 on the expression of CHMP2B and CHMP4B. The results showed that neither overexpressing MAPT (Figure 7C) nor downregulating IST1 by siRNA (Figure 7D) changed the total protein level of CHMP4B or CHMP2B in HEK293 cells. Then, we detected the effects of MAPT accumulation or IST1 deficit on the interaction of IST1, CHMP2B and CHMP4B, which is involved for the assembly and functions of ESCRT-III complex. We found that both overexpressing MAPT (Figure 7E) and downregulating IST1 (Figure 7F) disrupted association of CHMP2B with CHMP4B. Overexpressing MAPT also remarkably decreased the interaction of IST1 with CHMP4B or CHMP2B (Figure 7G). These data suggest that MAPT accumulation represses autophagy completion by disrupting IST1-related ESCRT-III complex formation.
Figure 7.
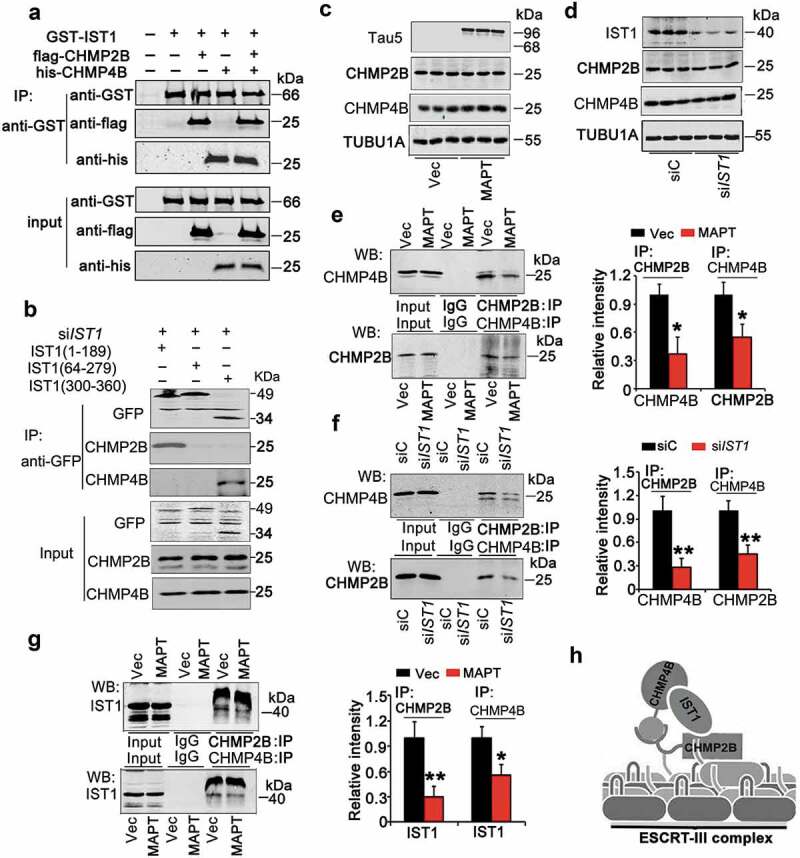
Downregulation of IST1 disrupts assembly of ESCRT-III complex. (A) IST1 interacts directly with CHMP2B and CHMP4B/SNF7-2. GST-tagged IST1, flag-tagged CHMP2B and his-tagged CHMP4B were bacterially produced and purified. The purified proteins were incubated together, and the binding of IST1 to CHMP2B and CHMP4B was examined by western blotting. (B) HEK293 cells were transfected with pCMV-G&NR-RNU6-siIST1 for 36 h to knockdown the endogenous IST1, and then the truncated IST1 fragments (pcDNA-GFP-IST11-189, pcDNA-GFP-IST164-279, pcDNA-GFP-IST1300-366) were transfected into the same cells for another 24 h. The interaction of the truncated IST1 fragments with CHMP2B and CHMP4B was detected by co-immunoprecipitation. (C–F) HEK293 cells were transfected with pEGFP-C1-MAPT (htau40), pCMV-G&NR-RNU6-siIST1 or its vector control for 48 h, and the cell extracts were used for western blotting (C, D) or co-immunoprecipitation (E, F). (C and D) Overexpression of MAPT (C) or downregulation of IST1 (D) did not alter the protein level of CHMP2B and CHMP4B in HEK293 cells. (E and F) Overexpression of MAPT (E) or downregulation of IST1 (F) decreased the association of CHMP2B and CHMP4B measured by co-immunoprecipitation. (G) Overexpression of MAPT decreased association of IST1 with CHMP2B and CHMP4B measured by co-immunoprecipitation, respectively. (H) The hypothetic interaction model of IST1 with CHMP2B and CHMP4B and the hypothetic position of IST1 in the ternary complex, based on our current results in HEK293 cells. (n = 3 independent experiments for each group), Data were expressed as means ± SD. *, p < 0.05, **, p < 0.01 vs Vec or siC.
MAPT accumulation suppresses IST1 transcription by masking histone acetylation
Finally, we try to understand how MAPT accumulation may influence IST1 expression. As histone acetylation at promoter-binding region regulates chromatin architecture and controls their permissiveness for transcription, we measured histone acetylation at lysine 12 (AcH4K12), an activate histone modification marker [28,29]. We found that MAPT accumulation significantly decreased AcH4K12 level without changing total H4 (Figure 8A). By ChIP assay, a significantly decreased binding level of AcH4K12 with IST1 promoter region was detected in MAPT-expressing cells (Figure 8B). These data suggest that MAPT accumulation may inhibit histone acetylation and thus decreases the transcription of IST1. To further explore the mechanism underlying the inhibited histone acetylation, we detected levels of HDACs (histone deacetylases) and HAT. We found that MAPT accumulation did not affect the mRNA and protein levels of HDAC subtypes except increased mRNA of Hdac2 (Figure 8C,D). On the other hand, MAPT accumulation significantly inhibited HAT (Figure 8E). We recently reported that MAPT accumulation could upregulate ANP32A and CEBPB (CCAAT enhancer binding protein beta) [30,31]. As ANP32A is an essential component of INHAT that can mask histone acetylation [32], we further studied whether downregulating ANP32A could attenuate MAPT-induced suppression of IST1 by infusing lenti-siANP32A-RFP into the hippocampus of HsMAPT mice. The expression of the virus at hippocampal CA3 was confirmed by direct immunofluorescence imaging (Figure S10). With downregulating of ANP32A, the levels of AcH4K12 and IST1 were significantly increased in the mice (Figure 8F,G). These data suggest that MAPT accumulation inhibits IST1 transcription by inhibiting HAT and the ANP32A/INHAT-involved masking of histone acetylation.
Figure 8.
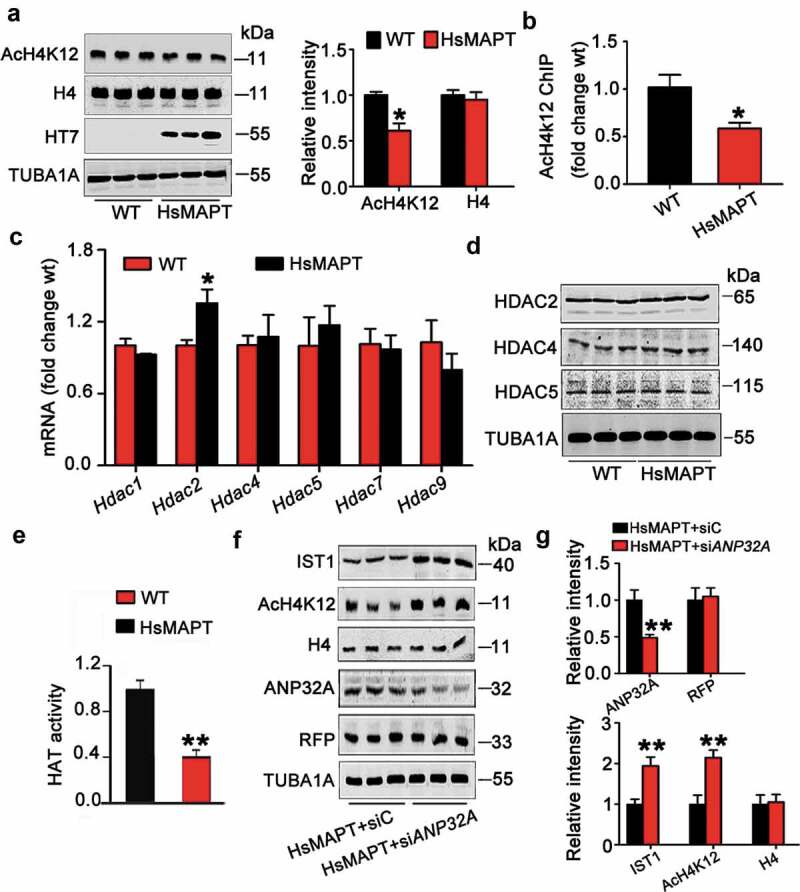
MAPT accumulation decreases IST1 transcription by masking histone acetylation. (A) Level of the acetylated histone H4 at lysine 12 (H4K12) was decreased in the hippocampus of HsMAPT transgenic mice compared with the wild-type littermates measured by western blotting (HT7 specifically reacts human MAPT protein). (B) The binding level of AcH4K12 with IST1 promoter was decreased in the hippocampus of HsMAPT transgenic mice by chromatin immunoprecipitation (ChIP) assay. (C) The mRNA level of Hdac2 was increased while the other subtype of Hdac was not changed in the hippocampus of HsMAPT transgenic mice detected by qRT-PCR. (D) The protein levels of HDAC2, 4 and 5 were not changed in the hippocampus of HsMAPT transgenic mice. (E) The activity of HAT was decreased in the hippocampus of HsMAPT transgenic mice compared with the wild-type littermates. (F) Downregulating ANP32A in hippocampal CA3 by expressing lenti-siANP32A-RFP partially reversed HsMAPT-induced reduction of IST1 and AcH4K12. Data were expressed as mean ± SD (N = 3 mice for each group). *, p < 0.05, **, p < 0.01 vs WT or HsMAPT+siC.
Discussion
It is recognized that intracellular accumulation of MAPT plays a crucial role in AD neurodegeneration and cognitive impairment. Accordingly, the related studies have been focused on searching for the upstream factors that can cause MAPT accumulation, such as autophagy deficit [8,9,33], and the mutual stimulation of phosphorylation and SUMOylation [5], etc. However, much less is known regarding the reversing effects of the increased MAPT burden onto the cells during the long course of AD neurodegeneration. For instance, could the accumulated MAPT reversely inhibit autophagy and thus form a vicious cycle? We tested this idea in the present study and found that overexpressing human MAPT, as seen in majority sporadic AD cases, resulted in autophagy deficit shown by the dramatically increased LC3-positive puncta with elevated LC3-II and SQSTM1 protein levels. By using a double-tagged LC3 (GFP-mCherry-LC3) that contains an acid-sensitive GFP and an acid-insensitive mCherry to distinguish autophagosome from autolysosome, we found an impeded fusion of autophagosome with lysosome by HsMAPT overexpression. A previous study suggests that elevation of Aβ (β-amyloid), another hallmark pathology in the AD brains, impairs autophagy by inducing autolysosome accumulation without causing a defective vesicle fusion with lysosome [34]. Therefore, it is conceivable that Aβ and MAPT accumulation in AD may synergistically induce the impairment of autophagy-lysosomal system.
The mechanism underlying the autophagosome-lysosome fusion in mammalian autophagy is currently unclear. Studies suggest that the fusion involves ESCRTs, SNAREs (soluble N-ethylmaleimide-sensitive factor attachment protein receptors), RAB7 (member RAS oncogene family), LAMP2 (lysosome associated membrane protein 2) and the VPS-C complex [20,24,25], in which the ESCRT machinery functions in membrane deformation and fission events [24]. ESCRT dysfunction has been observed in neurodegeneration shown by an impaired maturation of autophagosome into autolysosome [20,24,35,36]. ESCRT-III complex contains subunits of CHMP1A to CHMP7 and IST1 [37]. A mutation of CHMP2B associated with frontotemporal dementia has been shown to disrupt endosome-lysosome fusion, which is required for normal neuronal function [38]. Consistent with this observation, we found that knockdown of IST1 impaired fusion of autophagosome with lysosome leading to accumulation of autophagosome both in cultured cells and in mouse brain. We also found that knockdown of IST1 had no effect in EGFR degradation kinetics, which is dependent on the endosomal trafficking to lysosome. This result confirmed the previous studies [27], suggesting that IST1 knockdown selectively interferes with autophagy, but not endocytic traffic.
We showed that overexpressing HsMAPT induced autophagy deficit via downregulating IST1, which in turn disrupted association of CHMP2 and CHMP4, and impedes assembly of ESCRT-III complex and thereby impairs lysosomal degradation. A previous study carried out in yeast two-hybrid system does not find interaction between IST1 with CHMP2 and CHMP4 [39], while we observed interaction of IST1 with CHMP2B and CHMP4B both in test tube and in HEK293 cells. The discrepancy is likely due to the differences of the objects (purified proteins or cell line vs yeast) and methods (incubating different purified proteins or cell extracts immunoprecipitation vs yeast two-hybrid assay). In two-hybrid assays, incorrect folding, inappropriate subcellular localization of bait and prey proteins or degradation of chimeric proteins and absence of certain types of post-translational modifications in yeast could lead to false-negatives [40]. In addition, interaction surfaces are usually masked in many cases and become exposed only when activation signals, such as phosphorylation or allosteric effector binding, induce conformational change in either or both of the proteins [41]. We also found that IST1 was remarkably decreased in the brains of AD patients, indicating the involvement of IST1 deficit in the compromised autophagy-lysosomal system in AD. Importantly, overexpressing IST1 attenuated the pathologies and behavioral impairments with decreased insoluble MAPT were shown in human MAPT transgenic mice. Thus, IST1 may represent a promising therapeutic target for AD and other tauopathies.
To explore how MAPT accumulation suppresses IST1 expression, we measured histone acetylation, which is causally linked to the cognitive decline in AD patients [42,43]. We observed that MAPT accumulation inhibited histone-4 acetylation at K12. Further studies showed that MAPT did not change HDAC protein level, while it inhibited HAT. In addition to HAT and HDAC that respectively regulate histone acetylation and deacetylation, a cellular complex termed INHAT also inhibits histone acetylation by binding to the histones and masking their access to HAT [32,44]. We recently reported that MAPT increased ANP32A, an essential subunit of INHAT [30,31]. Here, we further demonstrated that downregulating ANP32A efficiently rescued AcH4K12 and IST1. These data suggest that MAPT accumulation inhibits histone acetylation by direct inhibiting HAT activity and ANP32A-INHAT involved masking of histone acetylation. Additionally, the neurons possess machinery of directing autophagosomes to move along microtubules toward the perinuclear microtubule-organizing center where most abundant lysosomes reside, and microtubule disassembly induces massive buildup of autophagosomes in neuronal processes [19]. Therefore, MAPT accumulation can also impair autolysosome formation by disrupting microtubule dynamics and axonal transport [45].
The hippocampal CA3 subset, with its characteristic recurrent collateral connections at the anatomical level, has been proposed as the key structure for the storage of spatial memory or contextual memory. As a critical intermediate segment of the hippocampal trisynaptic circuit, CA3 receives signals from dentate gyrus through mossy fibers and the CA3 information processing can also modulate activity in CA1 subset. Therefore, it is not surprising to see that knockdown of IST1 in hippocampal CA3 can attenuate the HsMAPT-induced synaptic transmission and memory impairments.
In summary, our current findings have simulated this pathological process: abnormal MAPT accumulation inhibits IST1 expression through CEBPB-ANP32A-INHAT machinery, and loss of IST1 disrupts formation of ESCRT-III complex and thus impedes fusion of autophagosome with lysosome leading to autophagy deficits. This mutually aggravated MAPT accumulation and autophagy deficit forms a vicious cycle (Figure 9), which eventually results in impairments of synapse and cognition as seen in the AD patients. Upregulating IST1 or downregulating ANP32A can break the vicious cycle.
Figure 9.
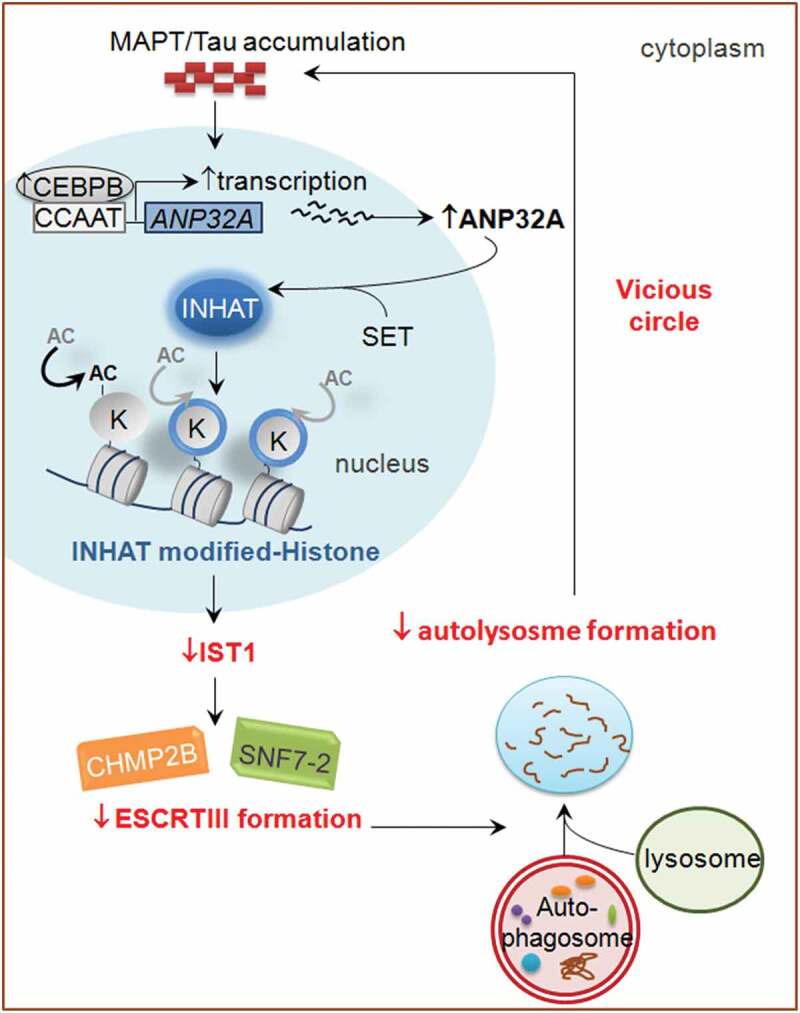
The proposed working model by which MAPT accumulation and autophagy deficit form a vicious cycle. Abnormal MAPT accumulation activates CEBPB (Chai et al., 2017). The activated CEBPB binds to its responsive element (CCAAT box) in the proximal ANP32A promoter region (Chai et al., 2017), and thus stimulates the expression of ANP32A. Then ANP32A interacts with SET to form INHAT, which masks histones for acetylation by HAT (Seo et al., 2001; Chai et al., 2017). Hypo-acetylation of histone inhibits transcription of IST1 expression, and thus disrupts formation of ESCRT-III complex and impedes fusion of autophagosome with lysosome, leading to autophagy deficits and aggravated MAPT accumulation. This vicious cycle will eventually result in synaptic and cognitive impairments.
Materials and methods
Antibodies, plasmids and human tissue samples
Antibodies used in the present study included: polyclonal antibody (pAb) anti-LC3B (Cell Signaling Technology, 3868), monoclonal antibody (mAb) anti-HDAC4 (Cell Signaling Technology, 5392), pAb anti-pS396 (Life Technologies, 11102), pAb anti-pS214 (Signalway, 11109), pAb anti-pS404 (Signalway, 11112), pAb anti-pT231 (Signalway, 11110), mAb anti-tau5 (MAPT/Tau; Abcam, ab80579), mAb anti-SQSTM1/P62 (BD Bioscience, 610,832), pAb anti-IST1 (GeneTex, GTX101972), pAb anti-CHMP2B (Santa Cruz Biotechnology, sc-69351), pAb anti-CHMP4B/SNF7-2 (Santa Cruz Biotechnology, sc-82556), pAb anti-ANP32A (Santa Cruz Biotechnology, sc-100767), pAb anti-CHMP4B (Abcam, ab-135154), pAb anti-H4 (Merck Millipore, 06–866), pAb anti-RFP (Abcam ab34771), mAb anti-HDAC2 (Abcam, ab51832), mAb anti-HDAC5 (Sigma-Aldrich, H4538), mAb TUBA1A/DM1A (Sigma-Aldrich, T9026), Hoechst 33258 (Sigma-Aldrich, B2261), mAb anti-ACTB/actin (Sigma-Aldrich, A3853), mAb anti-HT7 (ThermoFisher Scientific, MN1000), mAb anti-R134d (total MAPT/Tau) was a gift from Drs. Iqbal (NYS Institute for Basic Research, Staten Island, NY, USA).
Plasmid DsRed-C1-LC3 was kindly provided by Dr. Raymond Chuen-chung (University of Hong Kong). Plasmid mCherry-GFP-LC3 was kindly provided by Prof. Xiaohua He (Wuhan University). Human peGFP-C1-MAPT (human MAPT/tau40) and pcDNA-MAPT (human MAPT40, non-EGFP tag) was kindly provided by Prof. Fei Liu (University of Nantong). Adeno-associated virus (AAV) AAV-CMV-eGFP-MAPT (human MAPT/tau40), AAV-CMV-mCherry-IST1 (mCherry sequence is not fused with IST1 sequence) and lentivirus lenti-CMV-eGFP-siIST1 were constructed and packaged by Neuron Biotech (Shanghai, China), plasmids eGFP-N1-IST1, eCFP-N1-IST1 and pCMV-G&NR-RNU6-siIST1 were constructed by Neuron Biotech (Shanghai, China). IST1 truncated plasmids (pcDNA-GFP-IST11-189, pcDNA-GFP-IST164-279, pcDNA-GFP-IST1300-366) were constructed by OBIO Biotech (Shanghai, China). The shRNA oligo sequences for IST1 were as follows: 5ʹ- GATCCCCCATCTGCAAATACGCCTTTTCAAGAGAAAGGCGTATTTGCAGATGGT TTTTGGR −3ʹ, 5ʹ- AGCTCAAAAACCATCTGCAAATACGCCTTTCTCTTGAAAAGGCGTATTTGCAGATGGGG −3ʹ. Lenti-CMV-RFP-LC3 and Lenti-CMV-RFP-siANP32A viruses were constructed by Genechem (Shanghai, China). The ANP32A siRNA sequence is CGGATTTATTTAGAGCTGC. The frozen post-mortem brain samples (cortex) and brain sections from AD cases and the age-matched nondemented controls (Table S1) were from the Emory AD Research Center kindly provided by Dr. K Ye (Department of Neurology, Emory University School of Medicine, USA). Informed consent was obtained from the subjects, and the study was approved by the Biospecimen Committee.
Cell culture and transfection
Human embryonic kidney 293 (HEK293WT) cells or HEK293 with stable expression of wild-type full-length human MAPT (S293MAPT) or the vector (S293vec) were cultured in Dulbecco’s modified eagle’s medium (DMEM; HyClone, SH30022.01) containing 10% fetal bovine serum (Biological Industries, 04–001-1ACS) and 200 mg/mL G418 (ThermoFisher Scientific, 10,131,027), in a humidified atmosphere of 5% CO2 in air at 37°C [46]. The cells were plated onto 6-well plates and the starvation was initiated by replacing with Earle’s balanced salt solution (EBSS; Sigma-Aldrich, E2888), a starvation medium. For primary hippocampal neuron cultures, 18 d embryonic (E18) mouse hippocampi were seeded at 30,000–40,000 cells per well on 6-well plates coated with Poly-D-Lysine/Laminin (Sigma-Aldrich, P7405) in neurobasal medium (ThermoFisher Scientific, 21,103,049) supplemented with 2% B27/0.5 mM glutamine/25 mM glutamate. Half the culture medium was changed every 3 d with neurobasal medium supplemented with 2% B27 (ThermoFisher Scientific, 17,504,044) and 0.5 mM GlutaMAX (ThermoFisher Scientific, 35,050,061). All cultures were kept at 37ºC in a humidified 5% CO2 containing atmosphere. At div 7, the neurons were transfected with lentivirus or adeno-associated virus. The conditioned culture medium was replaced 1/2 volume with fresh feeding media every 3–4 d for cell maintenance until the cells were ready to use for experiments on day-14.
Western blotting and immunohistochemistry
The hippocampi transfected with eGFP-tagged virus were sliced on an ice platform and the CA3 subsets were dissected under a fluorescence microscope. The tissues or cells were homogenized at 4°C using a Teflon glass homogenizer (Glas-Col, 099cs71) in 50 mM Tris-HCl, pH 7.4, 150 mM NaCl, 10 mM NaF, 1 mM Na3VO4, 5 mM EDTA, 2 mM benzamidine (Bjoka-vip, XW020077), and 1 mM phenylmethylsulfonyl fluoride (Sigma-Aldrich, P7626). The extract was mixed with sample buffer (3:1, v/v) containing 200 mM Tris-HCl, pH 7.6, 8% SDS, 40% glycerol, 40 mM dithiothreitol, boiled for 10 min, and then centrifuged at 12,000 × g for 10 min at 25°C. The supernatant was used for western blotting [46]. The proteins were separated by 10% SDS-polyacrylamide gel electrophoresis and transferred to PVDF membranes. The membranes were blocked with 5% nonfat milk dissolved in TBS-Tween-20 (50 mM Tris HCl, pH 7.6, 150 mM NaCl, 0.2% Tween-20 [Sinopharm Chemical Reagent, 31,089,328]) for 1 h and incubated with primary antibodies overnight at 4°C. Finally, the blots were incubated with anti-rabbit (LI-COR, 926–32211) or anti-mouse IgG (LI-COR, 926–32210) conjugated to IRDyeTM (800CW) for 1 h at 37°C and visualized using the Odyssey Infrared Imaging System (Licor biosciences, Lincoln, NE, USA). Immunoreactive bands were quantitatively analyzed by Image-Pro plus 6.0 software (Media Cybernetics, Washington, USA). The protein concentration was estimated by bicinchoninic acid kit (Sigma-Aldrich, BCA-1) according to manufacturer’s instructions.
For immunohistochemical studies, mice were sacrificed and perfused through the aorta with 100 ml 0.9% NaCl followed by 400 ml phosphate buffer containing 4% paraformaldehyde. Brains were removed and postfixed in perfusate overnight and then cut into sections (20 μm) with a vibratome (Leica, Nussloch, Germany; S100, TPI). The sections were collected consecutively in phosphate-buffered saline (PBS; Tian Jin Hao Yang Biological Manufacture, PB2004Y) for immunohistochemistry staining. Free floating sections were blocked with 0.3% H2O2 in absolute methanol for 30 min and nonspecific sites were blocked with bovine serum albumin (Sigma-Aldrich, A1933) for 30 min at room temperature. Then, sections were incubated with primary antibodies overnight at 4°C. After washing with PBS, sections were subsequently incubated with biotin-labeled secondary antibodies for 1 h at 37°C. The immunoreaction was developed using the Histostain TM-SP kit (ThermoFisher Scientific, 95–9473) and visualized with diaminobenzidine tetrachloride system (brown color; Bjoka-vip, XW00562351). For each primary antibody, 3 to 5 consecutive sections from each brain were used. Sections were observed under a microscope (Olympus BX60, Tokyo). For fluorescent staining, the cells were cultured on coverslips and fixed with 4% paraformaldehyde for 1.5 h at 4°C and permeabilized for 10 min at room temperature in PBS containing 0.5% Triton X-100. Cells were blocked with 5% bovine serum albumin for 40 min, and further incubated with primary antibody at 4°C overnight, and then incubated for 1 h at 37°C with Rhodamine Red-X- (Molecular Probes, R6393) or Oregon Green 488-conjugated secondary antibodies (Molecular Probes, O6383). The nuclei were stained with Hoechst 33,258. All fluorescent images were captured and analyzed using the Zeiss LSM510 inverted fluorescence microscope or a Zeiss LSM710 laser-scanning confocal fluorescence microscope (ZEISS, Oberkochen, Germany). Red images of mito-DsRed2 were collected using 543 nm excitation and a 560 nm filter; and green fluorescence images were collected using 488 nm excitation and a 500–550 nm filter with the pinhole set to 1 Airy Unit. Image analysis was performed with Image-Pro Plus 6.0 software.
Quantitative real-time PCR
Total RNA was isolated by using Trizol™ kit (ThermoFisher Scientific, 15,596,018). Reverse transcription and real-time quantitative PCR were carried out according to manufacturer’s instruction (TaKaRa, Dalian, China). Total RNA was reverse transcribed, and the produced cDNA was used to detect the transcripts. The PCR system contains 3 mM MgCl2, 0.5 μM forward and reverse primers, 2 μl SYBR Green PCR master mixes (ThermoFisher Scientific, 4,309,155) and 2 μl cDNA. The samples were assayed on a Rotor Gene 300 Real-time Cycler (Corbett Research, Sydney, Australia). The expression level of the interest gene was normalized by the housekeeping gene GAPDH (glyceraldehyde-3-phosphate dehydrogenase), which was not changed by the treatments. PCR primers employed in the present study are as follow: the primers for IST1/KIAA0174: 5ʹ-GAAGGTGAAGGTCGGAGTC-3ʹ (forward) and 5ʹ-GAAGATGGTGATGGGATTTC-3ʹ (reverse). GAPDH forward primer 5ʹ-GGAGCGAGATCCCTCCAAAAT-3ʹ and reverse primer 5ʹ-GGCTGTTGTCATACTTCTCATGG-3ʹ. Hdac1 forward primer 5ʹ- TGCGTGGAAAGAAAACAACC −3ʹ and reverse primer 5ʹ- ACCCAGACCCCTCCTAAATG −3ʹ. Hdac2 forward primer 5ʹ- GGGACAGGCTTGGTTGTTTC-3ʹ and reverse primer 5ʹ- GAGCATCAGCAATGGCAAGT-3ʹ. Hdac4 forward primer 5ʹ- CAATCCCACAGTCTCCGTGT −3ʹ and reverse primer 5ʹ- CAGCACCCCACTAAGGTTCA −3ʹ. Hdac5 forward primer 5ʹ- TGTCACCGCCAGATGTTTTG −3ʹ and reverse primer 5ʹ- CAGCACCCCACTAAGGTTCA −3ʹ. Hdac7 forward primer 5ʹ- GGTGGACCCCCTTTCAGAAG −3ʹ and reverse primer 5ʹ- TGGGTAGCCAGGAGTCTGGA −3ʹ. Hdac9 forward primer 5ʹ- CCGAGAATATCAGAAAGTCTGTCA −3ʹ and reverse primer 5ʹ- TGGCAAATAGATTCTCTCCTGAA −3ʹ. ATG3 forward primer 5ʹ-GACCCCGGTCCTCAAGGAA-3ʹ and reverse primer 5ʹ-TGTAGCCCATTGCCATGTTGG-3ʹ.
Immunoprecipitation
Proteins were extracted on ice using radio immunoprecipitation assay (RIPA) buffer (Beyotime, P0013B) containing 50 mM Tris-HCl, pH 7.5, 150 mM NaCl, 0.1% (v:v) Trixon X-100 (Beyotime, ST795), 0.5% (w:v) sodium deoxycholate (Sinopharm Chemical Reagent, 69,022,781), 0.1% (w:v) SDS, 1 mM EDTA, 50 mM N-ethylmaleimide, 1 mM NaF, 1 mM Na3VO4, and 1 μg/ml each of protinin (Sigma-Aldrich, 516,485), leupeptin (Sigma-Aldrich, L2884), pepstatin (Sigma-Aldrich, P8340), and 1 mM phenylmethane sulfonyl fluoride (ThermoFisher Scientific, 36,978). Protein G agarose (Merck Millipore, 16–266) was centrifuged at 6,000 × g for 30 s at 4°C and removed the supernatant. The agarose beads were washed 2 times with PBS buffer, centrifuged and resuspended with PBS in a 1:1 (w:w) ratio (prepared protein G). The prepared protein G was added into the extracts (1 µg/µl protein) and rotated at 4°C for 1 h to avoid nonspecific binding. After centrifuged at 4°C, the supernatants were incubated with antibodies with rotating at 4°C overnight. And then, the prepared protein G was added and incubated with rotating at 4°C for another 2 h. The mixed solution was centrifuged 6,000 × g for 30 s at 4°C and then the agarose beads were collected. After washing with precooled washing buffer (PBS, protease inhibitors, 0.5% Nonidet P-40 [Sigma-Aldrich, 74,385], and 0.1% Triton X-100) for 5 times, and centrifuged for 1 min at 5,000 × g after each wash, the agarose beads were collected and resuspended in 2 × SDS-PAGE loading buffer, boiled for 5 min and centrifuged. The supernatant was analyzed by western blotting.
Extraction of soluble and insoluble MAPT
Soluble and insoluble MAPT fractions were isolated from virus infected hippocampal tissue by a modified procedure. Hippocampal tissues where virus injected were homogenized in RIPA buffer (Beyotime, P0013B) with protease inhibitor mixture on ice. The homogenates were centrifuged at 13,000 × g for 20 min at 4°C, and the supernatants as RIPA fraction were collected, which designated as soluble MAPT fraction. The pellet was further homogenized twice and spun (13,000 × g, 4°C for 20 min) prior to resuspension, and incubated with agitation in 1:1 (w:v) 70% formic acid at 4°C overnight. The formic acid suspension was spun (18,000 × g, 4°C for 20 min) and the supernatant collected. After evaporation of the formic acid, the precipitates were dissolved in 2 × SDS-PAGE sample buffer (insoluble MAPT fraction).
Animals and stereotaxic surgery
Male C57BL/6 mice were supplied by the Experimental Animal Central of Wuhan University. Human MAPT transgenic mice (HsMAPT, STOCK Mapttm1(EGFP) Klt Tg(MAPT)8cPdav/J) were purchased from The Jackson Laboratory (Bar Harbor, Maine, USA). All mice were kept at 24 ± 2ºC on daily 12 h light-dark cycles with ad libitum access to food and water. Mice were anesthetized and placed in a stereotaxic apparatus for bilateral injection (2.0 μl) of purified virus into the hippocampal CA3 region (−2.2 mm posterior, ±2.5 lateral, −2.2 ventral). By using a microinjection system (World Precision Instruments Inc.), lenti-CMV-eGFP-siIST1 (5 × 10⁸ TU/ml), AAV-CMV-mCherry-IST1 (2 × 10¹² viral genomes/ml), AAV-CMV-GFP-HsMAPT (3.65 × 10¹² viral genomes/ml) or lenti-CMV-RFP-siANP32A (5 × 10⁸ TU/ml) was injected at a rate of 0.1 μl/min. The needle syringe was left in place for ~3 min before being withdrawn. The in vivo transfection efficiency was measured by direct fluorescence imaging, immunohistochemical staining and western blotting after virus injection for 1 month. The injection did not significantly increase the death rate or change the normal activity of the mice compared with the non-injected controls. All animal experiments were performed according to the ‘Policies on the Use of Animals and Humans in Neuroscience Research’ revised and approved by the Society for Neuroscience in 1995, and the Guidelines for the Care and Use of Laboratory Animals of the Ministry of Science and Technology of the People’s Republic of China, and the Institutional Animal Care and Use Committee in Tongji Medical College, Huazhong University of Science and Technology approved the study protocol.
Morris water maze (MWM)
The MWM test was conducted to assess the spatial learning and memory [47]. The maze was divided into 4 quadrants with a platform placed in one quadrant. The maze was filled with water and mice were trained to find the hidden platform for 6 consecutive days, and underwent 4 training trials (once per quadrant) per day with a 30-s interval from 14:00 to 20:00 pm. In each training trial, mice were placed into the water from a semi random set of start locations in each quadrant and faced the pool wall and ended when the animal climbed on the platform. If mice failed to locate the platform within 60 s, they were gently guided onto the platform and stayed for 30 s; the escape latency was recorded as 60 s. Spatial memory was tested 1 d after the last training and the platform was removed. The longer a mouse stayed in the previous platform-located quadrant, the better it scored the spatial memory. A video camera, fixed to the ceiling 1.5 m from the water surface, was used to record the swimming path and the time used to find the platform (latency) or passed through the previous platform-located quadrant each day. The camera was connected to a digital-tracking device attached to an IBM computer (Armonk, NY).
Electrophysiological recordings
Animals were anesthetized using ketamine and xylazine (Sigma-Aldrich, X1126). Hippocampal slices (350 μm) were sectioned using Leica VT1000S vibratome (Leica, Germany) while continuously perfused with ice-cold oxygenated artificial cerebrospinal fluid (aCSF) containing (in mM): 124 NaCl, 3.0 KCl, 2.0 CaCl2, 1.0 MgCl2, 1.25 Na2PO4, 26 NaHCO3, 10 glucose, saturated with 95% O2, 5% CO2 (pH 7.4). Then, slices were incubated at 32°C for 30 min, and allowed to equilibrate to room temperature for more than 30 min. For recording the long-term potentiation (LTP), the slice was placed in a chamber with an 8 × 8 microelectrodes array and kept flat in aCSF.
Synaptic responses were evoked with 0.2 ms pulses delivered through MED64 on mossy fibers, recorded extracellularly in CA3 stratum radiatum and quantified as the initial slope of the field potential. Baseline responses were recorded by using a stimulation intensity that evoked a half-maximal response, defined as the maximal response without a population spike (pop-spike). High-frequency tetanus consisted of 3 100 Hz epochs (1s) were delivered. LTP magnitude was calculated as the average (normalized to baseline) of the responses recorded 50–60 min after conditioning stimulation. All the signals were recorded by using the MED64 System (Alpha MED Sciences, Panasonic, Japan) [48,49].
Golgi staining and spine analyses
Golgi staining was performed by using a FD Rapid GolgiStain Kit (FD Neurotechnology, PK401) according to the manufacturer’s instructions. Briefly, the animals were sacrificed and perfused for 5 min with PBS, followed by 4% PFA in PBS for 15 min. All procedures were performed under dark condition. Brains were dissected out and immersed in impregnation solution (equal volumes of Solutions A and B, containing mercuric chloride, potassium dichromate, and potassium chromate), and stored at room temperature. Impregnation solution was replaced after 4 h. After 2 weeks, brains were transferred to Solution C and stored at 4°C for 48 h, with the solution replaced after 4 h. The brain was sectioned sagittally (100 μm) using a vibrate microtome (VT 1000 s, Leica, Nussloch, Germany) and sections were mounted on gelatin-coated microscope slides with Solution C. Slides were rinsed twice in distilled water (2 min each), and then placed in a mixture of Solution D:E:distilled water (1:1:2) for 10 min. After rinsing with distilled water, sections were dehydrated in 50%, 75%, 95% and 100% ethanol for 4 times (4 min each). Sections were cleared in xylene (Sinopharm Chemical Reagent, 10,023,418) 3 times (4 min each) and coverslipped with Permount solution (Daigger Scientific, EF15969A). The spine morphology was analyzed according to a previously reported method [50]. For brain slice spine analysis, 2 dendritic segments at a distance of 90–110 μm (proximal) and 190–210 μm (distal) from the soma were imaged under bright-field illumination on a Zeiss Axioimager microscope with a 63× oil immersion objective. The spine numbers from 10 μm of dendrite length per neuron were calculated by using Image-Pro Plus 6.0, and 5 to 7 neurons per mouse (3 mice per group) were used for statistical analyses. For in vitro spine analysis, lenti-GFP-siIST1 or lenti-GFP-siC was transfected to primary cultured hippocampal neurons at div 12, and the fluorescent images were acquired at div 18 with a confocal microscope (LSM 710, ZEISS, Oberkochen, Germany). The spine numbers from 10 μm of dendrite length per neuron (5 to 7 neurons per group) were analyzed by using Neuron Studio. The spine density was expressed as mean ± SEM, and all imaging data were analyzed using the double-blind method.
Transmission electron microscopy
Mice were perfused with precooled PBS, pH 7.4, followed by PBS containing 4% paraformaldehyde and 0.25% glutaraldehyde after anesthetization. The brains were removed and kept overnight in 2% paraformaldehyde and 2.5% glutaraldehyde in 0.1 M PBS, pH 7.4. The next day, brains were cut with a vibratome into 50-mm thick slices. The hippocampal CA3 regions were selected and processed by postfixation in 1% osmium tetroxide for 1 h, dehydrated in graded ethanol, and embedded in epoxy resin. Polymerization was performed at 80°C for 24 h. Blocks were cut on a Reichert ultramicrotome into ultrathin sections (60–70 nm), which were poststained with uranyl acetate and lead citrate, and viewed under a Hitachi 7100 electron microscopy (Nikon, Tokyo, Japan). For quantitative analysis of the autophagosome numbers, 3 mice per group and 10 fields per mouse were examined. Primarily cultured neurons were transfected with adeno-associated virus. At div 14, neurons were collected by centrifugation (80 × g, 10 min) and then fixed with 3% glutaraldehyde, followed by 1% osmium tetroxide. The cells were then suspended in 2% molten agar and subsequently passed through a series of ethanol dehydration steps. The dehydrated agar blocks were suspended in propylene oxide for 20 min at 4°C, followed by treatment with a 1:1 mixture of propylene oxide (Sigma-Aldrich, 540,021) and araldite (Sigma-Aldrich, 10,951) for 1 h at 60°C. The resin blocks were carefully trimmed to expose the underlying agar blocks. Sections of various thicknesses (200, 300, and 500 nm) were cut using a Leica Ultracut UCT (Leica, Germany) microtome and transferred to 300-mesh copper grids. A 10% alcohol solution of uranyl acetate was prepared and centrifuged to remove any precipitate. The sections on copper grids were stained for 1 h with uranyl acetate in the dark at room temperature, washed thoroughly with distilled water and viewed under electron microscopy (JEM-1230, JEOL, Tokyo, Japan).
Chromatin immunoprecipitation (ChIP) assay
The samples were used the ChIP technique with EZ CHIP Kit (Merck Millipore, 17–371) to follow up the manufacturer’s instruction. The hippocampus of human MAPT transgenic mice and its littermate control was removed and homogenized on ice, the DNA and protein were cross-linked with vacuum infiltrating 1% formaldehyde at room temperature for 10 min. The cross-linking reaction was stopped by adding glycine to a final concentration of 0.125 M and incubating for 5 min at room temperature. After 200 × g centrifuge at 4°C for 10 min, the pellets were washed by cold PBS for 2 times and resuspended in buffer (20 mM HEPES, pH 7.9, 25% glycerol, 420 mM NaCl, 1.5 mM MgCl2, 0.2 mM EDTA, protease inhibitors [Sigma-Aldrich, P8340]), incubated on ice for 20 min and centrifuged. The pellet (nucleus) was resuspended in breaking buffer (50 mM Tris-HCl, pH 8.0, 1 mM EDTA, 150 mM NaCl, 1% SDS, 2% Triton X-100, protease inhibitors) and sonicated for 5 ~ 10 s to achieve an average fragment size of approximately 0.8–1.5 kb. Any remaining cellular debris was removed by centrifugation. The chromatin solution was then diluted 10-fold with ChIP dilution buffer (1% Triton X-100, 1.2 mM EDTA, 16.7 mM Tris-HCl, pH 8.0, 167 mM NaCl) and precleared by incubating protein A-agarose beads (Sigma-Aldrich, P9424); 50% suspension in ChIP dilution buffer) for 1 h at 4°C. An aliquot, which was not treated with antibody, was reserved as the input, and the remainder was divided for immunoprecipitating with the control mouse IgG (Merck Milipore, 17–371) or acetylated H4K8 (Abcam, ab45166) antibody overnight at 4°C. The modified histone-DNA complexes were then extracted by incubating 50% protein A-agarose beads with the chromatin-antibody solution for 1 h at 4°C. After several washes, the immunocomplexes were eluted twice from the beads using 250 μl of elution buffer (1% SDS, 0.1 M NaHCO3). The samples were reverse-crosslinked at 65°C overnight and then treated with proteinase K (Sigma-Aldrich, 03115879001) to remove all proteins. DNA was purified by phenol-chloroform extraction and recovered by ethanol precipitation. Precipitated DNA was resuspended in TE buffer and used for PCR analysis to detect the amount of IST1 promoter DNA. Primers 5ʹ- ATCAAGCCAATGTCTCAC −3ʹ (forward) and 5ʹ- AAGCCTTTCTTTACCCTA −3ʹ (reverse) were designed around the promoter regions of IST1.
Avoidance step-down test
The step-down apparatus is a brightly illuminated box and 3 side walls in black plexiglass; the floor consists of a grid of caliber bronze. One extremity site of the grid is covered by an elevated rubber platform. Intermittent electric shocks (20 mA, 50 Hz) were delivered to the grid floor by an isolated stimulator. Prior to start of the experiment, mice stayed in the box for 3 min to adapt to the environment before experiments. On the training session, each mouse was gently placed onto the platform and the timing was started. Immediately upon stepping down from the platform and placing all its paws on the grid floor, the mouse received an intermittent electric shock for 3 s. Responsiveness to the punishment in the training test was assessed by the animal’s vocalization, only those mice that vocalized touching the grid with the 4 paws were used for the retention test in order to exclude the mice with a different pain threshold. On the test session, usually 2 h (short-term memory, STM) or 24 h (long-term memory, LTM) later after training, mice were placed back again on the platform. The first time spent before stepping down onto the grid (latency period) was measured, considering 300 s as the upper cut-off, during the training and retention tests.
EGFR (epidermal growth factor receptor) degradation assay
EGFR degradation assay was performed by following a previous study [51]. In brief, HEK293WT cells were transfected with pCMV-G&NR-RNU6-siIST1 for 48 h, or the primary cultured hippocampal neurons were transfected with lenti-CMV-eGFP-siIST1. Then the cells were serum starved in the presence of cycloheximide (1 μg/ml; MedChemExpress, HY-12320) for 1 h and treated with EGF (0.1 μM for HEK293 cells, 0.5 μM for neurons) in the presence of cycloheximide for the indicated times. After washing with ice-cold PBS, the cells were rapidly lysed with Laemmli sample buffer, resolved on SDS-polyacrylamide gel electrophoresis gels and immunoblotted for EGFR.
In vitro binding assay of IST1 with CHMP2B and CHMP4B
The purified GST-tagged IST1, flag-tagged CHMP2B, and his-tagged CHMP4B/SNF7-2, which were provided by Novoprotein Biotech (Shanghai, China), were incubated in PBS buffer for 1 h at 37°C. And then, the protein mixture was incubated with anti-GST antibody (abcam, ab111947) with rotating at 4°C overnight, the prepared protein G was added and incubated with rotating at 4°C for another 2 h. After centrifugation, the proteins bound to beads were washed with ice-cold PBS, mixed with 2 × SDS sample buffer. The binding of IST1 to CHMP2B or CHMP4B was examined by western blotting using anti-GST, anti-flag (abcam, ab18230) or anti-his antibody (abcam, ab9108).
Statistical analysis
All data were collected and analyzed in a blinded manner. Data were expressed as mean ± SD or mean ± SEM and analyzed using SPSS 12.0 statistical software (SPSS Inc. Chicago, IL, USA). Statistical analysis was performed using Student’s t-test (two-group comparison), two-way ANOVA or two-way repeated measures ANOVA followed by Bonferroni’s post hoc test. The level of significance was set at p < 0.05.
Funding Statement
This work was supported in parts by Natural Science Foundation of China [81870846, 81471303, 31730035, 91632305, 81822044 and 81721005]; Ministry of Science and Technology of China [2016YFC1305801]; and Sanming Project of Medicine in Shenzhen [SZSM201611090].
Disclosure statement
No potential conflict of interest was reported by the authors.
Supplementary material
Supplemental data for this article can be accessed here.
References
- [1].Braak H, Braak E.. Neuropathological stageing of Alzheimer-related changes. Acta Neuropathol. 1991;82:239–259. [DOI] [PubMed] [Google Scholar]
- [2].Braak H, Alafuzoff I, Arzberger T, et al. Staging of Alzheimer disease-associated neurofibrillary pathology using paraffin sections and immunocytochemistry. Acta Neuropathol. 2006;112(4):389–404. [DOI] [PMC free article] [PubMed] [Google Scholar]
- [3].Alonso AC, Zaidi T, Grundke-Iqbal I, et al. Role of abnormally phosphorylated tau in the breakdown of microtubules in Alzheimer disease. Proc Natl Acad Sci U S A. 1994;91(12):5562–5566. [DOI] [PMC free article] [PubMed] [Google Scholar]
- [4].Wang JZ, Grundke-Iqbal I, Iqbal K. Glycosylation of microtubule-associated protein tau: an abnormal posttranslational modification in Alzheimer’s disease. Nat Med. 1996;2(8):871–875. [DOI] [PubMed] [Google Scholar]
- [5].Luo HB, Xia YY, Shu XJ, et al. SUMOylation at K340 inhibits tau degradation through deregulating its phosphorylation and ubiquitination. Proc Natl Acad Sci U S A. 2014;111:16586–16591. [DOI] [PMC free article] [PubMed] [Google Scholar]
- [6].Liu YH, Wei W, Yin J, et al. Proteasome inhibition increases tau accumulation independent of phosphorylation. Neurobiol Aging. 2009;30:1949–1961. [DOI] [PubMed] [Google Scholar]
- [7].Inoue K, Rispoli J, Kaphzan H, et al. Macroautophagy deficiency mediates age-dependent neurodegeneration through a phospho-tau pathway. Mol Neurodegener. 2012;7:48. [DOI] [PMC free article] [PubMed] [Google Scholar]
- [8].Majumder S, Richardson A, Strong R, et al. Inducing autophagy by rapamycin before, but not after, the formation of plaques and tangles ameliorates cognitive deficits. PloS One. 2011;6:e25416. [DOI] [PMC free article] [PubMed] [Google Scholar]
- [9].Schaeffer V, Goedert M. Stimulation of autophagy is neuroprotective in a mouse model of human tauopathy. Autophagy. 2012;8:1686–1687. [DOI] [PMC free article] [PubMed] [Google Scholar]
- [10].Congdon EE, Wu JW, Myeku N, et al. Methylthioninium chloride (methylene blue) induces autophagy and attenuates tauopathy in vitro and in vivo. Autophagy. 2012;8:609–622. [DOI] [PMC free article] [PubMed] [Google Scholar]
- [11].Nixon RA, Wegiel J, Kumar A, et al. Extensive involvement of autophagy in Alzheimer disease: an immuno-electron microscopy study. J Neuropathol Exp Neurol. 2005;64:113–122. [DOI] [PubMed] [Google Scholar]
- [12].Boland B, Kumar A, Lee S, et al. Autophagy induction and autophagosome clearance in neurons: relationship to autophagic pathology in Alzheimer’s disease. J Neurosci. 2008;28:6926–6937. [DOI] [PMC free article] [PubMed] [Google Scholar]
- [13].Yin Y, Gao D, Wang Y, et al. Tau accumulation induces synaptic impairment and memory deficit by calcineurin-mediated inactivation of nuclear CaMKIV/CREB signaling. Proc Natl Acad Sci U S A. 2016;113:E3773–E3781. [DOI] [PMC free article] [PubMed] [Google Scholar]
- [14].Hu Y, Li XC, Wang ZH, et al. Tau accumulation impairs mitophagy via increasing mitochondrial membrane potential and reducing mitochondrial Parkin. Oncotarget. 2016;7:17356–17368. [DOI] [PMC free article] [PubMed] [Google Scholar]
- [15].Li XC, Hu Y, Wang ZH, et al. Human wild-type full-length tau accumulation disrupts mitochondrial dynamics and the functions via increasing mitofusins. Sci Rep. 2016;6:24756. [DOI] [PMC free article] [PubMed] [Google Scholar]
- [16].Hebron ML, Algarzae NK, Lonskaya I, et al. Fractalkine signaling and Tau hyper-phosphorylation are associated with autophagic alterations in lentiviral Tau and Abeta1-42 gene transfer models. Exp Neurol. 2014;251:127–138. [DOI] [PMC free article] [PubMed] [Google Scholar]
- [17].Lin WL, Lewis J, Yen SH, et al. Ultrastructural neuronal pathology in transgenic mice expressing mutant (P301L) human tau. J Neurocytol. 2003;32:1091–1105. [DOI] [PubMed] [Google Scholar]
- [18].Mizushima N, Levine B, Cuervo AM, et al. Autophagy fights disease through cellular self-digestion. Nature. 2008;451:1069–1075. [DOI] [PMC free article] [PubMed] [Google Scholar]
- [19].Nixon RA. The role of autophagy in neurodegenerative disease. Nat Med. 2013;19:983–997. [DOI] [PubMed] [Google Scholar]
- [20].Schmidt O, Teis D. The ESCRT machinery. Curr Biol. 2012;22(4):R116–R120. [DOI] [PMC free article] [PubMed] [Google Scholar]
- [21].Guo EZ, Xu Z. Distinct mechanisms of recognizing endosomal sorting complex required for transport III (ESCRT-III) protein IST1 by different microtubule interacting and trafficking (MIT) domains. J Biol Chem. 2015;290:8396–8408. [DOI] [PMC free article] [PubMed] [Google Scholar]
- [22].Raiborg C, Stenmark H. The ESCRT machinery in endosomal sorting of ubiquitylated membrane proteins. Nature. 2009;458:445–452. [DOI] [PubMed] [Google Scholar]
- [23].Lee JA, Beigneux A, Ahmad ST, et al. ESCRT-III dysfunction causes autophagosome accumulation and neurodegeneration. Curr Biol. 2007;17:1561–1567. [DOI] [PubMed] [Google Scholar]
- [24].Rusten TE, Vaccari T, Lindmo K, et al. ESCRTs and Fab1 regulate distinct steps of autophagy. Curr Biol. 2007;17:1817–1825. [DOI] [PubMed] [Google Scholar]
- [25].Schaeffer V, Lavenir I, Ozcelik S, et al. Stimulation of autophagy reduces neurodegeneration in a mouse model of human tauopathy. Brain. 2012;135(Pt 7):2169–2177. [DOI] [PMC free article] [PubMed] [Google Scholar]
- [26].Pyo JO, Nah J, Jung YK. Molecules and their functions in autophagy. Exp Mol Med. 2012;44:73–80. [DOI] [PMC free article] [PubMed] [Google Scholar]
- [27].Agromayor M, Carlton JG, Phelan JP, et al. Essential role of hIST1 in cytokinesis. Mol Biol Cell. 2009;20(5):1374–1387. [DOI] [PMC free article] [PubMed] [Google Scholar]
- [28].Agalioti T, Chen G, Thanos D. Deciphering the transcriptional histone acetylation code for a human gene. Cell. 2002;111:381–392. [DOI] [PubMed] [Google Scholar]
- [29].Wang Z, Zang C, Rosenfeld JA, et al. Combinatorial patterns of histone acetylations and methylations in the human genome. Nat Genet. 2008;40:897–903. [DOI] [PMC free article] [PubMed] [Google Scholar]
- [30].Chai GS, Feng Q, Wang ZH, et al. Downregulating ANP32A rescues synapse and memory loss via chromatin remodeling in Alzheimer model. Mol Neurodegener. 2017;12(1):34. [DOI] [PMC free article] [PubMed] [Google Scholar]
- [31].Feng Q, Chai GS, Wang ZH, et al. Knockdown of pp32 increases histone acetylation and ameliorates cognitive deficits. Front Aging Neurosci. 2017;9:104. eCollection 2017. [DOI] [PMC free article] [PubMed] [Google Scholar]
- [32].Seo SB, Macfarlan T, McNamara P, et al. Regulation of histone acetylation and transcription by nuclear protein pp32, a subunit of the INHAT complex. J Biol Chem. 2002;277:14005–14010. [DOI] [PubMed] [Google Scholar]
- [33].Hamano T, Gendron TF, Causevic E, et al. Autophagic-lysosomal perturbation enhances tau aggregation in transfectants with induced wild-type tau expression. Eur J Neurosci. 2008;27:1119–1130. [DOI] [PubMed] [Google Scholar]
- [34].Ling D, Song HJ, Garza D, et al. Abeta42-induced neurodegeneration via an age-dependent autophagic-lysosomal injury in Drosophila. PloS One. 2009;4:e4201. [DOI] [PMC free article] [PubMed] [Google Scholar]
- [35].Rusten TE, Simonsen A. ESCRT functions in autophagy and associated disease. Cell Cycle. 2008;7:1166–1172. [DOI] [PubMed] [Google Scholar]
- [36].Skibinski G, Parkinson NJ, Brown JM, et al. Mutations in the endosomal ESCRTIII-complex subunit CHMP2B in frontotemporal dementia. Nat Genet. 2005;37:806–808. [DOI] [PubMed] [Google Scholar]
- [37].McCullough J, Clippinger AK, Talledge N, et al. Structure and membrane remodeling activity of ESCRT-III helical polymers. Science. 2015;350(6267):1548–1551. [DOI] [PMC free article] [PubMed] [Google Scholar]
- [38].Urwin H, Authier A, Nielsen JE, et al. Disruption of endocytic trafficking in frontotemporal dementia with CHMP2B mutations. Hum Mol Genet. 2010;19(11):2228–2238. [DOI] [PMC free article] [PubMed] [Google Scholar]
- [39].Bajorek M, Morita E, Skalicky JJ, et al. Biochemical analyses of human IST1 and its function in cytokinesis. Mol Biol Cell. 2009;20:1360–1373. [DOI] [PMC free article] [PubMed] [Google Scholar]
- [40].Legrain P, Wojcik J, Gauthier JM. Protein–protein interaction maps: a lead towards cellular functions. Trends Genet. 2001;17:346–352. [DOI] [PubMed] [Google Scholar]
- [41].Ito T, Chiba T, Ozawa R, et al. A comprehensive two-hybrid analysis to explore the yeast protein interactome. Proc Natl Acad Sci U S A. 2001;98:4569–4574. [DOI] [PMC free article] [PubMed] [Google Scholar]
- [42].Peleg S, Sananbenesi F, Zovoilis A, et al. Altered histone acetylation is associated with age-dependent memory impairment in mice. Science. 2010;328:753–756. [DOI] [PubMed] [Google Scholar]
- [43].Graff J, Rei D, Guan JS, et al. An epigenetic blockade of cognitive functions in the neurodegenerating brain. Nature. 2012;483:222–226. [DOI] [PMC free article] [PubMed] [Google Scholar]
- [44].Seo SB, McNamara P, Heo S, et al. Regulation of histone acetylation and transcription by INHAT, a human cellular complex containing the set oncoprotein. Cell. 2001;104:119–130. [DOI] [PubMed] [Google Scholar]
- [45].Ambegaokar SS, Jackson GR. The downward spiral of tau and autolysosomes: a new hypothesis in neurodegeneration. Autophagy. 2012;8:1144–1145. [DOI] [PMC free article] [PubMed] [Google Scholar]
- [46].Liu GP, Zhang Y, Yao XQ, et al. Activation of glycogen synthase kinase-3 inhibits protein phosphatase-2A and the underlying mechanisms. Neurobiol Aging. 2008;29:1348–1358. [DOI] [PubMed] [Google Scholar]
- [47].Morris RG, Garrud P, Rawlins JN, et al. Place navigation impaired in rats with hippocampal lesions. Nature. 1982;297:681–683. [DOI] [PubMed] [Google Scholar]
- [48].Fernandes HB, Riordan S, Nomura T, et al. Epac2 mediates cAMP-dependent potentiation of neurotransmission in the hippocampus. J Neurosci. 2015;35(16):6544–6553. [DOI] [PMC free article] [PubMed] [Google Scholar]
- [49].Wang H, Ardiles AO, Yang S, et al. Metabotropic glutamate receptors induce a form of LTP controlled by translation and arc signaling in the hippocampus. J Neurosci. 2016;36(5):1723–1729. [DOI] [PMC free article] [PubMed] [Google Scholar]
- [50].Oomen CA, Soeters H, Audureau N, et al. Early maternal deprivation affects dentate gyrus structure and emotional learning in adult female rats. Psychopharmacology (Berl). 2011;214(1):249–260. [DOI] [PMC free article] [PubMed] [Google Scholar]
- [51].Bakowska JC, Jupille H, Fatheddin P, et al. Troyer syndrome protein spartin is mono-ubiquitinated and functions in EGF receptor trafficking. Mol Biol Cell. 2007;18:1683–1692. [DOI] [PMC free article] [PubMed] [Google Scholar]
Associated Data
This section collects any data citations, data availability statements, or supplementary materials included in this article.