SUMMARY
Radial glial progenitors (RGPs) represent the major neural progenitors for generating neurons and glia in the developing mammalian cerebral cortex 1-3. They position their centrosomes away from the nucleus at the ventricular zone surface 4-7. However, the molecular basis and precise function of this highly unique and characteristic subcellular organization of the centrosome remain largely unknown. Here we show that apical membrane anchoring of the centrosome controls the mechanical properties of mouse cortical RGPs and consequently their mitotic behaviour and cortical size and formation. Mother centriole in RGPs specifically develops distal appendages to anchor to the apical membrane. Selective removal of Centrosomal protein 83 (CEP83) eliminates mother centriole distal appendages and disrupts centrosome apical membrane anchorage, resulting in microtubule disorganization and apical membrane stretching and stiffening. It activates mechanically-sensitive Yes-associated protein (YAP) and promotes excessive RGP proliferation and subsequent intermediate progenitor overproduction, leading to the formation of an enlarged cortex with abnormal folding. Simultaneous elimination of YAP suppresses cortical enlargement and folding caused by CEP83 removal. Together, these results uncover a previously unknown role of the centrosome in regulating the mechanical features of neural progenitors, and the size and configuration of the mammalian cerebral cortex.
A prominent and unique feature of RGPs is their subcellular organization of the centrosome 6,7, an organelle that functions as both the microtubule-organizing centre and the basal body for ciliogenesis in vertebrates 9-12. Distinct from a typical mammalian cell that harbours the centrosome next to the nucleus, RGPs position their centrosomes away from the nucleus in the apical endfoot at the VZ surface 4-7. While the nucleus of an RGP exhibits interkinetic movement within the VZ as it proceeds through the cell cycle, the centrosome remains located at the VZ surface 4,5,13. Moreover, individual centrosomes at the VZ surface in interphase RGPs support the formation of a primary cilium that projects into the lateral ventricle 14-17. While the centrosome has been shown to regulate RGP division and cortical neurogenesis 4,18, the molecular and cellular basis, and precise function of centrosome positioning at the VZ surface remains largely unclear.
Centrosome membrane anchor via DAPs
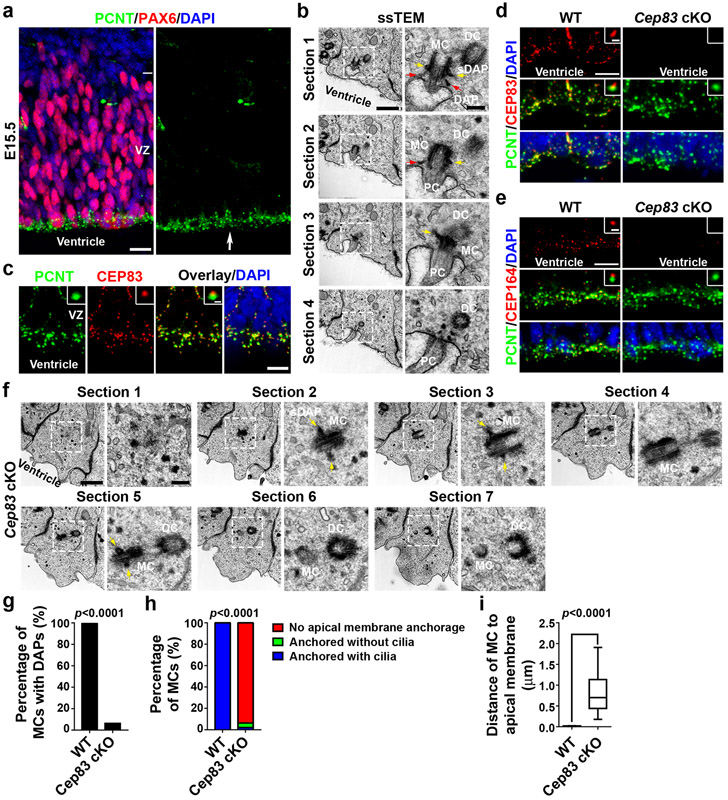
As shown previously 4-7, the centrosome of mouse embryonic cortical RGPs labelled by an antibody against PERICENTRIN (PCNT, green) was preferentially located at the VZ surface (arrow) and away from the nuclei labelled by an antibody against PAX6 (red), a transcription factor highly expressed in cortical RGPs 19,20 (Fig. 1a). To further assess the subcellular organization, we performed serial section transmission electron microscopy (ssTEM) (Fig. 1b). The mother centriole (MC) possessed prominent distal appendages (DAPs, red arrows) and subdistal appendages (sDAPs, yellow arrows), whereas the daughter centriole (DC) lacked the appendages. Moreover, DAPs were in direct contact with a membrane pocket, indicating the anchoring of the MC to the apical membrane. In addition, the MC was sitting at the base of a primary cilium emanating from the membrane pocket, consistent with the function of the MC as the basal body in supporting primary ciliogenesis. Together, these results show that the centrosomes of interphase cortical RGPs are anchored to the apical membrane via DAPs preferentially assembled at the MC.
Fig. 1: Cep83 deletion disrupts DAPs and centrosome membrane anchorage.
(a) Representative images of E15.5 cortex stained for PAX6 (red) and PCNT (green), and with DAPI (blue) (n = 5). Scale bar: 25 μm. (b) Representative ssTEM images of E15.5 cortical VZ surface. Scale bars: 800 nm and 200 nm. (c) Representative images of E15.5 cortex stained for PCNT (green) and CEP83 (red), and with DAPI (blue) (n = 3). Scale bars: 10 μm and 1 μm. (d) Representative images of E15.5 WT and Cep83 cKO VZ surface stained for PCNT (green) and CEP83 (red), and with DAPI (blue). Scale bars: 10 μm and 1 μm. (e) Representative images of E15.5 WT and Cep83 cKO VZ stained for PCNT (green) and CEP164 (red), and with DAPI (blue) (n = 3). Scale bars: 10 μm and 1 μm. (f) Representative ssTEM images of E15.5 Cep83 cKO VZ surface. Scale bars: 800 nm and 200 nm. (g-i) Quantification of the percentage of MCs with DAPs (g), with primary cilia and/or membrane anchorage (h), or the distance of MC to the apical membrane (i) (WT, n = 11 centrosomes; cKO, n = 48 centrosomes). Data are represented as a box-whisker plot. Statistical analysis: Chi-square (g, h) or two-sided Mann-Whitney-Wilcoxon (i) test.
Cep83 deletion impairs centrosome anchoring
To reveal the molecular control of centrosome apical membrane anchorage, we examined the expression of CEP83 (also called CCDC41), a protein recently identified to be at the root of the DAP assembly pathway in mammalian cell cultures 21,22. CEP83 exhibited a punctate expression pattern (red) and was localized to one end of the centrosome (green) at the VZ surface (Fig. 1c). These results suggest that CEP83 is expressed and localized at the centrosomes of cortical RGPs, and may support DAP assembly and centrosome apical membrane anchoring.
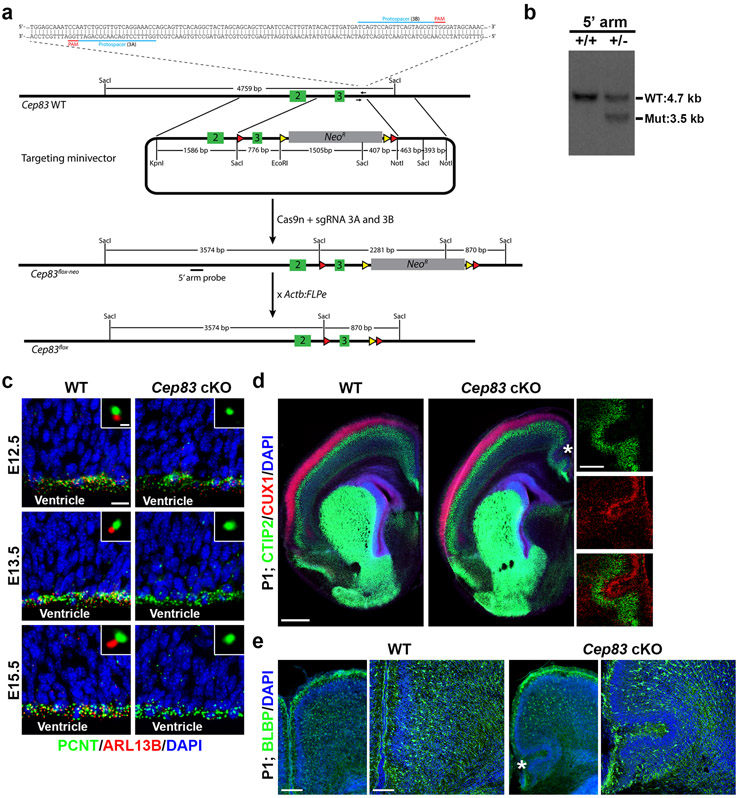
To test this, we engineered a conditional Cep83 mutant mouse allele, Cep83fl/fl, using Clustered Regularly Interspaced Short Palindromic Repeats (CRISPR)/Cas9-mediated double nicking strategy 23 (Extended Data Fig. 1a, b). We then crossed the Cep83fl/fl mouse with the Emx1-Cre mouse, in which Cre recombinase is selectively expressed in cortical RGPs with strong activity by embryonic day (E) 10.5 24. While CEP83 was abundantly expressed at RGP centrosomes at the VZ surface in the wild type (WT) cortex, it was depleted in the Emx1-Cre;Cep83fl/fl conditional knockout (referred to as Cep83 cKO hereafter) cortex at E15.5 (Fig. 1d). The expression of CEP164, a characteristic DAP marker 25, was also lost (Fig. 1e), suggesting a defect in DAP assembly.
We next performed ssTEM analysis of the Cep83 cKO cortex (Fig. 1f). While individual pairs of centrioles were observed with a similar frequency at the VZ surface, the MC possessed sDAPs (yellow arrows) but not DAPs (Fig. 1f, g). Moreover, the MC were not anchored to the apical membrane and no primary cilium was observed (Fig. 1f, h and Extended Data Fig. 1c). Consequently, the MC and centrosome exhibited a small but significant (0.79 ± 0.44 μm) dislocation away from the apical membrane (Fig. 1f, i). Together, these results demonstrate that removal of CEP83 in RGPs disrupts DAP assembly and impairs centrosome anchorage to the apical membrane as well as primary ciliogenesis.
Cep83 deletion causes cortical defects
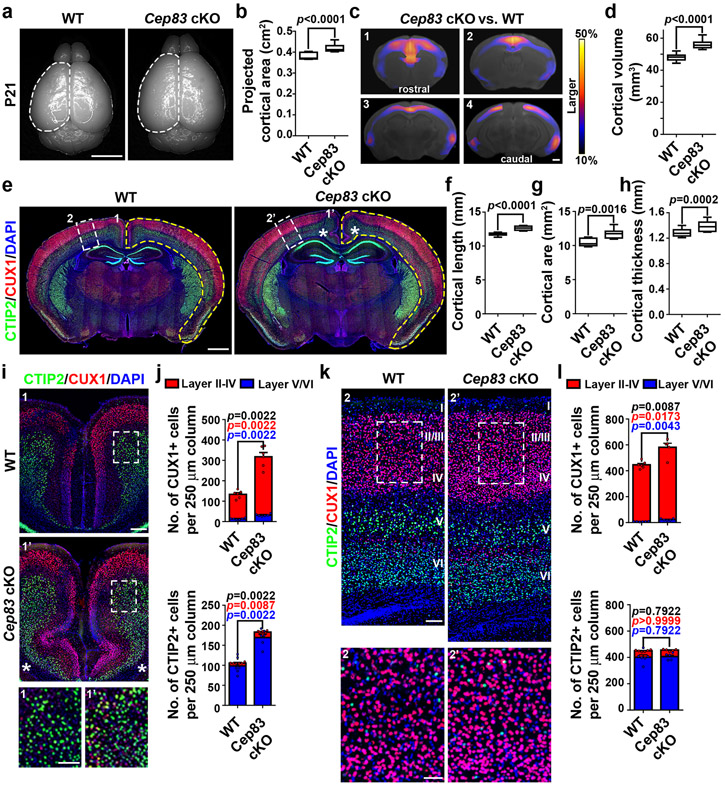
Cep83 cKO mice were born at the expected frequency and survived to adulthood. Remarkably, the brain of Cep83 cKO mice appeared significantly larger than that of WT littermate control mice at postnatal day (P) 21 (Fig. 2a, b). Magnetic resonance imaging (MRI) analyses showed that the cortex was substantially enlarged, especially in the mediodorsal region (Fig. 2c, d).
Fig. 2: Centrosome apical membrane detachment leads to an enlarged cortex with abnormal folding.
(a) Representative whole mount images of P21 WT and Cep83 cKO brains. Scale bar: 0.5 cm. (b) Quantification of the projected cortical area (WT, n = 13 brains; cKO, n = 11 brains). (c) MRI images of P21 WT and Cep83 cKO brains along the rostrocaudal axis (1-4). Warmer colours indicate larger difference. FDR < 5%. Scale bar: 1 mm. (d) Quantification of P21 WT and Cep83 cKO cortical volumes (N = 7 brains/14 hemispheres for each genotype). (e) Representative images of P21 WT and Cep83 cKO brain sections stained for CTIP2 (green) and CUX1 (red), and with DAPI (blue). Yellow broken outlines delineate the total cortical area. Asterisks indicate the abnormal cortical folding in the medial region (1 and 1’) shown in i. White broken rectangles indicate a dorsal region (2 and 2’) shown in k. Scale bar: 1 mm. (f-h) Quantification of the cortical lengths (f), areas (g), and thicknesses (h) (WT, n = 8 brains/16 hemispheres; cKO, n = 9 brains/18 hemispheres). (i, k) Representative images of the medial (i) or dorsal (k) region of P21 WT and Cep83 cKO cortices stained for CTIP2 (green) and CUX1 (red), and with DAPI (blue). Scale bars: 200 μm and 100 μm. (j, l) Quantification of the numbers of CUX1+ (top) and CTIP2+ (bottom) neurons per 250 μm column in the medial (j) or dorsal (l) region (WT, n = 6 brains; cKO, n = 5 brains). Statistical significance of the differences in the number of total (black), superficial (red), or deep (blue) layer neurons are shown. Bar charts: mean + SEM; Statistical analysis: two-sided Mann-Whitney-Wilcoxon test.
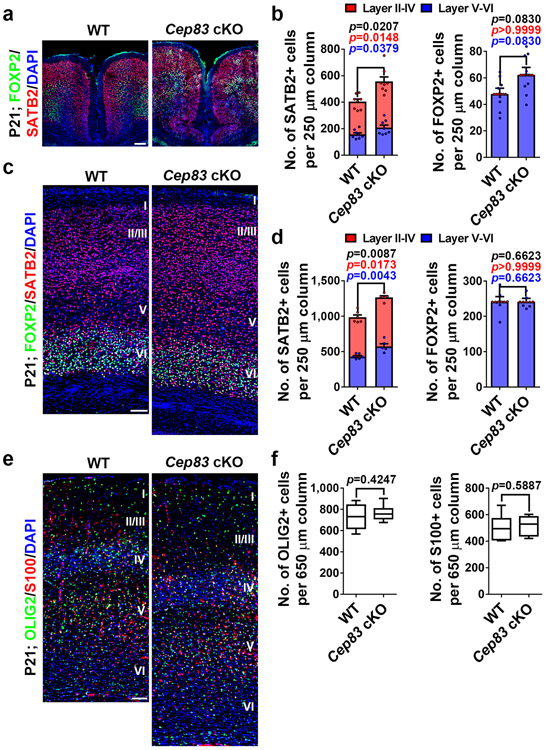
The enlarged cortex indicates abnormalities in neuronal production. To examine this, we stained P21 brain sections with antibodies against CTIP2 (green), a layer V/VI neuronal marker, and CUX1 (red), a layer II-IV neuronal maker 26 (Fig. 2e). Indeed, we observed a significant increase in the overall length, thickness, and area of the cortex (Fig. 2f-h). . In the medial region exhibiting the most prominent brain volume increase (1 and 1’), the densities of both CTIP2+ and CUX1+ neurons were drastically increased (Fig. 2i, j). Strikingly, we observed consistent folding in this region that was never seen in the WT cortex (Fig. 2e, i, asterisks and Extended Data Fig. 1d, e, asterisk). In the dorsolateral region (2 and 2’), the density of CUX1+ neurons was significantly increased, whereas the density of CTIP2+ neurons was comparable (Fig. 2k, l). Similar results were obtained with antibodies against FOXP2 (green), a layer VI neuronal marker, and SATB2 (red), a pan-neuronal marker enriched in superficial layers 26 (Extended Data Fig. 2a-d). The densities of glial cells did not exhibit any obvious change (Extended Data Fig. 2e, f).
Even though the density of deep layer neurons or glial cells in the dorsolateral region did not significantly change, the increase in the total length, thickness, and area of the Cep83 cKO cortex indicated that the overall production of deep layer neurons and glial cells was also significantly enhanced. No obvious hydrocephalus was observed (Fig. 2e). Together, these results suggest that CEP83 removal in RGPs leads to a loss of DAPs, centrosome dislocalization from the apical membrane, and an enlarged cortex with excessive numbers of superficial as well as deep layer neurons and glial cells, and abnormal folding in the medial region.
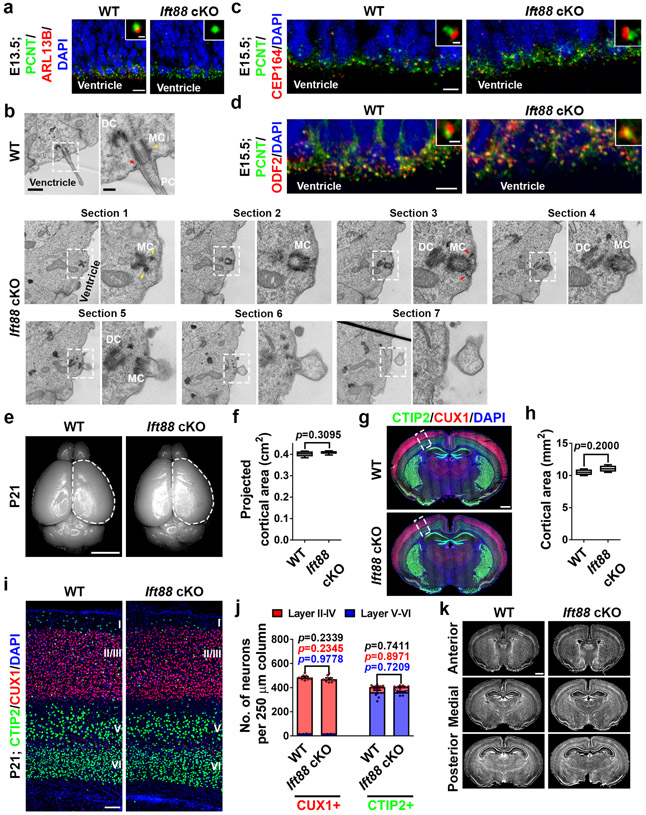
Previous studies suggest that primary cilia are crucial for early patterning and polarity specification of the cortical primordium, but not essential to subsequent cortical neurogenesis and formation 14,18,27-30. To further assess the role of primary cilia in cortical RGPs, we crossed the conditional intraflagellar transport 88 (Ift88) mutant mouse, Ift88fl/fl, with the Emx1-Cre mouse to selectively remove IFT88, a member of the IFT-B complex required for proper cilium formation and function 31. As expected, IFT88 removal resulted in a loss of RGP primary cilia by E13.5 (Extended Data Fig. 3a, b). We observed no obvious defect in DAPs, sDAPs, or MC membrane anchoring (Extended Data Fig. 3b-d), or cortical size or neuronal density (Extended Data Fig. 3e-k). These results provide further proof that primary cilia loss in RGPs after ~E11 does not alter cortical neurogenesis or formation.
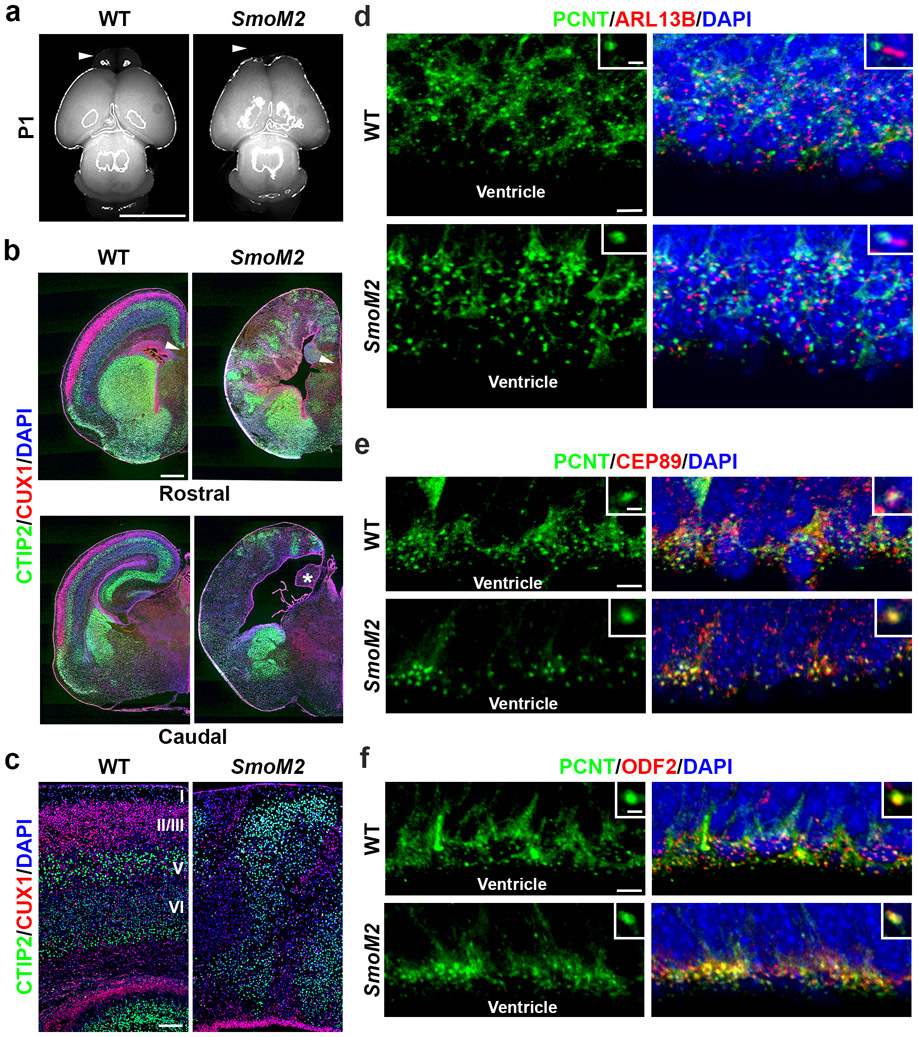
A recent study suggested that elevated Sonic hedgehog (SHH) signalling in the developing cortex by the expression of a constitutively active form of Smoothened (SmoM2), an activator of SHH signalling independent of ligand binding, enlarges the cortex and induces folding 32. To further assess the role of SHH signalling in cortical RGPs, we crossed the SmoM2 transgenic mouse, R26SmoM2/+33, with the Emx1-Cre mouse (Extended Data Fig. 4). Emx1-Cre;R26SmoM2/+ mutant (SmoM2) mice died at the neonatal stage with severe brain dysplasia. In addition to the loss of the olfactory bulb, the cortex was highly disorganized with no clear laminar organization. Together, these results suggest that elevated SHH signalling in RGPs does not necessarily lead to an enlarged cortex with folding.
Cep83 deletion promotes RGP proliferation
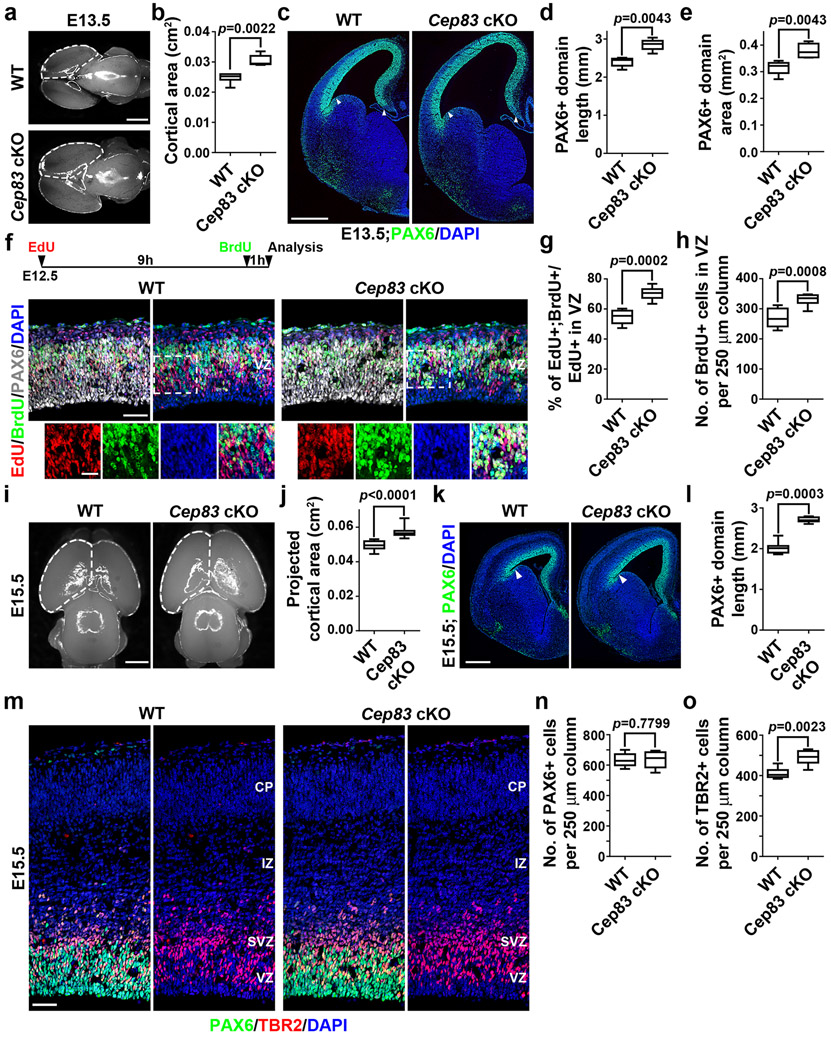
To pinpoint the origins of enhanced neurogenesis and cortical enlargement in the Cep83 cKO cortex, we examined RGP behaviour at the embryonic stage. At E13.5, the Cep83 cKO cortex was significantly larger than the WT cortex (Fig. 3a, b). The total length and area of the PAX6+ RGP domain were greatly increased (Fig. 3c-e), even though the density of PAX6+ RGPs did not significantly differ (Extended Data Fig. 5a, b). These results suggest that CEP83 removal in RGPs leads to a drastic increase in the total RGP number and consequently a lateral expansion of the developing cortex.
Fig. 3: Centrosome apical membrane detachment leads to excessive RGP proliferation and additional increase in IP production.
(a) Representative whole mount images of E13.5 WT and Cep83 cKO brains. Scale bar: 1 mm. (b) Quantification of the projected cortical area (WT, n = 6 brains; cKO, n = 5 brains). (c) Representative images of E13.5 WT and Cep83 cKO cortices stained for PAX6 (green) and with DAPI (blue). Arrows indicate the boundaries of the PAX6+ domain. Scale bar: 0.5 mm. (d, e) Quantification of PAX6+ domain length (d) and area (e) (WT, n = 5 brains; cKO, n = 6 brains). (f) Representative images of E12.5 WT and Cep83 cKO cortices (dorsolateral region) subjected to EdU (red) and BrdU (green) sequential pulse chase labelling (top inset), stained for PAX6 (white) and with DAPI (blue). Scale bars: 50 μm and 25 μm. (g, h) Quantification of the percentage of EdU+;BrdU+ cells among the total EdU+ cells in the VZ (g) and the number of BrdU+ cells in the VZ per 250 μm column (h) (WT, n = 8 brains; cKO, n = 8 brains). (i) Representative whole mount images of E15.5 WT and Cep83 cKO brains. Scale bar: 1 mm. (j) Quantification of the projected cortical area (WT, n = 32 brains; cKO, n = 9 brains). (k) Representative images of E15.5 WT and Cep83 cKO brain sections stained for PAX6 (green) and with DAPI (blue). Scale bar: 0.5 mm. (l) Quantification of the PAX6+ domain length (WT, n = 8 brains; cKO, n = 7 brains). (m) Representative images of E15.5 WT and Cep83 cKO cortices (dorsolateral region) stained for PAX6 (green) and TRB2 (red), and with DAPI (blue). CP, cortical plate; IZ, intermediate zone; SVZ, subventricular zone. Scale bar: 50 μm. (n, o) Quantification of the number of PAX6+ (n) and TBR2+ (o) cells per 250 μm column (WT, n = 8 brains; cKO, n = 6 brains). Statistical analysis: two-sided Mann-Whitney-Wilcoxon test.
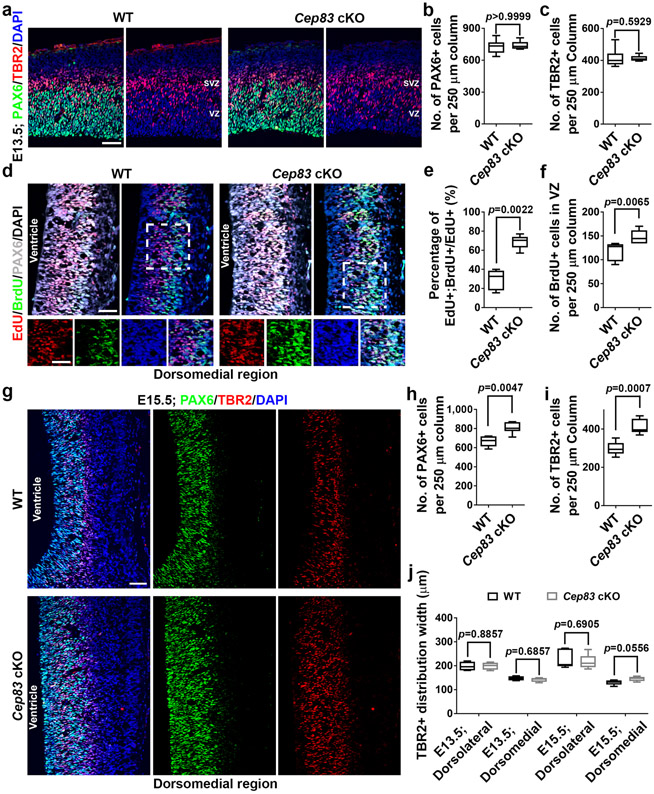
RGPs divide at the VZ surface to produce neurons or intermediate progenitors (IPs) 19,34,35. We thus stained brain sections with an antibody against TBR2 (red), a T-box transcription factor highly expressed in IPs 19, and found that the density of TBR2+ IPs in the Cep83 cKO cortex was comparable to that in the WT cortex (Extended Data Fig. 5a, c), indicating that CEP83 removal in RGPs does not lead to an additional increase in IP production at E13.5, even though the overall generation of IPs would be enhanced due to RGP expansion.
The drastic increase in RGPs upon CEP83 removal likely arises from enhanced RGP proliferation. To test this, we performed sequential pulse-chase experiments (Fig. 3f and Extended Data Fig. 5d-f). We administered a single dose of 5-ethynyl-2´-deoxyuridine (EdU), a modified nucleoside, at E12.5 followed by a single dose of 5-bromo-2´-deoxyuridine (BrdU), a thymidine analog, and collected the brains one hour later for analyses. We found that the percentage of EdU+ RGPs in the VZ that were BrdU+ was substantially increased in the Cep83 cKO cortex compared with the WT cortex (Fig. 3f, g and Extended Data Fig. 5d, e), suggesting that dividing RGPs in the Cep83 cKO cortex re-enter the cell cycle faster than those in the WT cortex. The acceleration of RGP cell cycle progression was corroborated by an increased density of BrdU+ RGPs (Fig. 3f, h and Extended Data Fig. 5d, f). Collectively, these results suggest that CEP83 removal in RGPs accelerates cell cycle re-entry, which leads to an increase in RGP production and a lateral expansion of the developing cortex at the early embryonic stage of cortical development.
Cep83 deletion enhances IP production
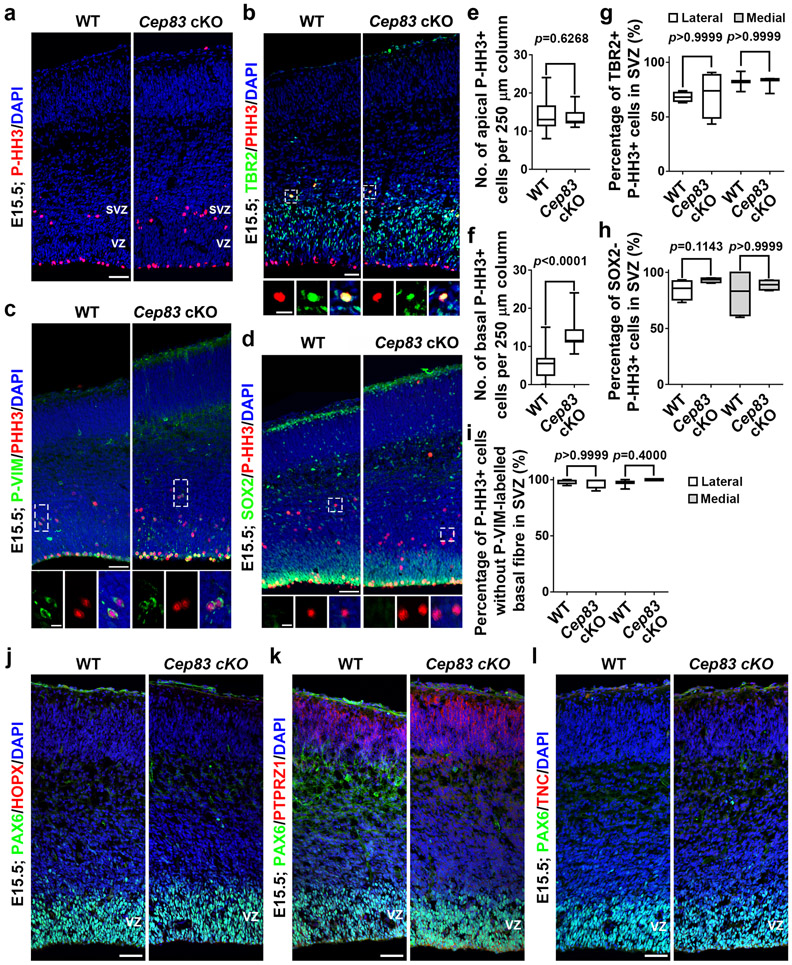
To further dissect the cellular basis, we examined cortical progenitor behaviour at E15.5 (Fig. 3i-o). The Cep83 cKO cortex remained significantly larger than the WT cortex (Fig. 3i, j). The length and area of the PAX6+ RGP domain were significantly increased (Fig. 3k, l). While the density of PAX6+ RGPs in the VZ was comparable (Fig. 3m, n), the density of TBR2+ IPs in the SVZ was significantly increased (Fig. 3m, o). These results suggest that CEP83 removal in RGPs leads to a subsequent increase in IP production at the late embryonic stage of cortical development. Consistently, we observed a substantial increase in mitotic cells labelled by phosphorylated histone H3 (P-HH3) in the SVZ, but not at the VZ surface (Extended Data Fig. 6a, e, f). The P-HH3+ cells in the SVZ of the Cep83 cKO cortex were predominantly IPs, but not outer subventricular zone RGPs (also called basal or intermediate RGPs) 36-40 (Extended Data Fig. 6b, c, d, g-l). Notably, the densities of PAX6+ RGPs in the VZ as well as TBR2+ IPs in the SVZ were significantly increased in the dorsomedial region (Extended Data Fig. 5g-j), where folding repeatedly occurred, consistent with the more drastic increase in neuronal densities in this region (Fig. 2i, j).
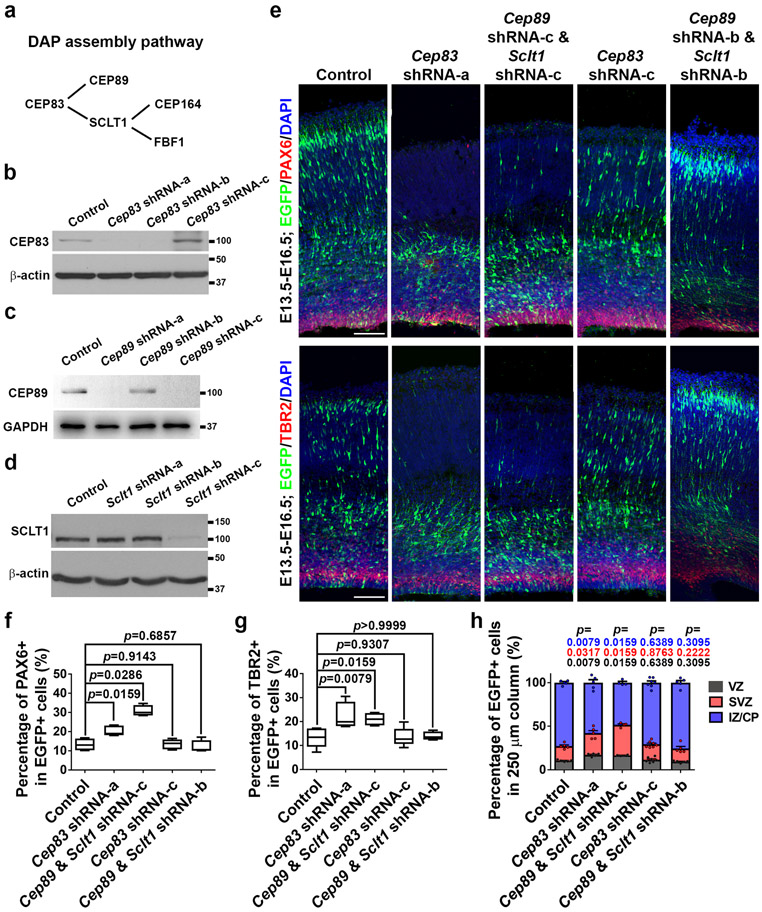
To test whether other DAP assembly components regulate RGP behaviour and cortical development, we engineered short hairpin RNAs (shRNAs) against Cep89 and Sclt1, two parallel downstream components of Cep83 (Extended Data Fig. 7a-d). Suppression of CEP89 and SCLT1 expression led to a significant increase in both PAX6+ RGPs and TBR2+ IPs (Extended Data Fig. 7e-h), suggesting that removal of other DAP assembly components causes similar excessive production of RGPs and IPs in the developing cortex.
Disruption of apical MT organization
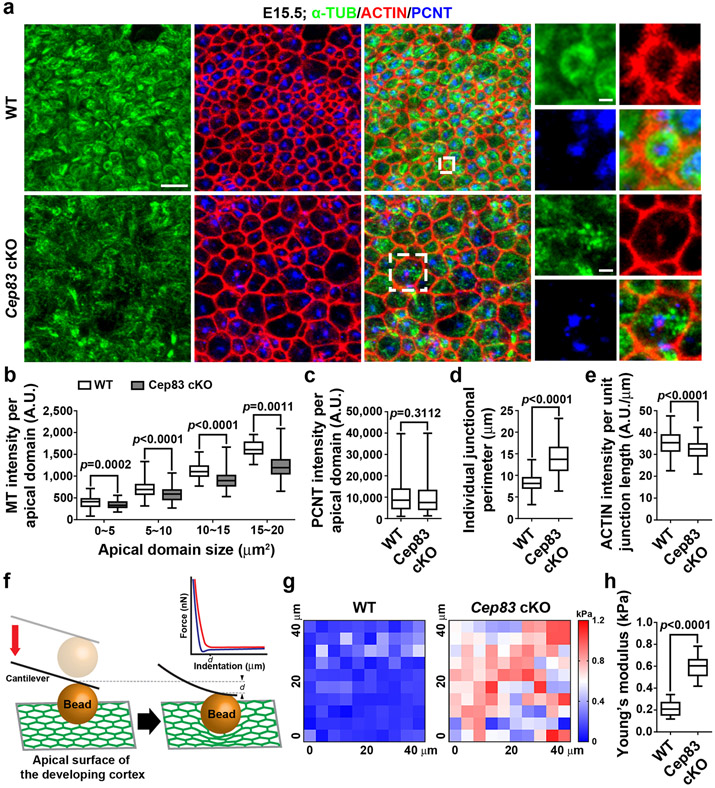
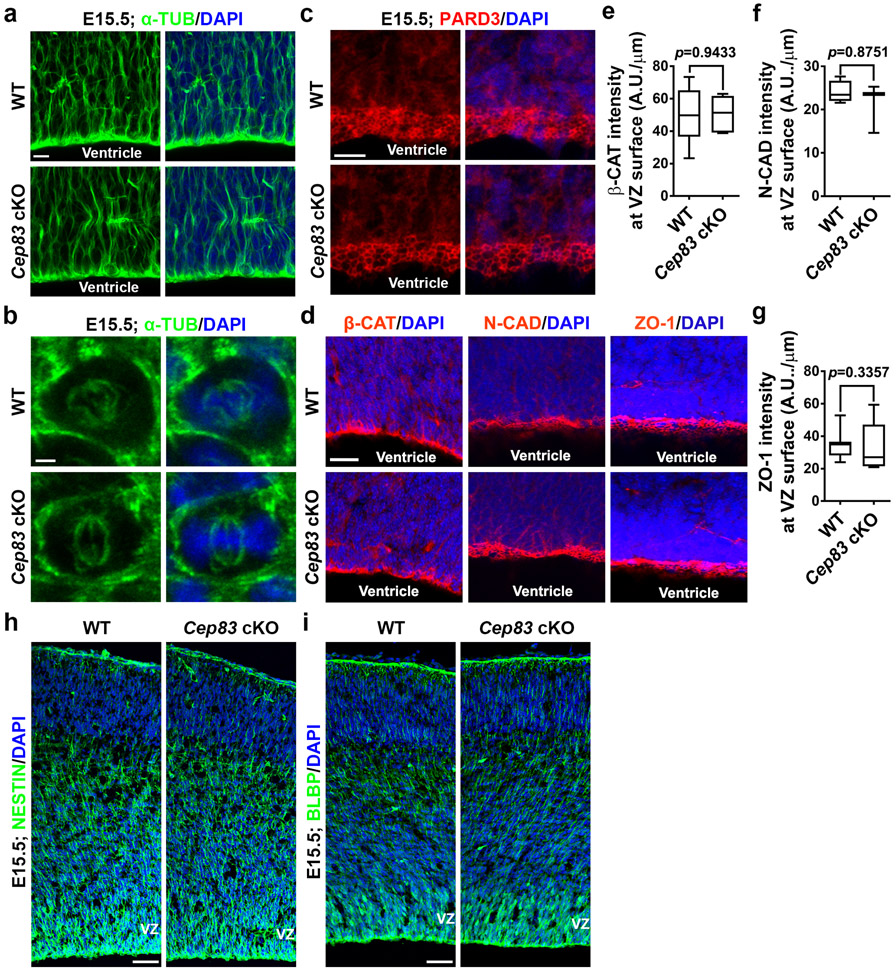
To further reveal the underlying mechanisms, we examined the properties of the apical membrane (i.e., the VZ surface), to which the centrosome is normally anchored. We prepared whole-amount cortical slabs at E15.5, stained with antibodies against PCNT, α-TUBULIN (α-TUB), and ACTIN, and acquired en face images of the apical membrane (Fig. 4a). In the WT cortex, ACTIN marked cell junctions (red) formed between the apical endfeet of neighbouring RGPs and a prominent centrosome revealed by PCNT staining (blue) was commonly found within individual apical endfeet (Fig. 4a, top). Interestingly, microtubules (MTs) labelled by α-TUB staining (green) often formed a ring-like structure in juxtaposition with ACTIN-labelled junctions (Fig. 4a, top, insets). Notably, in the Cep83 cKO cortex, while the junctions and centrosome positioning inside the apical endfeet remained largely intact, the ring-like MT structure disappeared (Fig. 4a, bottom, insets). Fibrous MTs were consistently observed. The intensity of MTs in individual apical domains was significantly reduced (Fig. 4b), whereas the intensity of PCNT was similar (Fig. 4c). The normal expression of PCNT and the existence of fibrous MTs indicate that MT formation is not systematically compromised in the absence of CEP83. Consistent with this, the non-apical membrane MTs, as well as MTs in mitotic RGPs, did not exhibit any obvious difference (Extended Data Fig. 8a, b ). No obvious change in RGP polarity, junction protein expression, or radial scaffolding (Extended Data Fig. 8c-i) was observed. Together, these results suggest that centrosome detachment impairs MT organization specifically at the apical membrane.
Fig. 4: Centrosome detachment disrupts microtubule organization and results in apical membrane stretching and stiffening.
(a) Representative en face images of E15.5 WT and Cep83 cKO VZ surface stained for α-TUB (green), ACTIN (red), and PCNT (blue). Scale bars: 5 μm, 1 μm, and 2 μm. (b-e) Quantification of the intensity of MT (b) or PCNT (c) per apical domain, individual junctional perimeter (d), and the intensity of ACTIN per unit junctional length (e). A.U., arbitrary unit. WT, n = 478 (b), 361 (c), and 200(d, e) apical domains from 4 embryos; cKO, n = 443 (b), 258 (c), and 200 (d, e) apical domains from 4 embryos. (f) Schematic diagram illustrating the use of AFM to probe apical membrane stiffness. The indentation of the cantilever probe generates force-distance curves, including the approach curve (red) and the retraction curve (blue). d, indentation depth. (g) Representative heat maps of Young’s modulus reflecting the stiffness of E15.5 WT and Cep83 cKO VZ surfaces. kPa, kilopascal. (h) Quantification of Young’s Modulus of WT and Cep83 cKO VZ surfaces (WT, n = 10 sample areas; cKO, n= 9 sample areas; from 3 brains for each genotype). Statistical analysis: two-sided Mann-Whitney-Wilcoxon test.
Alteration of apical membrane property
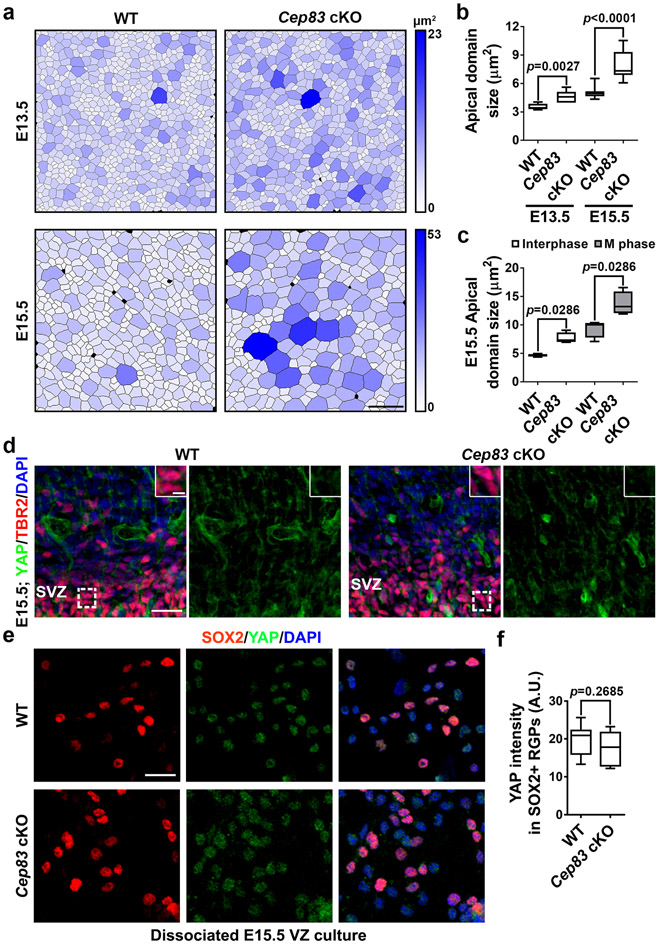
The junction size corresponding to the apical membrane of individual RGPs at the VZ surface appeared enlarged in the Cep83 cKO cortex (Fig. 4a). To confirm this, we systematically examined junction size at E13.5 and E15.5 by staining for ACTIN, and found that the junction size of both interphase and mitotic RGPs were significantly larger (Fig. 4d and Extended Data Fig. 9a-c), suggesting that the apical membrane of RGPs as well as the junction between RGPs is stretched and enlarged in the Cep83 cKO cortex. Coinciding with this, the intensity of ACTIN per unit junction length was significantly reduced (Fig. 4e).
The stretching and enlargement of RGP apical membrane and junctions raises the intriguing possibility that the mechanical property of the VZ surface is altered. To directly test this, we took advantage of atomic force microscopy (AFM), which allows a quantitative examination of the stiffness of live tissue (Fig. 4f). We prepared acute whole-mount WT and Cep83 cKO cortical slabs and performed AFM analysis. Interestingly, the Young’s modulus (also known as the elastic modulus) of the apical membrane was significantly higher in the Cep83 cKO cortex than in the WT cortex (Fig. 4g, h). These results suggest that centrosome membrane detachment increases the stiffness of the apical membrane, where RGP division selectively occurs.
Cortical defects depends on YAP
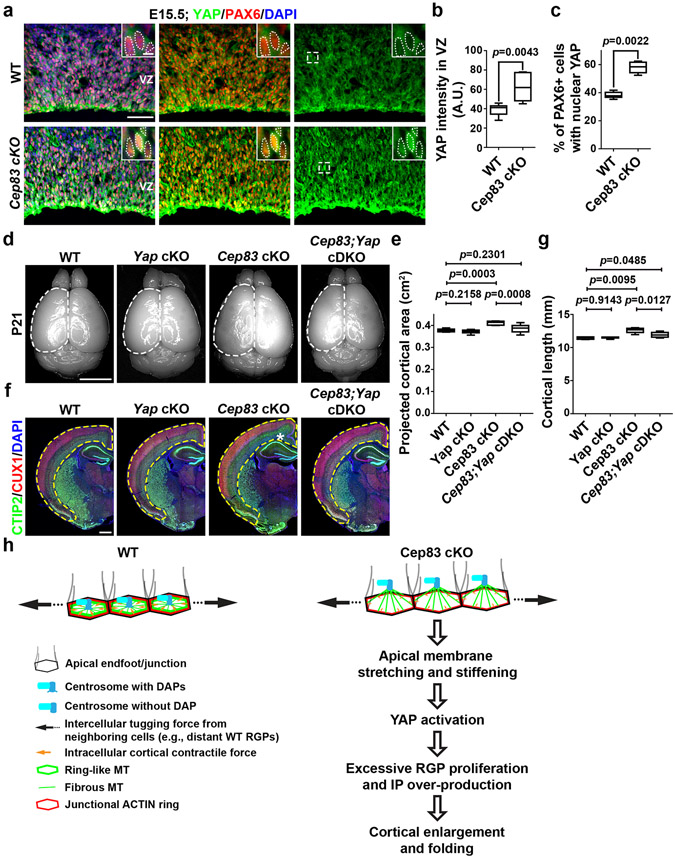
Cell stretching and increased tissue rigidity activates YAP, a crucial transcriptional co-activator in the HIPPO signalling pathway that regulates cell proliferation and organ size 41,42. Indeed, YAP expression in the VZ of the Cep83 cKO cortex was significantly higher than that in the WT cortex (Fig. 5a, b). Moreover, significantly more PAX6+ RGPs possessed strong nuclear YAP (Fig. 5a, c). Notably, YAP expression in the WT RGP nucleus was generally low. Nuclear expression of YAP in TBR2+ IPs in the WT or Cep83 cKO cortex was also low (Extended Data Fig. 9d). In addition, we observed no obvious difference in YAP expression between dissociated WT and Cep83 cKO RGPs in culture with no junction formation (Extended Data Fig. 9e, f). Together, these results suggest that centrosome detachment and apical membrane stretching and stiffening causes excessive YAP expression and nuclear localization in RGPs selectively.
Fig. 5: Excessive YAP activation is essential for cortical enlargement and abnormal folding.
(a) Representative images of E15.5 WT and Cep83 cKO cortices stained for YAP (green) and PAX6 (red), and with DAPI (blue). Scale bars: 50 μm and 5 μm. (b, c) Quantification of YAP intensity (b) and the percentage of PAX6+ cells with nuclear YAP (c) in the VZ (n = 6 brains for each genotype). (d) Represenative whole mount images of P21 WT, Yap cKO, Cep83 cKO, and Cep83;Yap cDKO brains. Scale bar: 0.5 cm. (e) Quantification of the projected cortical area (WT, n = 8 brains; Yap cKO, n = 6 brains; Cep83 cKO, n = 7 brains; Cep83;Yap cDKO, n = 12 brains). (f) Representative images of P21 WT and Cep83 cKO brain sections stained for CTIP2 (green) and CUX1 (red), and with DAPI (blue). Scale bar: 1 mm. (g) Quantification of p21 WT, Yap cKO, Cep83 cKO, and Cep83;Yap cDKO cortical length (WT, n = 4 brains; Yap cKO, n = 6 brains; Cep83 cKO, n = 6 brains; Cep83;Yap cDKO, n = 8 brains). (h) A model diagram indicating the positioning and function of the centrosome in cortical RGPs. Statistical analysis: two-sided Mann-Whitney-Wilcoxon test.
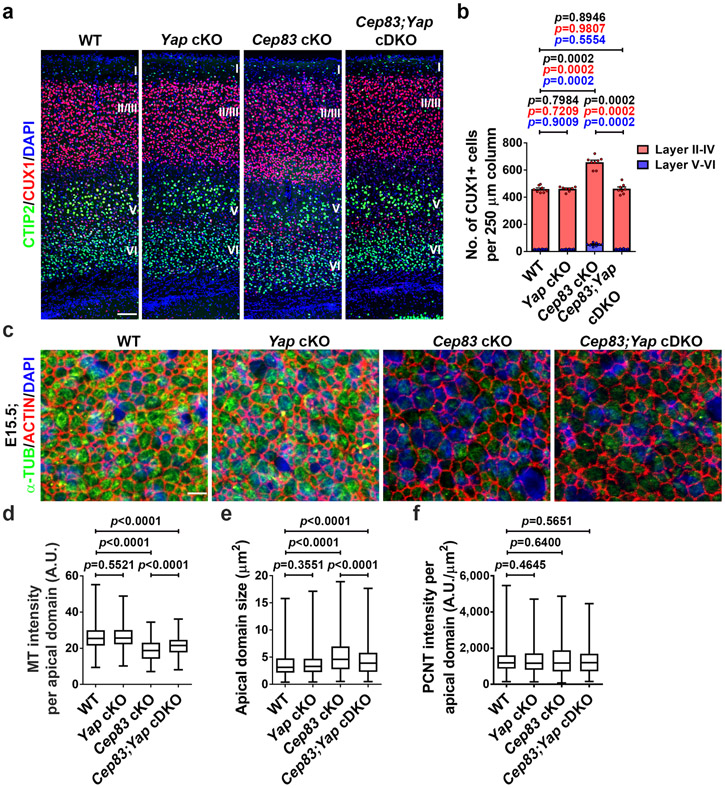
We next asked whether the enlargement and folding of the Cep83 cKO cortex depends on excessive YAP activation. We crossed the conditional Yap mutant mouse, Yapfl/fl, with the Emx1-Cre or Emx1-Cre;Cep83fl/fl mouse to generate the mice with individual or simultaneous deletion of Cep83 and Yap selectively in cortical RGPs. Compared with the WT littermate control, the Emx1-Cre;Yapfl/fl (i.e., Yap cKO) mice did not show any obvious change in the size or neuronal density of the cortex (Fig. 5d-g and Extended Data Fig. 10a, b). This is consistent with a relatively low level of YAP expression in RGP nuclei under normal condition (Fig. 5a). Interestingly, while the Cep83 cKO cortex was significantly enlarged with abnormal folding and increased neuronal density, the Emx1-Cre;Cep83fl/fl;Yapfl/fl (i.e., Cep83;Yap conditional double knockout, cDKO) cortex was comparable to the WT cortex (Fig. 5d-g and Extended Data Fig. 10a, b), indicating that simultaneous Yap deletion effectively suppresses the increase in cortical neurogenesis triggered by Cep83 deletion. We did not observe any folding in the Cep83;Yap cDKO cortex (Fig. 5f). Consistent with the notion that excessive YAP activation is downstream of apical membrane stretching and stiffening, the apical domain size in the Cep83;Yap cDKO cortex remained significantly larger (Extended Data Fig. 10c-f). Together, these results demonstrate that the cortical enlargement and folding caused by CEP83 removal in RGPs depend on excessive YAP activation caused by apical membrane stretching and stiffening.
DISCUSSION
The centrosome in RGPs is anchored to the apical membrane via the DAPs. Removal of CEP83, a DAP protein, in RGPs disrupts DAP formation and causes the detachment of the centrosome from the apical membrane. This rather subtle (<1 μm) dislocation of the centrosome causes drastic changes in RGP behaviour and cortical development. Our side-by-side comparison of Ift88 cKO or SmoM2 expression with Cep83 cKO brains suggests that the drastic enlargement and abnormal folding, albeit with normal lamination and lateral ventricle size, of the Cep83 cKO cortex is unlikely due to primary cilium loss or elevated SHH signalling. Instead, we uncovered a previously unrecognized function of the centrosome in RGPs (Fig. 5h). The docking of the centrosome to the apical membrane supports the formation of prominent ring-like MT structures juxtapose to the cell junctions, which likely promotes intracellular cortical contractile force in conjunction with ACTIN network. The contractile force of individual RGPs are balanced by the intercellular tugging force exerting between neighbouring RGPs that form junctions with each other, which would determine the overall stiffness or rigidity of the VZ surface. Primary ciliogenesis may further strength the tethering of the centrosome and influence microtubule organization and apical membrane properties. Similar intricate organization of the centrosome and MT ring has been observed in neuroepithelial cells of chicken spinal cord 43, suggesting that it is a common feature of neural progenitors.
While neuronal density increase was observed throughout the cortical area in the Cep83 cKO brain, the folding occurred consistently in the medial region, where the density of both deep and superficial layer neurons was dramatically increased. These observations are consistent with the notion that substantial radial expansion in neurogenesis is crucial for cortical folding 44. The local anatomical organization may also render the medial region more susceptible to folding. Our data suggest that centrosome subcellular organization and mechanical properties of neural progenitors affect their proliferative and neurogenic capacity. Notably, as development proceeds, the stiffness of the VZ surface in the mouse cortex gradually decreases 45. In addition, the VZ surface of the ferret that develops a large and gyrated cortex appears to be stiffer than that of the mouse 45. These observations point to an interesting relationship between the mechanical properties of RGPs and cortical size and formation. Our findings of an enlarged cortex with excessive neurogenesis in the absence of CEP83 reveal a unexpected link between centrosomal abnormalities and brain overgrowth (i.e., megalencephaly). Biallelic mutations in human CEP83 have been found to cause infantile nephronophthisis as well as intellectual disability 46, underscoring the importance of CEP83 and centrosome positioning in controlling human brain development and function.
METHODS
Mouse lines
The Cep83 conditional knockout mice were generated using CRISPR/Cas9-mediated double nicking strategy 23. Guide RNAs (gRNA) were designed and synthesized according to described methods 23. A gRNA pair In3A (5’-GGTTTCCTGACAACGCAGAT-3’) and In3B (5’-TCAGTCCAGTTCAGTAGCGT-3’) were selected for their high targeting efficiency based on Surveyor assay (Integrated DNA Technologies) and cloned into pX335 vector. To generate minivector gene targeting construct, a DNA fragment of mouse Cep83 containing the critical Exon 3 was amplified from BAC clone RP23-422L20 (Children’s Hospital Oakland Research Institute) and cloned into pL451 vector using Golden Gate Assembly method. A mixture of pX335-In3A, pX335-In3B, and pL451-Cep83 flox-neo plasmids were then electroporated into a W4 mouse embryonic stem (ES) cell line of 129S6 background for gene targeting (Rockefeller University Gene Targeting Resource Centre). Correctly targeted ES cell clones were screened by Southern blot against 5’ homology arm, and confirmed by long-range PCR, genotyping, and sequencing. ES cell clones were microinjected into C57B6/J blastocysts for chimera production. Male chimeras were crossed to multiple C57B6/J females to screen and obtain Cep83fl-neo mice through genotyping. Actin-Flp transgenic mice (stock# 005703; The Jackson Laboratory) were used to excise the Neo selection cassette and obtain Cep83fl/+ (fl, floxed allele). Genotyping primers for Cep83 floxed allele at 5’ loxP site were: forward primer, 5’-AGTGGGCTGTGAATGTAGTCTT-3’ and reverse primer, 5’-AGCCAACCAATAATACAGAAAACA-3’. Deletion of exon 3 creates a frame shift in subsequent exons and thereby interferes CEP83 protein expression. Ift88fl/fl31, Yapfl/fl47, and R26-LSL-SmoM2 33 mice were kindly provided by Dr. Bradley Yoder (University of Alabama at Birmingham), Dr. Jeff Wrana (The Lunenfeld-Tanenbaum Research Institute, Canada), and Dr. Andrew McMahon (University of Southern California), respectively. Emx1-Cre (stock#005628; The Jackson Laboratory) was used to delete genes in the cortex. Genotyping was carried out using standard PCR protocols. Both male and female mice were used in the study. The mice were maintained at the facilities of Memorial Sloan Kettering Cancer Centre (MSKCC) and Tsinghua University, and all animal procedures were approved by the Institutional Animal Care and Use Committees (IACUC). For timed pregnancies, the plug date was designated as E0 and the date of birth was defined as P0. No wild animal or field-collected sample was used in the study.
shRNA Design and In Utero Electroporation
Three shRNA sequences against Cep83, Cep89, and Sclt1 were designed as follows: Cep83 shRNA-a (5’-gcaagcaagccaggaaaaa-3’), -b (5’-gctccaatgcgagaacgtt-3’), -c (5’-gctagaacttgagaacaga-3’); Cep89 shRNA-a (5’-ggacgtcattaccatcct-3’), -b (5’-gggccccacaccaccctgg-3’), -c (5’-gtcgtgaaggaaaacgaagcc-3’); Sclt1 shRNA-a (5’-gataaactaaatgatatt-3’), -b (5’-aaatgcatcaaagatgtc-3’), -c (5’-ggcaaacaggatgaaagtga-3’). All sense and anti-sense oligos were purchased from IDT. Annealed oligos were cloned into the HpaI and XhoI sites of the Lentiviral vector pLL3.7. In utero electroporation was performed as previously described 6. In brief, a timed pregnant CD-1 mouse at E13.5 was anesthetized, the uterine horns were exposed, and ~1 μL plasmid DNA mixed with Fast green (Sigma) was microinjected through the uterus into the lateral ventricle manually using a bevelled and calibrated glass micropipette (Drummond Scientific). For electroporation, five 50 msec pulses of ~35 mV with a 950 msec interval were delivered across the uterus with two 5-mm electrode paddles positioned on either side of the head (BTX, ECM830). During the procedure, the embryos were constantly bathed with warm sterile PBS (pH 7.4). After electroporation, the uterus was placed back in the abdominal cavity and the wound was surgically sutured. After surgery, the animal was placed in a 28°C recovery incubator with proper analgesic treatments until it recovered and resumed normal activity. All procedures for animal handling and usage were approved by the institutional research animal resource centre (RARC).
Brain Sectioning, Immunohistochemistry, and Imaging
Timed pregnant females that carried conditional mutant alleles were anesthetized, embryos were removed and perfused with ice-cold phosphate buffered saline (PBS, pH7.4), followed by 4% paraformaldehyde (PFA). Brains were post-fixed with 4% PFA for ~6 hours, cryo-protected, and sectioned at 12 μm for immunohistochemistry as previously described 18. Postnatal animals were similarly processed and cryo-sectioned at 40 μm. For en face analysis of ventricular surface, embryos were perfused with warm PBS and PFA to avoid microtubule depolymerization. Dorsal telencephalon was then dissected out of the embryonic brain to expose the ventricular surface for immunohistochemistry. The following primary antibodies were used: Alexa Fluor 546 Phalloidin (Cat#A22283; RRID: AB_2632953; Lot#1947552; 1:500, ThermoFisher), goat anti-FOXP2 (Cat#AB16046; RRID: AB_2107107; Lot#GR3237165-1; 1:100, Abcam), goat anti-SOX2 (Cat#SC-17320; RRID: AB_2286684; Lot#E0715; 1:500, Santa Cruz), chicken anti-GFP (Cat#GFP-1020; RRID: AB_10000240; Lot#GFP879484; 1:500, AVES), mouse anti-β-CATENIN (Cat#610153; RRID: AB_397554; Lot#7187864; 1:500, BD Bioscience), mouse anti-S100α/β (Cat#SC-58839; RRID: AB_2183338; Lot#K1215; 1:200, Santa Cruz), mouse anti-phospho-VIMENTIN (Cat#AB22651; RRID: AB_447222; Lot#GR3233697-1; 1:500, Abcam), mouse anti-N-CAD (Cat#AB98952; RRID: AB_10696943; Lot#GR287147-10; 1:500, Abcam), mouse anti-NESTIN (Cat#RAT-401; RRID: AB_2235915; Lot#5/26/2016; 1:500, Developmental Studies Hybridoma Bank), mouse anti-Neurofilament (Cat#837904; RRID: AB_2566782; Lot#B263754; 1:500, BioLegend), mouse anti-PCNT (Cat#611814; RRID: AB_399294; Lot#8163868; 1:200, BD Biosciences), mouse anti-α-TUB (Cat#T9026; RRID: AB_477593; Lot#047M4789V; 1:1000, Sigma-Aldrich), mouse anti-YAP (Cat#SC-101199; RRID: AB_1131430; Lot#F2916; 1:200, Santa Cruz), mouse anti-ZO-1 (Cat#33-9100; RRID: AB_87181; Lot#TH275232; 1:200, ThermoFisher), rabbit anti-BLBP (Cat#AB32423; RRID: AB_880078; Lot#GR260227-2; 1:500, Abcam), rabbit anti-CEP83 (Cat#HPA038161; RRID: AB_10674547; Lot#A91789; 1:200, Sigma-Aldrich), rabbit anti-CEP89 (Cat#AB204410; validated by western blot and immunostaining; Lot#GR3247629-1; 1:500, Abcam), rabbit anti-ODF2 (Cat#12058-1-AP; RRID: AB_2156630; Lot#00050046; 1:500, Proteintech), rabbit anti-CEP164 (Cat#HPA037606; RRID: AB_10672498; Lot#A95909; 1:200, Sigma-Aldrich), rabbit anti-CUX1 (Cat#SC-13024; RRID: AB_2261231; Lot#H2815; 1:200, Santa Cruz), rabbit anti-HOPX (Cat#HPA030180; RRID: AB_10603770; Lot#C105589; 1:1000, Sigma-Aldrich), rabbit anti-MAP2 (Cat#AB5622; RRID: AB_11213363; Lot#3053795; 1:500, EMD Millipore), rabbit anti-PARD3 (Cat#HPA030443; RRID: AB_10600926; Lot#C105765; 1:500, Sigma Aldrich), rabbit anti-PAX6 (Cat#901301; RRID: AB_256003; Lot#B267205; 1:500, Biolegend), rabbit anti-PAX6 (Cat#PD022; RRID: AB_1520876; Lot#005; 1:500, MBL), rabbit anti-PCNT (Cat#AB4448; RRID: AB_304461;Lot#GR3200989-1; 1:500, Abcam), rabbit anti-OLIG2 (Cat#AB9610; RRID: AB_570666; Lot#2950732; 1:500, EMD Millipore), rabbit anti-P-HH3 (Cat#AB47297; RRID: AB_880448; Lot#GR3190286-11; 1:1000, Abcam), rabbit anti-PTPRZ1 (Cat#HPA015103; RRID: AB_1855946; Lot#B105439; 1:500, Sigma-Aldrich), rabbit anti-SATB2 (Cat#AB92446; RRID: AB_10563678; Lot#GR285095-11; 1:500, Abcam), rabbit anti-TNC (Cat#AB108930; RRID: AB_10865908; Lot#GR308354-7; 1:500, Abcam), rat anti-BrdU (Cat#AB6326; RRID: AB_305426; Lot#GR191332-1; 1:500, Abcam), rat anti-CTIP2 (Cat#18465; RRID: AB_2064130; Lot#GR203038-2; 1:1000, Abcam), rat anti-TBR2 (Cat#12-4875-82; RRID: AB_1603275; Lot#4279686; 1:100, eBioscience). Alexa fluor 488- Donkey anti-Rabbit IgG (Cat#A-21206; RRID: AB_141708; Lot#1910751; 1:1000, ThermoFisher), Donkey anti-Mouse IgG (Cat#A-21202; RRID: AB_141607; Lot#1890861; 1:1000, ThermoFisher), Donkey anti-Goat IgG (Cat#A-11055; RRID: AB_2534102; Lot#1627966; 1:1000, ThermoFisher), Goat anti-Rat IgG (Cat#A-11006; RRID: AB_141373; Lot#1887148; 1:1000, ThermoFisher), Donkey anti-Chicken IgY (Cat#703-546-155; RRID: AB_2340376; Lot#132803; 1:1000, Jackson ImmunoResearch), Alexa fluor 555- Donkey anti-Rabbit IgG (Cat#A-21432; RRID: AB_141788; Lot#1866859; 1:1000, ThermoFisher), Donkey anti-Mouse IgG (Cat#A-31570; RRID: AB_2536180; Lot#1850121; 1:1000, ThermoFisher), Donkey anti-Goat IgG (Cat#A-21432; RRID: AB_141788; Lot#2026158; 1:1000, ThermoFisher), Alexa fluor 594- Donkey anti-Rat IgG (Cat#A-21209; RRID: AB_2535795; Lot#1905801; 1:1000, ThermoFisher), Alexa fluor 647- Donkey anti-Rabbit IgG (Cat#A-31573; RRID: AB_2536183; Lot#1903516; 1:1000, ThermoFisher), Alexa fluor 647- Donkey anti-Mouse IgG (Cat#A-31571; RRID: AB_162542; Lot#1839633; 1:1000, ThermoFisher), Donkey anti-Goat IgG (Cat#A-21447; RRID: AB_141844; Lot#1627966; 1:1000, ThermoFisher), Goat anti-Rat IgG (Cat#A-21247; RRID: AB_141778; Lot#1858181; 1:1000, ThermoFisher) conjugated secondary antibodies were used. For EdU and BrdU double pulse chase analysis, animals were weighted and injected with EdU (10 μg per gram of animals) and BrdU (50 μg per gram of animals) sequentially. EdU staining was performed using Click-IT EdU Alexa Fluor 647 Imaging Kit (ThermoFisher). Before proceeding with BrdU staining, tissue sections were blocked with azidomethylphenylsulfide to minimize cross-reactivity of anti-BrdU antibody against EdU 49. BrdU staining was performed as described previously 18. Coronal sections were imaged with a FV1200 or FV3000 confocal microscope (Olympus) and NanoZoomer 2.0 HT slide scanner (Hamamatsu Photonics). Free-floating dorsal telencephalon was submerged in PBS and positioned in an en face view, and imaged by FV1200 or FV3000 confocal microscope with water-immersion objectives. Cortical length and area were estimated by measuring the overall length and area of the dorsal cortex in individual brain sections at a similar rostrocaudal position. The densities of neurons were quantified by measuring the number of cells positive for specific markers in a 250 μm rectangle region perpendicular to the pia covering the entire cortex. En face images of the ventricular surface were automatically segmented with Fiji plugin Tissue Analyzer 50 and manually corrected. Cell boundaries at the edges of images were manually removed and thereby excluded from analysis. The segmented images were then transformed into labelled image with Fiji plugin MorphoLibJ 51. Subsequently, apical domain sizes were measured through particle analysis function of Fiji. For result visualization, apical domain size was colour coded with MatLab (version R2016b, Mathworks Inc.). All images were analysed and processed using Fluoview (version 4.2, Olympus), Volocity (version 6.3, PerkinElmer), ImageJ/Fiji (1.52p, NIH), NDP viewer (version 2, Hamamatsu Photonics), Imaris (version 9.0.1, Oxford Instrument), and Photoshop (Adobe).
Serial-section Transmission Electron Microscopy (TEM)
For TEM analysis, timed pregnant females were prepared and embryos were removed and perfused with 0.1 M sodium cacodylate buffer (pH 7.4) and a fixative containing 2% PFA and 2.5% glutaraldehyde (GA) at room temperature, followed by post-fixation overnight with the same fixative at 4°C. Brains were then sliced into 1-mm thick coronal sections with mouse brain mold. The selected slices were re-fixed with 2.5% GA and 0.1% tannic acid for one hour and then with 2.5% GA overnight. The slices were post-fixed with 1% osmium tetra-oxide and 0.4% potassium ferrocyanide for 1 hour, followed by en bloc staining with 1% uranyl acetate for 30 min. Sections were subsequently dehydrated with graded ethanol series, infiltrated and embedded with Eponate12 resin (Electron Microscopy Sciences). Serial sections (70 nm) of brain regions close to the ventricular surface were cut by an ultra-microtome (Ultracut E; Leica). Serial images of centrioles from RGPs at the ventricular surface were acquired with JOEL 100CX transmission electron microscope with a digital imaging system (XR41-C, Advantage Microscopy Technology) at 80 kV at the Rockefeller University Electron Microscopy Resource Centre.
Magnetic Resonance Imaging (MRI) Analysis
Ex vivo MRI of 4% PFA fixed mouse brain specimens was performed on a horizontal 7 Tesla MR scanner (Bruker Biospin, Billerica, MA, USA) with a triple-axis gradient system. Images were acquired using a quadrature volume excitation coil (72 mm diameter) and a receive-only 4-channel phased array cryogenic coil. The specimens were imaged with skull intact and placed in a syringe filled with Fomblin to prevent tissue dehydration. For MRI-based characterization of macroscopic brain morphology, diffusion MRI data were acquired instead of conventional T1 or T2-weighted MRI from not yet fully myelinated P21 mouse brains 52. High-resolution diffusion MRI data were acquired using a modified 3D diffusion-weighted gradient- and spin-echo (DW-GRASE) sequence 53 with the following parameters: echo time (TE)/repetition time (TR) = 30/500ms; two signal averages; field of view (FOV) = 12.8 mm x 10 mm x 18 mm, resolution = 0.1 mm x 0.1 mm x 0.1 mm; two non-diffusion weighted image (b0); 30 diffusion directions; and b = 2000 s/mm2. The total imaging time was approximately 6 hours for each specimen.
From the diffusion MRI data, diffusion tensors were calculated using the log-linear fitting method implemented in DTIStudio (v2 10 6, http://www.mristudio.org) at each pixel. The mouse brain images were rigidly aligned to an ex vivo mouse brain template in our MRI based mouse brain atlas 54 using the Large Deformation Diffeomorphic Metric Mapping (LDDMM) method 55 implemented in the DiffeoMap software (v2 10 6, www.mristudio.org). To further determine the specific cortical regions in the knockout mice that showed significant changes in local tissue volume with respect to the control mice, voxel based morphometric analysis was also performed as described previously 56 with the false discovery rate (FDR) set at 0.05. Cortical volume was estimated based on the MRI data.
Atomic Force Microscopy (AFM)
To prepare samples for AFM, the dorsal telencephalon was dissected from the embryonic brain in 1X DMEM-N2 medium (ThermoFisher) to expose the ventricular surface. Tissues were positioned with the VZ surface upward and mounted onto 50 mm glass-bottom Fluorodish (World Precision Instruments) coated with Cell Tak tissue adhesive (Corning). Tissues were then covered with 1X DMEM-N2 medium and recovered in a 5% CO2 chamber at 37°C for 1 hour. Stiffness measurement was performed by MFP-3D-BIO AFM (Asylum Research). An Axio Observer Z1 inverted microscope (Zeiss) served as the AFM base (LD Plan-Neofluar 5x 0.15NA objective) to locate the sample and position the cantilever tip over the sample. A CP-CONT-BSG-C (sQube) probe with a 20 μm borosilicate glass bead was used for all measurements. The Asylum Research GetReal calibration method was utilized for the determination of the spring constant (~0.2 N/m). The trigger point was set to 10 nN with an approach and retraction velocity of 5 μm/sec. To determine the Young’s Modulus, the force-indentation curves were fit to the Hertz model for spherical tips through the Asylum Research Software (version 16), with an assumed Poisson’s ratio value of 0.45 for the sample 57. Three distinct spots (40 x 40 μm2 by size) were measured for each piece of tissue. Average stiffness of each spot was calculated for data analysis.
Acute dissociated VZ cell culture
WT or Cep83 cKO embryos were dissect out and sectioned using a vibratome (Leica Microsystems ) at E15. The VZ of the cortex were isolated, incubated in a protease solution containing 10 units/mL papain (Fluka) in DMEM (Gibco) and triturated using a fire-polished Pasteur pipette to create single-cell suspension. Cells were resuspended in a culture medium containing DMEM, Glutamine, Penicillin/Streptomycin, Sodium Pyruvate (Gibco), 1 mM N-acetyl-L-cysteine (Sigma), B27, and N2, and plated onto coverslips coated with poly-L-lysine (Sigma) in 24-well plates. The cultures were maintained in a humidified incubator at 37°C with constant 5% CO2 supply. About 8-12 hours later, the cultures were fixed and analyzed for YAP expression.
QUANTIFICATION AND STATISTICAL ANALYSIS
For individual experiments, at least three WT and mutant mice/brains from multiple litters were examined. For immunohistochemistry experiments, multiple sections from individual brains were analysed. No sample-size calculations were performed. Sample size was determined to be adequate based on the magnitude and consistency of measurable differences between groups. No randomization of samples was performed. Mice subjected to the analyses were littermates, age-matched, and includes both sexes. Investigators were not blinded to mouse genotypes during experiments. Data are not subjective but rather based on quantitative analyses. The numbers of times each experiment was repeated independently with similar results were provided in the figure legends. Statistical significance was determined using Chi-square or two-sided non-parametric Mann-Whitney-Wilcoxon test, and the test results were given as exact values in the figures. Statistical significance was defined as p < 0.05. Statistical tests were performed with Prism (version 7, GraphPad). Effect sizes were calculated using Pearson’s r (Chi-square) or U/(n1*n2) (Mann-Whitney-Wilcoxon test). Values in bar graphs indicate mean + SEM. Values in box-and-whisker graphs indicate median (centre line), interquartile range (box), and minimum/maximum (whiskers).
Extended Data
Extended Data Fig. 1: Cep83 deletion in cortical RGPs.
(a) Schematic diagram of the Cep83 conditional knockout mouse generation using CRISPR/Cas9-mediated double nicking strategy. The DNA sequence at the top depicts the sites targeted by a pair of guide RNAs (outlined in blue) downstream of the critical exon 3 in the Cep83 gene. Green boxes represent exons, red triangles represent LoxP sites, and yellow triangles represent FRT sites. NeoR, Neomycin resistance gene cassette. (b) Representative southern blot image showing the correct gene targeting against the 5’ homology arm of Cep83 floxed allele with the presence of deletion-specific 3.5 kb band (n = 3). (c) Representative images of WT and Cep83 cKO cortices at E12.5, E13.5 and E15.5 stained for PCNT (green) and ARL13B (red), a primary cilium marker, and with DAPI (blue) (n = 3). High magnification images of individual centrosomes are shown in the insets. Note the loss of primary cilia in the Cep83 cKO cortex by E13.5. Scale bars: 10 μm and 1 μm. (d) Representative images of P1 WT (n = 11) and Cep83 cKO (n = 12) cortices stained for CTIP2 (green) and CUX1 (red), and with DAPI (blue). The asterisk indicates the folding in the medial region of the Cep83 cKO cortex. High magnification images of the folding are shown to the right. Scale bars: 500 μm and 200 μm. (e) Representative images of P1 WT and Cep83 cKO cortices stained for Brain lipid-binding protein (BLBP, green) and DAPI (blue). High magnification images are shown to the right. Scale bars: 500 μm and 100 μm.
Extended Data Fig. 2: Cep83 deletion in RGPs leads to increased neurogenesis and gliogenesis.
(a) Representative images of the medial regions of P21 WT and Cep83 cKO cortices stained for FOXP2 (green) and SATB2 (red), and with DAPI (blue). Scale bar: 100 μm. (b) Quantification of the numbers of SATB2+ (left) and FOXP2+ (right) neurons per 250 μm column. WT, n = 8 brains, cKO, n = 8 brains. (c) Representative images of the dorsal regions of P21 WT and Cep83 cKO cortices stained for FOXP2 (green) and SATB2 (red), and with DAPI (blue). Scale bar: 100 μm. (d) Quantification of the number of SATB2+ (left) and FOXP2+ (right) neurons per 250 μm column. WT, n = 6 brains; cKO, n = 5 brains. (e) Representative images of P21 WT and Cep83 cKO cortices stained for OLIG2 (green), an oligodendrocyte marker, and S100 (red), an astrocyte marker, and with DAPI (blue). Scale bar: 100 μm. (f) Quantification of the numbers of OLIG2+ oligodendrocytes (n = 10 regions from 5 brains for each genotype) and S100+ astrocytes (n = 6 regions from 3 brains for each genotype) per 650 μm column. Data are shown as mean + SEM. Statistical analysis was performed using two-sided Mann-Whitney-Wilcoxon test.
Extended Data Fig. 3: Ift88 deletion in RGPs does not lead to any obvious defect in centrosome appendages and membrane anchorage or cortical development.
(a) Representative images of E13.5 WT and Ift88 cKO VZ surfaces stained for PCNT (green) and ARL13B (red), and with DAPI (blue) (n = 3). High magnification images of individual centrosomes are shown as the insets. Note the complete loss of primary cilia in the Ift88 cKO cortex by E13.5. Scale bars: 10 μm and 1 μm. (b) Representative ssTEM images of E15.5 WT (top) and Ift88 cKO (bottom) VZ surfaces showing individual centrosomes of RGPs in the apical endfoot. High magnification images (broken line squares) are shown to the right. Note that the Ift88 cKO mother centriole (MC) possesses the DAPs that are anchored at the apical membrane (red arrows) and the sDAPs (yellow arrows), but does not support any MT-based ciliary axoneme (WT, n = 9 centrosomes; Ift88 cKO, n = 20 centrosomes). All WT MCs were anchored to the apical membrane with MT-based cilia. All Ift88 cKO MCs were anchored to the apical membrane, but none possessed MT-based cilia. Scale bars: 800 nm and 200 nm. (c) Representative images of E15.5 WT and Ift88 cKO VZ surfaces stained for PCNT (green) and CEP164 (red), and with DAPI (blue) (n = 3). High magnification images of individual centrosomes are shown as the insets. Note the normal presence of CEP164 at the centrosome in the Ift88 cKO cortex. Scale bars: 10 μm and 0.5 μm. (d) Representative images of E15.5 WT (n = 6) and Ift88 cKO (n = 6) VZ surfaces stained for PCNT (green) and ODF2 (red), an sDAP marker, and with DAPI (blue). High magnification images of individual centrosomes are shown as the insets. Note the normal presence of ODF2 at the centrosome in the Ift88 cKO cortex. Scale bars: 5 μm and 1 μm. (e) Representative whole mount images of P21 WT and Ift88 cKO brains. Scale bar: 0.5 cm. (f) Quantification of the projected cortical area. N = 6 brains for each genotype. (g) Images of P21 WT and Ift88 cKO brain sections stained for CTIP2 (green) and CUX1 (red), and with DAPI (blue). Scale bar: 0.5 mm. (h) Quantification of the cortical area. WT, n = 4 brains; Ift88 cKO, n = 4 brains. (i) Images of the dorsal regions of P21 WT and Ift88 cKO cortices stained for CTIP2 (green) and CUX1 (red), and with DAPI (blue). Scale bar: 100 μm. (j) Quantification of the number of CUX1+ (left) and CTIP2+ (right) neurons per 250 μm column. N = 8 brains for each genotype. (k) Representative images of P21 WT and Ift88 cKO brain sections along the rostrocaudal axis stained with DAPI (grey) (n = 5). Note no obvious hydrocephalus in the Ift88 cKO brain. Scale bar: 1 mm. For box-whisker plots: centre line, median; box, interquartile range; whiskers, minimum and maximum. For bar charts, data are shown as mean + SEM. Statistical analysis was performed using two-sided Mann-Whitney-Wilcoxon test.
Extended Data Fig. 4: Expression of SmoM2 in RGPs leads to cortical dysplasia.
(a) Representative whole mount images of P1 WT and SmoM2 brains (n = 5). Arrowheads indicate the agenesis of olfactory bulb in the SmoM2 brain. Scale bar: 0.5 cm. (b) Representative images of P1 WT and SmoM2 brain sections stained for CTIP2 (green) and CUX1 (red), and with DAPI (blue) (n = 5). The arrowheads indicate the absence of corpus callosum in the SmoM2 brain. The asterisk indicates the agenesis of hippocampus in the SmoM2 brain. Scale bar: 0.5 mm. (c) Representative images of P1 WT and SmoM2 cortices stained for CTIP2 (green) and CUX1 (red), and with DAPI (blue) (n = 4). Note the drastic disorganization of the SmoM2 cortex. Scale bar: 100 μm. (d) Representative images of E15.5 WT and SmoM2 VZ surfaces stained for PCNT (green) and ARL13B (red), and with DAPI (blue) (n = 3). High magnification images of individual centrosomes are shown as the insets. Note the presence of the primary cilium at the SmoM2 centrosome. Scale bars: 5 μm and 1 μm. (e) Representative images of E15.5 WT and SmoM2 VZ surfaces stained for PCNT (green) and CEP89 (red), a DAP marker, and with DAPI (blue) (n = 3). High magnification images of individual centrosomes are shown as the insets. Note the normal presence of CEP89 at the SmoM2 centrosome. Scale bars: 5 μm and 1 μm. (f) Representative images of E15.5 WT and SmoM2 VZ surfaces (n= 5) stained for PCNT (green) and ODF2 (red), and with DAPI (blue) (n = 3). High magnification images of individual centrosomes are shown in the insets. Note the normal presence of ODF2 at the SmoM2 centrosome. Scale bars: 5 μm and 1 μm.
Extended Data Fig. 5: Cep83 deletion does not affect the densities of RGPs and IPs at E13.5, but leads to increased densities of RGPs and IPs in the dorsomedial cortex at E15.5.
(a) Representative images of E13.5 WT and Cep83 cKO cortices stained for PAX6 (green) and TBR2 (red), and with DAPI (blue). Scale bar: 50 μm. (b, c) Quantification of the number of PAX6+ (b) and TBR2+ (c) cells per 250 μm column in a. WT, n = 8 brains; Cep83 cKO, n = 8 brains. (d) Images of E12.5 WT and Cep83 cKO cortices (dorsomedial region) subjected to EdU (red) and BrdU (green) sequential pulse chase labelling, stained for PAX6 (white), and with DAPI (blue). High magnification images (broken line squares) are shown at the bottom. Scale bars: 50 μm. (e, f) Quantification of the percentage of EdU+;BrdU+ cells among the total EdU+ cells in the VZ (e) and the number of BrdU+ cells in the VZ per 250 μm column (f). WT, n = 6 brains; Cep83 cKO, n = 6 brains. (g) Images of E15.5 WT and Cep83 cKO cortices (dorsomedial region) stained for PAX6 (green) and TRB2 (red), and with DAPI (blue). Scale bar: 50 μm. (h, i) Quantification of the number of PAX6+ (h) or TBR2+ (i) cells per 250 μm column. WT, n = 8 brains; Cep83 cKO, n = 6 brains. (j) Quantification of the distribution width of TBR2+ cells in the WT or Cep83 cKO cortices. E13.5, n = 4 brains for each genotype; E15.5, n = 5 brains for each genotype. For box-whisker plots: centre line, median; box, interquartile range; whiskers, minimum and maximum. Statistical analysis was performed using two-sided Mann-Whitney-Wilcoxon test.
Extended Data Fig. 6: Increased mitotic cells in the SVZ of the Cep83 cKO cortex are predominantly IPs.
(a) Images of E15.5 WT and Cep83 cKO cortices stained for P-HH3 (red), a mitotic cell marker, and with DAPI (blue). Scale bar: 50 μm. (b, d) Images of E15.5 WT and Cep83 cKO cortices stained for P-HH3 (red) and TBR2 (green, d) or SOX2 (green, f), an RGP marker, and with DAPI (blue). High magnification images of individual P-HH3+ cells are shown at the bottom. Note that P-HH3+ cells in the SVZ of the Cep83 cKO cortex are predominantly TBR2+, but SOX2−. Scale bars: 25 μm and 10 μm. (c) Images of E15.5 WT and Cep83 cKO cortices stained for P-HH3 (red) and phospho-VIMENTIN (P-VIM, green), and with DAPI (blue). High magnification images of individual P-HH3+ cells are shown at the bottom. Scale bars: 50 μm and 10 μm. (e, f) Quantification of the number of apical (e) and basal (f) P-HH3+ cells per 250 μm column. WT, n = 16 brains; Cep83 cKO, n = 14 brains. (g, h) Quantification of the percentage of P-HH3+ cells in the SVZ that are TBR2+ (g; lateral: n = 4 brains for each genotype; medial: n = 3 brains for each genotype) or SOX2− (h; n = 4 brains for each genotype). (i) Quantification of the percentage of P-HH3+ cells without a P-VIM labelled basal radial glial fibre (lateral: n = 4 brains for each genotype; medial: n = 3 brains for each genotype). (j-l) Representative images of E15.5 WT and Cep83 cKO cortices stained for PAX6 (green) and HOPX (red, j), PTPRZ1 (red, k), or TNC (red, l), three previously suggested oRG markers, and with DAPI (blue) (n = 4). Note no obvious increase in HOPX, PTPRZ1, or TNC expression in the Cep83 cKO cortex and low expression in both WT and Cep83 cKO cortices. Scale bars: 50 μm. For box-whisker plots: centre line, median; box, interquartile range; whiskers, minimum and maximum. Statistical analysis was performed using two-sided Mann-Whitney-Wilcoxon test.
Extended Data Fig. 7: Disruption of other DAP assembly pathway components leads to excessive production of RGPs and IPs.
(a) Diagram of the hierarchical DAP assembly pathway. (b-d) Western blot assays on the efficacy of Cep83 (b), Cep89 (c), or Sclt1 (d) shRNAs on suppressing protein expression (n = 3). (e) Representative images of E16.5 cortices that received in utero electroporation of EGFP (green) together with Cep83 or Cep89/Sclt1 shRNAs at E13.5 and stained for PAX6 (red, top) and TBR2 (red, bottom), and with DAPI (blue). Note that expression of Cep83 shRNA-a which effectively suppresses protein expression but not Cep83 shRNA-c that does not suppress protein expression leads to a significant increase in both PAX6+ RGPs in the VZ and TBR2+ IPs in the SVZ. Moreover, expression of Cep89 shRNA-c and Sclt1 shRNA-c that effectively suppress protein expression but not Cep89 shRNA-b and Sclt1 shRNA-b that do not suppress protein expression results in a similar increase in both PAX6+ RGPs and TBR2+ IPs. Scale bars: 100 μm. (f, g) Quantification of the percentage of EGFP+ cells that are PAX6+ (f) or TBR2+ (g). Note that similar to Cep83 cKO, both Cep83 shRNA-a and Cep89/Sclt1 shRNA-c, but not Cep83 shRNA-c or Cep89/Sclt1 shRNA-b, lead to a significant increase in PAX6+ RGPs and TBR2+ IPs, indicating that disruption of other DAP components causes an excessive production of RGPs and IPs, similar to CEP83 removal. Control, n = 4 (f) and 5 (g) brains; Cep83 shRNA-a, n = 5 brains; Cep89 & Sclt1 shRNA-c, n = 4 brains; Cep83 shRNA-c, n = 6 brains; Cep89 & Sclt1 shRNA-b, n = 4 brains. (h) Quantification of the percentage of EGFP+ cells in different cortical regions. Control, n = 5 brains; Cep83 shRNA-a, n = 5 brains; Cep89 & Sclt1 shRNA-c, n = 4 brains; Cep83 shRNA-c, n = 7 brains; Cep89 & Sclt1 shRNA-b, n = 5 brains. For box-whisker plots: centre line, median; box, interquartile range; whiskers, minimum and maximum. For bar charts, data are shown as mean + SEM. Statistical analysis was performed with two-sided Mann-Whitney-Wilcoxon test.
Extended Data Fig. 8: Centrosome apical membrane detachment does not disrupt RGP polarity, junction formation, or radial glial fibre scaffolding.
(a) Representative images of E15.5 WT and Cep83 cKO cortices in coronal section stained for α-TUB (green) and with DAPI (blue) (n = 3). Note no obvious difference in non-apical membrane MTs in the WT and Cep83 cKO cortices. Scale bar: 10 μm. (b) Representative en face images of mitotic RGPs in E15.5 WT and Cep83 cKO cortices stained for α-TUB (green) and with DAPI (blue) (n = 12). Note no obvious difference in MT spindles in the WT and Cep83 cKO RGPs. Scale bar: 2 μm. (c) Representative images of E15.5 WT and Cep83 cKO cortices stained for Partition defective protein 3 (PARD3, red), an evolutionarily conserved polarity protein, and with DAPI (blue) (n = 3). Scale bar: 10 μm. (d) Representative images of E15.5 WT and Cep83 cKO cortices stained for β-CATENIN (β-CAT, red, left), N-CADHERIN (N-CAD, red, middle), or ZO-1 (red, right), three junction markers, and with DAPI (blue). Scale bar: 50 μm. (e-g) Quantification of the staining intensity of β-CAT (e; WT, n = 8 brains; cKO, n = 5 brains for each genotype), N-CAD (f; WT, n = 4 brains; cKO, n = 3 brains), or ZO-1 (g; WT, n= 8 brains; cKO, n = 7 brains) at the VZ surface. A.U., arbitrary unit. (h, i) Representative images of E15.5 WT and Cep83 cKO cortices stained for NESTIN (h) or BLBP (i) (green), and with DAPI (blue) (n = 5). Scale bars: 50 μm. For box-whisker plots: centre line, median; box, interquartile range; whiskers, minimum and maximum. Statistical analysis was performed using two-sided Mann-Whitney-Wilcoxon test.
Extended Data Fig. 9: Centrosome detachment leads to apical membrane enlargement and nuclear expression of YAP is low in TBR2+ IPs and dissociated RGPs in culture.
(a) Representative en face segmented images of WT and Cep83 cKO VZ surface at E13.5 and E15.5. Each apical domain is colour-coded based on its size. Blue colour indicates a relatively larger apical domain. Scale bar: 10 μm. (b) Quantification of the apical domain size of WT and Cep83 cKO RGPs at E13.5 and E15.5. For E13.5 samples, WT, n = 5,038 apical domains from 8 embryos; Cep83 cKO, n = 2,891 apical domains from 6 embryos. For E15.5 samples, WT, n = 4,780 apical domains from 12 embryos; Cep83 cKO, n = 1,959 apical domains from 8 embryos. (c) Quantification of the apical domain size of interphase and mitotic WT and Cep83 cKO RGPs at E15.5. WT, n = 1,703 interphase apical domains and n = 145 mitotic apical domains from 4 embryos; Cep83 cKO, n = 988 interphase apical domains and n = 83 mitotic apical domains from 4 embryos. (d) Representative images of the SVZ of E15.5 WT and Cep83 cKO cortices stained for YAP (green) and TBR2 (red), and for DAPI (blue) (n = 5). Individual TBR2+ IPs are shown as the insets. Note the low expression of YAP in the nuclei of TBR2+ IPs in the SVZ of the WT and Cep83 cKO cortices. Scale bars: 50 μm and 5 μm. (e) Representative images of acute dissociated cell culture of E15.5 WT and Cep83 cKO cortical VZ stained for SOX2 (red) and YAP (green), and with DAPI (blue). Scale bar: 20 μm. (f) Quantification of the YAP staining intensity in SOX2+ RGPs. A.U., arbitrary unit. WT, n = 13 brains; cKO, n = 8 brains. For box-whisker plots: centre line, median; box, interquartile range; whiskers, minimum and maximum. Statistical analysis was performed using two-sided Mann-Whitney-Wilcoxon test.
Extended Data Fig. 10: Excessive neurogenesis in the Cep83 cKO cortex depends on excessive YAP activation.
(a) Representative high magnification images of P21 WT, Yap cKO, Cep83 cKO, and Cep83;Yap cDKO cortices stained for CTIP2 (green) and CUX1 (red), and with DAPI (blue). Scale bar: 100 μm. (b) Quantification of the number of CUX1+ neurons per 250 μm column. N = 8 brains for each genotype. (c) Representative en face images of coronal sections of E15.5 WT, Yap cKO, Cep83 cKO, and Cep83;Yap cDKO cortices stained for α-TUB (green) and ACTIN (red), and with DAPI (blue). Scale bar: 5 μm. (d-f) Quantification of the intensity of MT (d) per apical domain, individual apical domain size (e), and the intensity of PCNT per apical domain (f). A.U., arbitrary unit. WT, n = 1,730 apical domains from 4 embryos; Yap cKO, n = 1,074 apical domains from 3 embryos, Cep83 cKO, n = 456 apical domains from 3 embryos; Cep83;Yap cDKO, n = 540 apical domains from 3 embryos. For bar charts, data are shown as mean + SEM. For box-whisker plots: centre line, median; box, interquartile range; whiskers, minimum and maximum. Statistical analysis was performed with two-sided Mann-Whitney-Wilcoxon test.
Supplementary Material
ACKNOWLEDGEMENTS
We thank Dr. Bradley Yoder (University of Alabama at Birmingham), Dr. Jeff Wrana (Lunenfeld-Tanenbaum Research Institute), and Dr. Andrew McMahon (University of Southern California) for providing Ift88fl/fl, Yapfl/fl, and R26-LSL-SmoM2 mice, respectively; Matthew Brendel and Dr. Katia Manova-Todorova at the Molecular Cytology Core, and Yijie Wang and Dr. Willie Mark at the Mouse Genetics Core Facility of Memorial Sloan Kettering Cancer Centre, and Dr. Kunihiro Uryu at the Electron Microscopy Resource Centre and Dr. Jing Gao and Dr. Chingwen Yang at the Gene Targeting Resource Centre of Rockefeller University for their technical support. We thank Shi lab members for their input and comments on the manuscript. This work was supported by grants from the NIH (R01DA024681 and R01NS085004 to S.-H.S.), the Howard Hughes Medical Institute (to S.-H.S.), and Beijing Outstanding Young Scientist Program (BJJWZYJH01201910003012 to S.-H.S.).
Footnotes
DATA AVAILABILITY
The datasets generated during and/or analysed during the current study are available from the corresponding author on reasonable request. The authors have no competing financial or non-financial interests.
REFERENCES
- 1.Florio M & Huttner WB Neural progenitors, neurogenesis and the evolution of the neocortex. Development 141, 2182–2194, doi: 10.1242/dev.090571 (2014). [DOI] [PubMed] [Google Scholar]
- 2.Homem CC, Repic M & Knoblich JA Proliferation control in neural stem and progenitor cells. Nat Rev Neurosci 16, 647–659, doi: 10.1038/nrn4021 (2015). [DOI] [PMC free article] [PubMed] [Google Scholar]
- 3.Kriegstein A & Alvarez-Buylla A The glial nature of embryonic and adult neural stem cells. Annu Rev Neurosci 32, 149–184, doi: 10.1146/annurev.neuro.051508.135600 (2009). [DOI] [PMC free article] [PubMed] [Google Scholar]
- 4.Wang X et al. Asymmetric centrosome inheritance maintains neural progenitors in the neocortex. Nature 461, 947–955, doi: 10.1038/nature08435 (2009). [DOI] [PMC free article] [PubMed] [Google Scholar]
- 5.Tsai JW, Lian WN, Kemal S, Kriegstein AR & Vallee RB Kinesin 3 and cytoplasmic dynein mediate interkinetic nuclear migration in neural stem cells. Nat Neurosci 13, 1463–1471, doi: 10.1038/nn.2665 (2010). [DOI] [PMC free article] [PubMed] [Google Scholar]
- 6.Bultje RS et al. Mammalian Par3 regulates progenitor cell asymmetric division via notch signaling in the developing neocortex. Neuron 63, 189–202, doi: 10.1016/j.neuron.2009.07.004 (2009). [DOI] [PMC free article] [PubMed] [Google Scholar]
- 7.Chenn A, Zhang YA, Chang BT & McConnell SK Intrinsic polarity of mammalian neuroepithelial cells. Mol Cell Neurosci 11, 183–193, doi: 10.1006/mcne.1998.0680 (1998). [DOI] [PubMed] [Google Scholar]
- 8.Rakic P Developmental and evolutionary adaptations of cortical radial glia. Cereb Cortex 13, 541–549 (2003). [DOI] [PubMed] [Google Scholar]
- 9.Conduit PT, Wainman A & Raff JW Centrosome function and assembly in animal cells. Nat Rev Mol Cell Biol 16, 611–624, doi: 10.1038/nrm4062 (2015). [DOI] [PubMed] [Google Scholar]
- 10.Luders J & Stearns T Microtubule-organizing centres: a re-evaluation. Nat Rev Mol Cell Biol 8, 161–167, doi: 10.1038/nrm2100 (2007). [DOI] [PubMed] [Google Scholar]
- 11.Bettencourt-Dias M & Glover DM Centrosome biogenesis and function: centrosomics brings new understanding. Nat Rev Mol Cell Biol 8, 451–463, doi:http://www.nature.com/nrm/journal/v8/n6/suppinfo/nrm2180_S1.html (2007). [DOI] [PubMed] [Google Scholar]
- 12.Kobayashi T & Dynlacht BD Regulating the transition from centriole to basal body. The Journal of Cell Biology 193, 435–444, doi: 10.1083/jcb.201101005 (2011). [DOI] [PMC free article] [PubMed] [Google Scholar]
- 13.Hu DJ-K et al. Dynein recruitment to nuclear pores activates apical nuclear migration and mitotic entry in brain progenitor cells. Cell 154, 10.1016/j.cell.2013.1008.1024, doi: 10.1016/j.cell.2013.08.024 (2013). [DOI] [PMC free article] [PubMed] [Google Scholar]
- 14.Higginbotham H et al. Arl13b-regulated cilia activities are essential for polarized radial glial scaffold formation. Nat Neurosci 16, 1000–1007, doi: 10.1038/nn.3451 http://www.nature.com/neuro/journal/v16/n8/abs/nn.3451.html#supplementary-information (2013). [DOI] [PMC free article] [PubMed] [Google Scholar]
- 15.Paridaen Judith T. M. L., Wilsch-Bräuninger M & Huttner Wieland B. Asymmetric Inheritance of Centrosome-Associated Primary Cilium Membrane Directs Ciliogenesis after Cell Division. Cell 155, 333–344, doi: 10.1016/j.cell.2013.08.060 (2013). [DOI] [PubMed] [Google Scholar]
- 16.Higginbotham HR & Gleeson JG The centrosome in neuronal development. Trends Neurosci 30, 276–283, doi: 10.1016/j.tins.2007.04.001 (2007). [DOI] [PubMed] [Google Scholar]
- 17.Louvi A & Grove EA Cilia in the CNS: the quiet organelle claims center stage. Neuron 69, 1046–1060, doi: 10.1016/j.neuron.2011.03.002 (2011). [DOI] [PMC free article] [PubMed] [Google Scholar]
- 18.Insolera R, Bazzi H, Shao W, Anderson KV & Shi SH Cortical neurogenesis in the absence of centrioles. Nat Neurosci 17, 1528–1535, doi: 10.1038/nn.3831 (2014). [DOI] [PMC free article] [PubMed] [Google Scholar]
- 19.Englund C et al. Pax6, Tbr2, and Tbr1 are expressed sequentially by radial glia, intermediate progenitor cells, and postmitotic neurons in developing neocortex. J Neurosci 25, 247–251, doi: 10.1523/JNEUROSCI.2899-04.2005 (2005). [DOI] [PMC free article] [PubMed] [Google Scholar]
- 20.Gotz M, Stoykova A & Gruss P Pax6 controls radial glia differentiation in the cerebral cortex. Neuron 21, 1031–1044 (1998). [DOI] [PubMed] [Google Scholar]
- 21.Tanos BE et al. Centriole distal appendages promote membrane docking, leading to cilia initiation. Genes & Development 27, 163–168, doi: 10.1101/gad.207043.112 (2013). [DOI] [PMC free article] [PubMed] [Google Scholar]
- 22.Joo K et al. CCDC41 is required for ciliary vesicle docking to the mother centriole. Proc Natl Acad Sci U S A 110, 5987–5992, doi: 10.1073/pnas.1220927110 (2013). [DOI] [PMC free article] [PubMed] [Google Scholar]
- 23.Ran FA et al. Double Nicking by RNA-Guided CRISPR Cas9 for Enhanced Genome Editing Specificity. Cell 154, 1380–1389, doi: 10.1016/j.cell.2013.08.021 (2013). [DOI] [PMC free article] [PubMed] [Google Scholar]
- 24.Gorski JA et al. Cortical excitatory neurons and glia, but not GABAergic neurons, are produced in the Emx1-expressing lineage. J Neurosci 22, 6309–6314, doi:20026564 (2002). [DOI] [PMC free article] [PubMed] [Google Scholar]
- 25.Graser S et al. Cep164, a novel centriole appendage protein required for primary cilium formation. The Journal of cell biology 179, 321–330, doi: 10.1083/jcb.200707181 (2007). [DOI] [PMC free article] [PubMed] [Google Scholar]
- 26.Greig LC, Woodworth MB, Galazo MJ, Padmanabhan H & Macklis JD Molecular logic of neocortical projection neuron specification, development and diversity. Nat Rev Neurosci 14, 755–769, doi: 10.1038/nrn3586 (2013). [DOI] [PMC free article] [PubMed] [Google Scholar]
- 27.Besse L et al. Primary cilia control telencephalic patterning and morphogenesis via Gli3 proteolytic processing. Development 138, 2079–2088, doi: 10.1242/dev.059808 (2011). [DOI] [PubMed] [Google Scholar]
- 28.Willaredt MA et al. A crucial role for primary cilia in cortical morphogenesis. The Journal of neuroscience : the official journal of the Society for Neuroscience 28, 12887–12900, doi: 10.1523/jneurosci.2084-08.2008 (2008). [DOI] [PMC free article] [PubMed] [Google Scholar]
- 29.Han YG et al. Hedgehog signaling and primary cilia are required for the formation of adult neural stem cells. Nat Neurosci 11, 277–284, doi: 10.1038/nn2059 (2008). [DOI] [PubMed] [Google Scholar]
- 30.Snedeker J et al. Unique spatiotemporal requirements for intraflagellar transport genes during forebrain development. PLoS One 12, e0173258, doi: 10.1371/journal.pone.0173258 (2017). [DOI] [PMC free article] [PubMed] [Google Scholar]
- 31.Haycraft CJ et al. Intraflagellar transport is essential for endochondral bone formation. Development 134, 307–316, doi: 10.1242/dev.02732 (2007). [DOI] [PubMed] [Google Scholar]
- 32.Wang L, Hou S & Han Y-G Hedgehog signaling promotes basal progenitor expansion and the growth and folding of the neocortex. Nat Neurosci 19, 888–896, doi: 10.1038/nn.4307 http://www.nature.com/neuro/journal/v19/n7/abs/nn.4307.html#supplementary-information (2016). [DOI] [PMC free article] [PubMed] [Google Scholar]
- 33.Jeong J, Mao J, Tenzen T, Kottmann AH & McMahon AP Hedgehog signaling in the neural crest cells regulates the patterning and growth of facial primordia. Genes Dev 18, 937–951, doi: 10.1101/gad.1190304 (2004). [DOI] [PMC free article] [PubMed] [Google Scholar]
- 34.Haubensak W, Attardo A, Denk W & Huttner WB Neurons arise in the basal neuroepithelium of the early mammalian telencephalon: a major site of neurogenesis. Proc Natl Acad Sci U S A 101, 3196–3201, doi: 10.1073/pnas.0308600100 (2004). [DOI] [PMC free article] [PubMed] [Google Scholar]
- 35.Noctor SC, Martinez-Cerdeno V, Ivic L & Kriegstein AR Cortical neurons arise in symmetric and asymmetric division zones and migrate through specific phases. Nat Neurosci 7, 136–144, doi: 10.1038/nn1172 (2004). [DOI] [PubMed] [Google Scholar]
- 36.Wang X, Tsai J-W, LaMonica B & Kriegstein AR A new subtype of progenitor cell in the mouse embryonic neocortex. Nat Neurosci 14, 555–561, doi:http://www.nature.com/neuro/journal/v14/n5/abs/nn.2807.html#supplementary-information (2011). [DOI] [PMC free article] [PubMed] [Google Scholar]
- 37.Hansen DV, Lui JH, Parker PRL & Kriegstein AR Neurogenic radial glia in the outer subventricular zone of human neocortex. Nature 464, 554–561, doi:http://www.nature.com/nature/journal/v464/n7288/suppinfo/nature08845_S1.html (2010). [DOI] [PubMed] [Google Scholar]
- 38.Shitamukai A, Konno D & Matsuzaki F Oblique radial glial divisions in the developing mouse neocortex induce self-renewing progenitors outside the germinal zone that resemble primate outer subventricular zone progenitors. J Neurosci 31, 3683–3695, doi: 10.1523/JNEUROSCI.4773-10.2011 (2011). [DOI] [PMC free article] [PubMed] [Google Scholar]
- 39.Reillo I, de Juan Romero C, Garcia-Cabezas MA & Borrell V A role for intermediate radial glia in the tangential expansion of the mammalian cerebral cortex. Cereb Cortex 21, 1674–1694, doi: 10.1093/cercor/bhq238 (2011). [DOI] [PubMed] [Google Scholar]
- 40.Fietz SA et al. OSVZ progenitors of human and ferret neocortex are epithelial-like and expand by integrin signaling. Nat Neurosci 13, 690–699, doi:http://www.nature.com/neuro/journal/v13/n6/abs/nn.2553.html#supplementary-information (2010). [DOI] [PubMed] [Google Scholar]
- 41.Aragona M et al. A Mechanical Checkpoint Controls Multicellular Growth through YAP/TAZ Regulation by Actin-Processing Factors. Cell 154, 1047–1059, doi: 10.1016/j.cell.2013.07.042 (2013). [DOI] [PubMed] [Google Scholar]
- 42.Halder G, Dupont S & Piccolo S Transduction of mechanical and cytoskeletal cues by YAP and TAZ. Nat Rev Mol Cell Biol 13, 591–600 (2012). [DOI] [PubMed] [Google Scholar]
- 43.Kasioulis I, Das RM & Storey KG Inter-dependent apical microtubule and actin dynamics orchestrate centrosome retention and neuronal delamination. eLife 6, e26215, doi: 10.7554/eLife.26215 (2017). [DOI] [PMC free article] [PubMed] [Google Scholar]
- 44.Mota B & Herculano-Houzel S BRAIN STRUCTURE. Cortical folding scales universally with surface area and thickness, not number of neurons. Science 349, 74–77, doi: 10.1126/science.aaa9101 (2015). [DOI] [PubMed] [Google Scholar]
- 45.Nagasaka A et al. Differences in the Mechanical Properties of the Developing Cerebral Cortical Proliferative Zone between Mice and Ferrets at both the Tissue and Single-Cell Levels. Frontiers in Cell and Developmental Biology 4, 139, doi: 10.3389/fcell.2016.00139 (2016). [DOI] [PMC free article] [PubMed] [Google Scholar]
- 46.Failler M et al. Mutations of CEP83 Cause Infantile Nephronophthisis and Intellectual Disability. The American Journal of Human Genetics 94, 905–914, doi: 10.1016/j.ajhg.2014.05.002 (2014). [DOI] [PMC free article] [PubMed] [Google Scholar]
- 47.Reginensi A et al. Yap- and Cdc42-dependent nephrogenesis and morphogenesis during mouse kidney development. PLoS genetics 9, e1003380, doi: 10.1371/journal.pgen.1003380 (2013). [DOI] [PMC free article] [PubMed] [Google Scholar]
- 48.Caspary T, Larkins CE & Anderson KV The Graded Response to Sonic Hedgehog Depends on Cilia Architecture. Developmental cell 12, 767–778, doi: 10.1016/j.devcel.2007.03.004 (2007). [DOI] [PubMed] [Google Scholar]
- 49.Liboska R, Ligasová A, Strunin D, Rosenberg I & Koberna K Most Anti-BrdU Antibodies React with 2′-Deoxy-5-Ethynyluridine — The Method for the Effective Suppression of This Cross-Reactivity. PLOS ONE 7, e51679, doi: 10.1371/journal.pone.0051679 (2012). [DOI] [PMC free article] [PubMed] [Google Scholar]
- 50.Aigouy B, Umetsu D & Eaton S Segmentation and Quantitative Analysis of Epithelial Tissues. Methods in molecular biology (Clifton, N.J.) 1478, 227–239, doi: 10.1007/978-1-4939-6371-3_13 (2016). [DOI] [PubMed] [Google Scholar]
- 51.Legland D, Arganda-Carreras I & Andrey P MorphoLibJ: integrated library and plugins for mathematical morphology with ImageJ Bioinformatics (Oxford, England) 32, 3532–3534, doi: 10.1093/bioinformatics/btw413 (2016). [DOI] [PubMed] [Google Scholar]
- 52.Mori S & Zhang J Principles of diffusion tensor imaging and its applications to basic neuroscience research. Neuron 51, 527–539, doi: 10.1016/j.neuron.2006.08.012 (2006). [DOI] [PubMed] [Google Scholar]
- 53.Wu D et al. In vivo high-resolution diffusion tensor imaging of the mouse brain. Neuroimage 83, 18–26, doi: 10.1016/j.neuroimage.2013.06.012 (2013). [DOI] [PMC free article] [PubMed] [Google Scholar]
- 54.Chuang N et al. An MRI-based atlas and database of the developing mouse brain. Neuroimage 54, 80–89, doi: 10.1016/j.neuroimage.2010.07.043 (2011). [DOI] [PMC free article] [PubMed] [Google Scholar]
- 55.Ceritoglu C et al. Multi-contrast large deformation diffeomorphic metric mapping for diffusion tensor imaging. NeuroImage 47, 618–627, doi: 10.1016/j.neuroimage.2009.04.057 (2009). [DOI] [PMC free article] [PubMed] [Google Scholar]
- 56.Zhang J et al. Longitudinal characterization of brain atrophy of a Huntington’s disease mouse model by automated morphological analyses of magnetic resonance images. NeuroImage 49, 2340–2351, doi: 10.1016/j.neuroimage.2009.10.027 (2010). [DOI] [PMC free article] [PubMed] [Google Scholar]
- 57.Chen EJ, Novakofski J, Jenkins WK & Brien WDO Young’s modulus measurements of soft tissues with application to elasticity imaging. IEEE Transactions on Ultrasonics, Ferroelectrics, and Frequency Control 43, 191–194, doi: 10.1109/58.484478 (1996). [DOI] [Google Scholar]
Associated Data
This section collects any data citations, data availability statements, or supplementary materials included in this article.


