

Abstract
Receptor for activated C kinase 1 (RACK1) has been shown to promote oral squamous cell carcinoma (OSCC) progression, and RACK1 expression levels have been negatively correlated with prognosis in patients with OSCC. Here, we investigated the impact of RACK1 OSCC expression on the recruitment and differentiation of tumor‐associated macrophages. High RACK1 expression in OSCC cells correlated with increased M2 macrophage infiltration in tumor samples from a clinical cohort study. Moreover, the combination of RACK1 expression and the M2/M1 ratio could successfully predict prognosis in OSCC. OSCC cells with high RACK1 expression inhibited the migration of THP‐1 cells, promoted M2‐like macrophage polarization in vitro, and increased the proportion of M2‐like macrophages in a xenograft mouse model. Moreover, both M1‐ and M2‐like macrophage polarization‐associated proteins were induced in macrophages cocultured with RACK1‐silenced cell supernatant. A mechanistic study revealed that the expression and secretion of C‐C motif chemokine 2 (CCL2), C‐C motif chemokine 5 (CCL5), interleukin‐6 (IL‐6), and interleukin‐1 (IL‐1) are closely related to RACK1 expression. In addition, blocking nuclear factor‐kappa B (NF‐κB) could promote M2‐like macrophage polarization. These results indicate that RACK1 and the M2/M1 ratio are predictors of a poor prognosis in OSCC. RACK1 promotes M2‐like polarization by regulating NF‐κB and could be used as a potential therapeutic target for antitumor immunity.
Keywords: macrophage polarization, NF‐κB, oral squamous cell carcinoma, RACK1, tumor‐associated macrophages
High receptor for activated C kinase 1 expression OSCC cells could inhibit the expression and secretion of proinflammatory factors and macrophage chemokines by regulating nuclear factor‐kappa B, thus inhibiting the massive recruitment of macrophages and promoting M2‐like macrophage polarization, inducing a chronic smoldering inflammation microenvironment and promoting the development of tumors.

Abbreviations
- IHC,
immunohistochemical
- IL,
interleukin
- M0
total macrophages
- M1
classically activated macrophages
- M2
alternatively activated macrophages
- NF‐κB
nuclear factor‐kappa B
- OSCC
oral squamous cell carcinoma
- PMA,
phorbol‐12‐myristate‐13 acetate
- RACK1
receptor for activated C kinase 1
- TAM
tumor‐associated macrophages
- TCGA,
The Cancer Genome Atlas
1. Introduction
Oral squamous cell carcinoma (OSCC) is one of the most common human cancers (Torre et al., 2015) affecting more than 400 000 people every year. Due to its high recurrence and metastasis rates, OSCC has a high mortality rate and a poor prognosis. In recent decades, despite the enormous progress in diagnosis and treatments such as radiotherapy and chemotherapy, the 5‐year survival rate is no more than 50% (Panzarella et al., 2014). A better understanding of the mechanisms underlying the occurrence and development of OSCC will facilitate the development of novel treatment options.
According to their different functions, macrophages fall into two categories: classically activated macrophages (M1) for killing tumor cells, and alternatively activated macrophages (M2) for promoting tumor cells (Brown et al., 2017). Tumor‐associated macrophages (TAM) are macrophages present in high numbers in the tumor microenvironment (TME) (Sica et al., 2008). It is well acknowledged that TAM mainly have an M2‐like phenotype. Clinical and experimental evidence has shown that TAM promote the development and progression of most tumor types (Ruffell and Coussens, 2015; Tan et al., 2018b). There are many macrophages in OSCC tissues, and TAM are also believed to participate in OSCC progression (Kubota and Moriyama, 2017; Petruzzi et al., 2017; Sun et al., 2018). The most commonly used markers for M1 macrophages are CD11c, CD80 and HLA‐DR. CD206, CD163 and CD204 are useful for M2 detection. Moreover, CD68 is considered a pan‐macrophage marker (Guo et al., 2018; Gustafson et al., 2015; Han et al., 2016; Motomura et al., 2015; Olesch et al., 2015; Salmi et al., 2018; Tan‐Garcia et al., 2017; Wang et al., 2014a).
Receptor for activated C kinase 1 (RACK1), a highly conserved WD40 repeat scaffold protein, is a multifaceted signaling adaptor. RACK1 has been confirmed to take part in multiple biological events, including cell migration(Li et al., 2012b), virus infection (Majzoub et al., 2014), neural development (Wehner et al., 2011; Xu et al., 2015), angiogenesis (Berns et al., 2000; Zhou et al., 2014) and cancer metastasis (Li et al., 2012a). In our previous study, we found that RACK1, an organ‐specific prognostic predictor in OSCC, could promote the malignant biological behavior of OSCC (Liu et al., 2018b; Zhang et al., 2016). However, the effect of RACK1 on the tumor immunological microenvironment in OSCCs is poorly understood. Whether RACK1 is related to the recruitment and differentiation of TAM and the underlying mechanisms are unclear.
Here, we showed that RACK1 can suppress the activation of nuclear factor‐kappa B (NF‐κB), regulate the expression of IL‐6, CCL5 and CSF secreted by tumor cells, inhibit the massive recruitment of macrophages and severe inflammatory reactions, induce a chronic smoldering inflammatory microenvironment and promote the development of tumors. RACK1 could serve as a potential target in antitumor immunity against OSCC.
2. Materials and methods
2.1. Patients and follow‐up
One cohort included 45 patients with OSCC who underwent surgery between 2005 and 2009. All patients were informed of sample collection and usage. The tissue samples were collected and used in accordance with a protocol approved by the Human Research Ethics Committees of the West China Hospital of Stomatology, Sichuan University and Guangdong Provincial Stomatological Hospital. This research was performed in accordance with the Declaration of Helsinki and according to national and international guidelines. All animal studies were approved by the Animal Care and Use Committee, State Key Laboratory of Oral Diseases, in compliance with the Guide for the U.S. Public Health Service's policy on the humane care and use of laboratory animals. Animals were housed in compliance with the Association for the Assessment and Accreditation of Laboratory Animal Care International guidelines. The other cohort (TCGA), comprising 460 patients with HNSCC, was obtained from the TCGA database.
2.2. Immunohistochemical (IHC) assay and analysis
The IHC assay was performed as previously described (Liu et al., 2018a). Briefly, sections were incubated overnight at 4 °C with a RACK1 antibody (Santa Cruz Biotechnology, Santa Cruz, CA, USA, RACK1: sc‐17754, 1 : 200 dilution), CD11b antibody (Abcam, Cambridge, MA, USA, anti‐CD11b antibody, ab133357, 1 : 4000 dilution), CD206 antibody (Abcam, anti‐mannose receptor antibody, ab64693, 1 : 5000 dilution) and CD68 antibody (Abcam, anti‐CD68 antibody ab955, 1 : 200 dilution) after antigen retrieval. The cells were then detected with a ChemMate DAKO EnVision Detection Kit (DAKO, Copenhagen, Denmark). Finally, the sections were counterstained with Mayer's hematoxylin. The staining was assessed by three independent investigators without any knowledge of the clinico‐pathological data.
The following criteria were used to score the RACK1 staining: staining intensity: 0 – no detectable staining, 1 – light yellow, 2 – medium yellow, 3 – deep yellow or 4 – brown; and staining proportion: 1 (≤ 10%), 2 (10–50%), 3 (50–80%) or 4 (≥ 80%). The product of the two scores was considered the final score (nine levels: 1, 2, 3, 4, 6, 8, 9, 12 and 16). For TAM, the scoring method was as follows: in the software graphics processing function of imagescope (Vista, CA, USA), the scope of the tumor stroma was framed and the percentage of positive cells within the frame calculated. The value calculated by the software was used for the patient survival analysis. The above score was divided into nine categories to match the final RACK1 score and to conveniently perform a correlation analysis between the two indicators.
2.3. Reagents
Phorbol‐12‐myristate‐13 acetate (PMA) and the NF‐κB inhibitor BAY11‐7082 were obtained from Beyotime (Shanghai, CHN). Primary antibodies were from Santa Cruz Biotechnology [CREB (sc‐271); p‐CREB (10E9) (sc‐81486); STAT3 (sc‐8019); PPARγ (sc‐7273); p‐PPARγ S112 (sc‐28001); GAPDH (sc‐47724); Actin (sc‐8432)], Abcam [RACK1 (ab129084); STAT1 (ab92506); p‐STAT1 (S727) (ab109461); CD206 (ab64693)], Cell Signaling Technology (Danvers, MA, USA) [c‐Jun (#9165); NF‐κB p65 (#8242); p‐NF‐κB p65 (#3033); p‐mTOR (Ser2448) (#5536); p‐ERK (Thr202/Tyr204) (#4370)]. Antibodies used for flow cytometry, including anti‐human CCR7‐FITC (#353216) and CD206‐PE (#321106), and anti‐mouse CD11b‐APC (#301310), F4/80‐FITC (#123107) and CD206‐PE (#141705) were purchased from BioLegend (San Diego, CA, USA).
2.4. Cell culture
Cal‐27 cells were obtained from the American Type Culture Collection (Manassas, VA, USA). HSC‐3 and HSC‐4 cells were purchased from the Japanese Collection of Research Bioresources (JCRB, Shinjuku, Japan). RAW264.7 cells were purchased from the Chinese Academy of Sciences (ATCC Number: TIB‐71, Beijing, China). THP‐1 cells were the kind gift of X. Zhou (State Key Laboratory of Sichuan University). Cal‐27, HSC‐3, HSC‐4 and RAW264.7 cells were maintained in Dulbecco's modified Eagle's medium (DMEM) containing 10% FBS. THP‐1 monocytes were cultured in RPMI medium supplemented with 10% FBS. The generation of stable HSC‐3 cells with low RACK1 expression (sh‐RACK1) and HSC‐4 cells with RACK1 overexpression (OE‐RACK1) was performed as previously described (Zhang et al., 2016). All cells were cultured under a humidified atmosphere with 5% CO2 at 37 °C.
2.5. Cell migration assay
The supernatants from infected HSC‐3 (sh‐NC, sh‐RACK1, OE‐vector or OE‐RACK1) cells cultured in serum‐free DMEM were harvested after 48 h. The infected HSC‐3 cell supernatants were filtered using 0.45‐μm polyvinylidene difluoride membrane filters and concentrated by ultrafiltration (Amicon Ultra 3K; Merck Millipore, Billerica, MA, USA). The Bradford method was employed to determine the protein concentrations. THP‐1 cells (2 × 10⁷ per well) or RAW264.7 cells (1 × 10⁶ per well) were added to the upper compartment of a 24‐well Transwell chamber and then cocultured for 24 h with DMEM containing 40 μg·mL−1 infected OSCC supernatants. The lower compartment contained DMEM supplemented with 2% FBS. The migrated THP‐1 cells were counted by flow cytometry, and the migrated RAW264.7 cells were fixed, stained with Cell Stain Solution (Sigma‐Aldrich, St Louis, MO, USA) and photographed under a light microscope.
2.6. Cell invasion assay
THP‐1 cells (2 × 10⁷ per well) or RAW264.7 cells (1 × 10⁶ per well) were added to the upper compartment of a 24‐well Transwell chamber coated with Matrigel and cocultured for 48 h with DMEM containing 40 μg·mL−1 infected OSCC supernatants. The lower compartment contained DMEM supplemented with 2% FBS. The numbers of invaded THP‐1 cells were counted by flow cytometry, and the invaded RAW264.7 cells were fixed, stained with Cell Stain Solution and photographed under a light microscope.
2.7. Western blot analysis
Cell protein was extracted with RIPA lysis buffer. The protein expression levels of RACK1, STAT3, c‐Jun, NF‐κB, p‐NF‐κB, STAT1, p‐STAT1, p‐ERK, PPARγ, CREB, p‐CREB, p‐mTOR and actin in OSCC cells and macrophages were examined.
2.8. Analysis of human cytokines and genes
HSC‐3 cells grown to 70% confluence in a 10‐cm dish were lipofected with 100 nm si‐RACK1 or si‐NC using Lipofectamine 2000. The cells and supernatants were harvested after 48 h. The variations in human angiogenesis genes and proteins in si‐RACK1 and si‐NC cells and supernatants were detected by a Human Cytokine Array Panel A (ARY005; R&D Systems, Minneapolis, MN, USA) and a whole human gene expression profile PCR array (KangChen Bio‐tech, Shanghai, China).
2.9. Flow cytometry analysis
THP‐1 cells were adjusted to 1 × 10⁶ cells per mL in RPMI medium with 100 ng·mL−1 PMA for 24 h to induce THP‐1 differentiation into macrophages. The cells were then cocultured with 40 μg·mL−1 infected OSCC supernatants for 8 h. PE‐, APC‐ and FITC‐conjugated anti‐human CCR7 and CD206 and anti‐mouse F4/80 and CD11b antibodies were used to analyze the surface antigen expression of macrophages and homogeneous isotypes were used as controls. The cells were washed and then stained for 30 min at 4 °C. The stained cells were analyzed by flow cytometry (EXL™; Beckman Coulter, Brea, CA, USA). Data analysis was performed using flowjo software (Tree Star, Ashland, OR, USA).
2.10. Tumor xenograft model
Female BALB/c nude mice (4–6 weeks of age) were used and assigned randomly to two groups (five mice in each group): sh‐NC and sh‐RACK1. A human OSCC tumor model was established by subcutaneously injecting 1 × 10⁶ cells (0.1 mL) into the right upper flanks of the mice. From the fresh tumor tissues, single cells were isolated using collagenase IV and then stained with CD206, CD11b and F4/80 antibodies for 30 min at 4 °C. The stained cells were washed and resuspended in PBS/0.1% bovine serum albumin plus azide. Flow cytometry was performed and the results were analyzed by flowjo software.
2.11. Neutralization
The supernatant from sh‐NC cells was harvested after 48 h of culture in serum‐free DMEM with the NF‐κB inhibitor BAY 11‐7082 (0.1%, 10 μm in DMSO; Beyotime) or 0.1% DMSO. The methods used for protein concentration and measurement for the supernatants were the same as those described in the cell migration assay. The method used to analyze macrophage surface antigen expression was the same as that described for flow cytometry analysis.
2.12. Statistical analysis
Overall survival (OS) was estimated using the Kaplan–Meier method with a log‐rank test for the univariate analysis. A two‐sided P‐value < 0.05 was considered significant. The results are expressed as the mean ± SD of at least three different experiments.
3. Results
3.1. High levels of RACK1 expression are associated with high numbers of tumor‐infiltrating M2 macrophages and a poor prognosis in OSCC
According to previous studies, an increased level of RACK1 indicates a poor clinical outcome and tumor progression in patients with OSCC (Liu et al., 2018b; Wang et al., 2008; Zhang et al., 2016). A high number of M2 macrophages infiltrating the tumor is also associated with poor prognosis in OSCC. To evaluate the clinical significance of RACK1 and M2 macrophages, we analyzed 36 primary OSCC patient specimens by IHC staining (Table 1). The numbers of CD68+ macrophages (total macrophages, M0), CD11b+ macrophages (M1 macrophages) and CD206+ macrophages (M2 macrophages) were counted in 36 paraffin‐embedded tissues. High RACK1 protein expression was associated with more CD206+ macrophage cells; conversely, low RACK1 protein expression was associated with fewer CD206 positive macrophage cells (Fig. 1A). The expression of RACK1 correlated significantly with the M2 phenotype in OSCC (Fig. 1B, r = 0.698, P < 0.001). Survival analysis revealed that the number of CD68+ macrophage (M0) cells had no correlation with the OS of OSCC patients, consistent with the TCGA database analysis (Fig. S1A,B, P < 0.05). Notably, patients with a high M2/M1 ratio had a poorer OS than patients with a low M2/M1 ratio (Fig. 1C, P = 0.026), consistent with the TCGA database analysis (Fig. 1D, P < 0.01). These findings indicated that the ratio of M2/M1 macrophages affects the prognosis of OSCC but not the total amount of macrophages. RACK1 may affect the M2/M1 macrophage ratio in the OSCC microenvironment.
Table 1.
Baseline characteristics of the patients with OSCC in our cohort.
| Characteristic | Guangzhou cohort (n = 36) | P‐value* |
|---|---|---|
| n (%) | ||
| Age (mean ± SD) | 61.56 ± 13.13 | |
| < 60 years | 14 (38.89) | 0.191 |
| ≥ 60 years | 22 (61.11) | |
| Sex | ||
| Male | 25 (69.44) | 0.070 |
| Female | 11 (30.56) | |
| Smoking | ||
| Never | 19 (52.78) | 0.778 |
| Ever | 17 (47.22) | |
| Drinking | ||
| Never | 23 (63.89) | 0.439 |
| Ever | 13 (36.11) | |
| Differentiation | ||
| High | 29 (80.55) | 0.246 |
| Moderate | 6 (16.67) | |
| Low | 1 (2.78) | |
| Tumor stage | ||
| T1 | 6 (16.67) | 0.431 |
| T2 | 16 (44.44) | |
| T3 | 8 (22.22) | |
| T4 | 6 (16.67) | |
| Nodal stage | ||
| N0 | 17 (47.22) | 0.355 |
| N1–N3 | 19 (52.78) | |
| Clinical TNM stage | ||
| I | 4 (11.11) | 0.858 |
| II | 10 (27.78) | |
| III | 11 (30.56) | |
| IV | 11 (30.56) | |
| Surgery type | ||
| Local | 2 (5.56) | 0.669 |
| Unilateral neck | 29 (80.56) | |
| Bilateral neck | 4 (11.11) | |
| Other | 1 (2.78) | |
| Radiotherapy | ||
| Yes | 4 (11.11) | 0.906 |
| No | 32 (88.89) | |
| Chemotherapy | ||
| Yes | 22 (61.11) | 0.940 |
| No | 14 (38.89) | |
| Radiotherapy or chemotherapy | ||
| Yes | 24 (66.67) | 0.962 |
| No | 12 (33.33) | |
P‐values of comparisons between studies were generated using a mixed linear model for continuous variables and Chi‐square test or Fisher's exact test for categorical variables.
Figure 1.
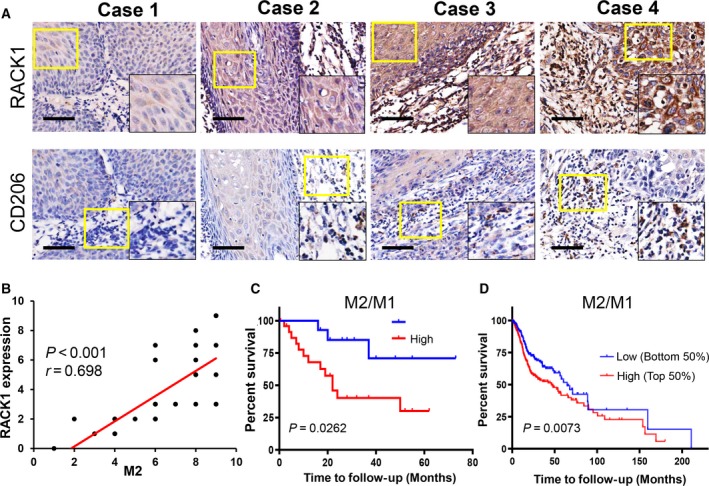
The M2/M1 ratio is positively correlated with the RACK level and is associated with a poor prognosis in OSCC. (A) IHC staining of 36 paraffin‐embedded OSCC sections with human antibodies against RACK1 and CD206 (scale bar: 100 μm). (B) Statistical analysis revealed that the expression intensity of RACK was positively correlated with the number of M2 macrophages (r = 0.698, P < 0.001). (C) Kaplan–Meier survival analysis revealed that a high M2/M1 ratio indicated a poor OS in 36 OSCC patients (P = 0.0262). (D) TCGA database analysis showed that a high M2/M1 ratio indicated a poor OS in human primary oral cancers (P < 0.01).
3.2. RACK1 expression in OSCC cells inhibits macrophage recruitment in vitro
To uncover the biological function of RACK1 during macrophage recruitment in OSCC, both cell migration and invasion assays were performed. First, a stable HSC‐3 cell line with low RACK1 expression (sh‐RACK1) and a stable HSC‐4 cell line with RACK1 overexpression (OE‐RACK1) were generated as previously described (Zhang et al., 2016). Then, we investigated the migration abilities of macrophages after coculture with conditioned media from OSCC cells with different levels of RACK1 expression. We found that RACK1 depletion promoted the ability of OSCC cells to induce THP‐1 cell migration (Fig. 2A, P < 0.001). However, RACK1 expression did not affect the invasion of THP‐1 cells. Similarly, silencing RACK1 promoted the ability of OSCC cells to induce the migration and invasion of RAW264.7 cells (P < 0.001), whereas overexpressing RACK1 strongly induced inhibition (Fig. 2B,C). In addition, according to TCGA data, the mRNA expression of RACK1 is negatively correlated with the mRNA level of CD68, which is a biomarker for M0 (Fig. S1C, Spearman's rank correlation coefficient r = −0.1249, P = 0.0043). Collectively, these results indicate that RACK1 inhibits macrophage recruitment in the TME of OSCC.
Figure 2.
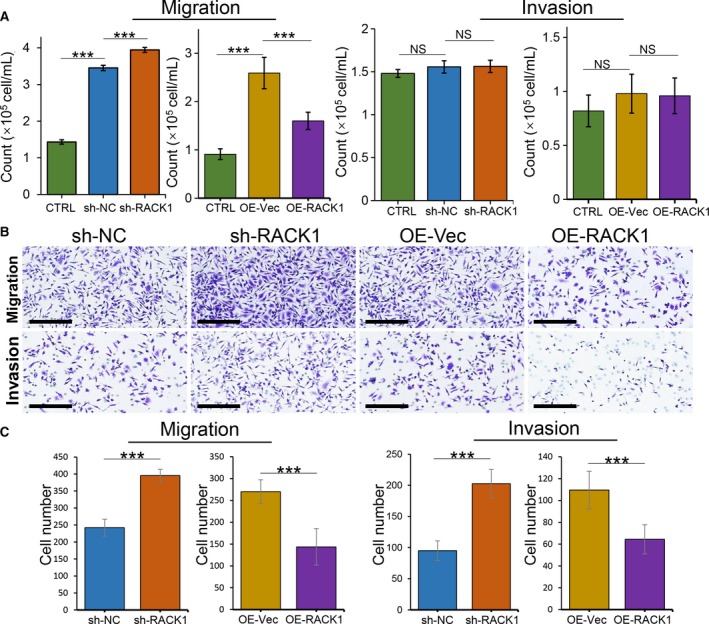
RACK1 inhibits the capacity of OSCC cells to recruit macrophages. (A) Transwell migration and Transwell Matrigel invasion assays used THP‐1 cells in the upper chamber and infected OSCC supernatants in the lower chamber. The average numbers of migrated and invaded cells were quantified (mean ± SD; ***P < 0.001). (B) Transwell migration and Transwell Matrigel invasion assays used RAW264.7 cells in the upper chamber and infected OSCC supernatants in the lower chamber (scale bars: 200 μm). (C) The average numbers of migrated and invaded RAW264.7 cells were quantified (mean ± SD; ***P < 0.001).
3.3. RACK1 expression in OSCC inhibits macrophage activation but increases the proportion of M2 macrophages in vitro and in vivo
Next, to determine the effect of RACK1 on macrophage activation in OSCC, we induced THP‐1 monocyte differentiation into macrophages by PMA treatment and then cocultured them with infected OSCC supernatants. The western blot results showed that M1‐ and M2‐related molecular pathways were activated in macrophages cocultured with OSCC supernatants. M2‐type macrophage pathway‐related molecules, such as mTOR and CREB, were not changed significantly, and PPARγ and STAT3 were significantly increased after coculture with RACK1‐silenced OSCC supernatant. Interestingly, levels of M1 macrophage pathway molecules, such as ERK, AP‐1 (AP‐1 consists of c‐Jun and c‐Fos) and NF‐κB, were dramatically higher than those in the control group after coculture with RACK1‐silenced OSCC supernatant; STAT1 levels, however, did not change (Fig. 3A). These results suggest that following the downregulation of RACK1 expression, both M1‐ and M2‐associated factors are significantly increased.
Figure 3.
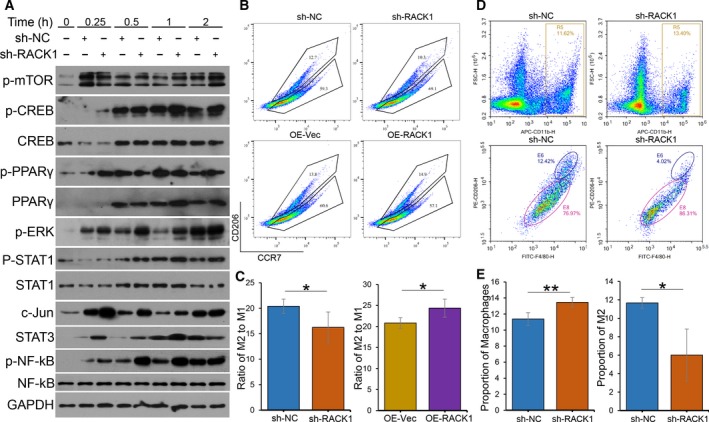
RACK1 inhibits macrophage activation but increases the proportion of M2 macrophages. (A) Immunoblots of p‐mTOR, CREB, p‐CREB, PPARγ, p‐PPARγ, p‐ERK, STAT1, p‐STAT1, c‐Jun, STAT3, NF‐κB and p‐NF‐κB in macrophages, induced from THP‐1 cells by 100 ng·mL−1 PMA for 24 h, cocultured with infected OSCC supernatants for the indicated times (0, 0.25, 0.5, 1 and 2 h). (B) Macrophages were induced from THP‐1 cells by PMA following incubation with transfected OSCC supernatants (sh‐NC, sh‐RACK1, OE‐Vec or OE‐RACK1) for 8 h. After centrifugation, the macrophages were stained with CD206 and CCR7 antibodies. The percentages and cell numbers of different macrophages were analyzed using flow cytometry. (C) Analysis of the M2/M1 ratio of different THP‐1‐induced groups detected by flow cytometry (mean ± SD; *P < 0.05). (D) Single cells were isolated from tumor tissues using collagenase IV and then stained with CD206, CD11b and F4/80 antibodies. The percentages and cell numbers of macrophages were analyzed using flow cytometry. R5: CD11b‐positive macrophages; E6: both CD206‐ and F4/80‐positive macrophages (M2). (E) Analysis of the numbers of M0 and M2 macrophages in tumor tissues from different groups detected by flow cytometry (mean ± SD; *P < 0.05, **P < 0.01).
The flow cytometry results showed that RACK1 silencing inhibited (P = 0.038) whereas RACK1 overexpression increased (P = 0.022) the proportion of M2 macrophages in vitro (Fig. 3B,C). In addition, to investigate whether RACK1 contributes to macrophage recruitment in the tumorigenic environment, sh‐NC and sh‐RACK1 HSC‐3 cells were grafted into the flanks of nude mice by subcutaneous injection (Fig. S2). Then, the proportion of CD11b+ (a common marker of mouse macrophages) cells in the tumor tissues was assessed by flow cytometry. There were more CD11b+ (M0) cells in RACK1‐silenced tumors than in control tumors (Fig. 3D,E, P < 0.01). Interestingly, the RACK1‐silenced group had fewer CD11b+CD206+F4/80+ cells (M2) than the control group (Fig. 3D,E, P = 0.021). Combined, these results indicate that RACK1 inhibits macrophage activation but increases the proportion of M2 macrophages.
3.4. RACK1 expression in OSCC cells increases the intratumoral M2/M1 ratio in an NF‐κB axis‐dependent manner
To investigate differences in the expression of cytokines in the conditioned medium from OSCC cells with or without RACK1 expression, human cytokine and gene arrays were performed. The levels of three cytokines, CCL5, IL‐6 and CSFs, were remarkably increased in RACK1‐ablated supernatant compared with those in the control group (Fig. 4A). Furthermore, the gene chip analysis also showed that the gene expression levels of CCL5 and CSFs were remarkably increased after RACK1 depletion (Fig. 4B,C, P < 0.05). TRRUST (http://www.grnpedia.org/trrust/) was used to analyze several related cytokines [RACK1, CCL2, CCL5, CSF2, CXCL10, CXCL2, IL‐1B, IL‐6 and tumor necrosis factor (TNF)], and we found that NF‐κB was the key protein in regulating these factors. These results were confirmed with transfected OSCC cells and 293 cells by western blot analysis. Compared with that in the control cells, p‐NF‐κB was reduced in the RACK1‐silenced cells, whereas it was increased in the RACK1‐overexpressing cells (Fig. 4D). To explore the effect of inhibiting NF‐κB activity, BAY 11‐7082 was added to conditioned media from HSC‐3 cells. As a result, BAY 11‐7082 significantly increased the proportion of M2 macrophages compared with DMSO (Fig. 4E,F, P = 0.018). These results suggest that RACK1 decreases IL‐6, CCL5 and CSF levels and increases the M2/M1 ratio in an NF‐κB axis‐dependent manner.
Figure 4.
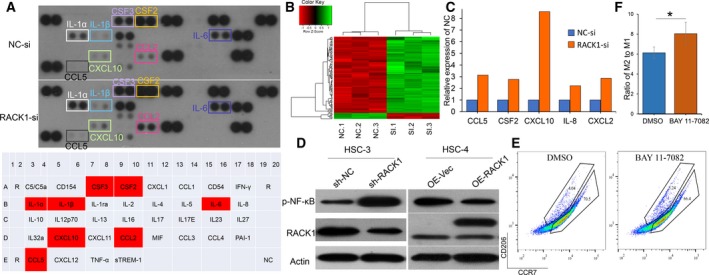
RACK1 increases the M2/M1 ratio in an NF‐κB axis‐dependent manner. (A) Human cytokine array analysis of the conditioned medium from HSC‐3 control cells and HSC‐3 cells with RACK1 silencing for 36 h. (B) Unsupervised hierarchical clustering analysis by complete linkage between si‐NC‐ and si‐RACK1‐transfected HSC‐3 cells for 36 h. (C) Analysis of CCL5, CSF2, CXCL10, IL‐8 and CXCL2 mRNA levels in HSC‐3 cells transfected with si‐NC‐ or si‐RACK1 for 36 h (P < 0.05). (D) Western blots for p‐NF‐κB and RACK1 in two infected OSCC cell lines. (E) Macrophages were induced from THP‐1 cells by PMA and cocultured with sh‐NC HSC‐3 cell supernatant (with DMSO or BAY 11‐7082 included) for 8 h. After centrifugation, the macrophages were stained with CD206 and CCR7 antibodies. The percentages and cell numbers of macrophages were analyzed using flow cytometry. (F) Analysis of the M2/M1 ratio in different induction groups (DMSO or BAY 11‐7082) (mean ± SD; *P < 0.05).
4. Discussion
Oral squamous cell carcinoma has an intricate TME that includes immune cells. Among these cells, TAM (M2) are believed to participate in the development and progression of OSCC (Fujii et al., 2012; He et al., 2014; Kubota et al., 2017; Lei et al., 2016; Matsuoka et al., 2015; Sato‐Kaneko et al., 2017). Current studies of macrophages in OSCC are not thorough and are limited to IHC staining experiments. There have been controversial conclusions about the relationship between TAM and the prognosis of OSCC patients (Alves et al., 2018). Our study revealed the correlation between RACK1 and TAM and the underlying mechanisms through a clinical cohort analysis and in vitro and in vivo experiments. To exclude the influence of other immune cells as much as possible, especially for T cells, we used BALB/c nude mice, without mature T cells but with macrophages, to construct the animal model. Further investigation indicated that RACK1 could inhibit macrophage recruitment and increase the M2/M1 ratio in an NF‐κB axis‐dependent manner, thus promoting the development of OSCC.
The relationship between TAM and the prognosis of OSCC patients is controversial. Although there is substantial evidence that a larger number of CD68+ macrophages indicates a poorer prognosis (Liu et al., 2008; Lu et al., 2010; Ni et al., 2015), some reports have suggested that there is no correlation (Costa et al., 2013; Fang et al., 2017; Marcus et al., 2004). In addition, Udeabor et al. (2017) found that there were more M1 macrophages than M2 macrophages in most OSCC tissues, but the M2 number was higher than the M1 number in only 15% of the tissues. This result may be associated with both the antitumor and tumor‐suppressive properties of TAM, and the composition of TAM is different for different stages of OSCC. Unlike the controversial conclusions about the correlations between the total number of macrophages and the prognosis of OSCC, most studies have supported that more M2‐type macrophages indicate a poorer prognosis in OSCC patients (Balermpas et al., 2014; Fujii et al., 2012; He et al., 2014; Hu et al., 2016; Matsuoka et al., 2015; Sakakura et al., 2016; Wang et al., 2014b). Here, we found that the proportion of M2/M1 macrophages, but not the total amount of macrophages, affects the prognosis of OSCC patients. The results based on the TCGA database are consistent with ours.
In the TME, the recruitment and polarization of macrophages play an indispensable role in the development of tumors (DeNardo and Ruffell, 2019). Previous studies have revealed that various cytokines, such as CCL2 (Eggert et al., 2016; Garzia et al., 2018; Hartwig et al., 2017; Long et al., 2016; Shen et al., 2017; Tan et al., 2018a; Tsai et al., 2018), CCL3/4/5/7 (Coma et al., 2006; Mineharu et al., 2012; Yan et al., 2011), CXCL12 (Mineharu et al., 2012; Yan et al., 2011), VEGF (Horwitz et al., 2014) and PDGF (Dewar et al., 2005; Yang et al., 2016), have chemotactic effects on circulating monocytes. Accordingly, our research provided evidence that the expression of IL‐6, CCL5 and CSFs in OSCC cells and the secreted IL‐6 levels in cell supernatants were significantly higher in the RACK1‐silenced group than in the control group. In other words, RACK1 could inhibit the expression of IL‐6, CCL5 and CSF in OSCC cells and their secretion and then inhibit macrophage recruitment to the TME of OSCC. Furthermore, during the polarization process of macrophages, AP‐1, NF‐κB and STAT1 activation is required for M1 polarization, and mTOR, PPARγ/δ and STAT6 activation is critical for M2 polarization (Czimmerer et al., 2018; Zhu et al., 2015). Our study demonstrated that both M1 and M2 key activation factors, such as AP‐1, NF‐κB, STAT1 mTOR, and PPARγ, were significantly increased after RACK1 was silenced in OSCC cells. Moreover, we found that RACK1 could inhibit the recruitment of macrophages and then induce a ‘large bang’ of inflammatory factors, which could induce M0 cell polarization into M1 or M2 macrophages and increase the M2/M1 ratio. Thus, RACK1 could inhibit the recruitment of macrophages, increase the ratio of M2/M1, and create a chronic uncontrollable inflammatory environment, which could affect the development and metastasis of tumors.
In the TME, chronic and persistent inflammation without obvious clinical symptoms, also known as chronic smoldering inflammation, is the fundamental cause of the occurrence and development of tumors (Balkwill et al., 2005). Here, we revealed that RACK1 can inhibit the activation of NF‐κB, consistent with previous results (Yao et al., 2014). RACK1 can regulate the expression and secretion of proinflammatory cytokines and macrophage chemotactic factors in tumor cells, inhibit the massive recruitment of macrophages and severe inflammatory reactions, induce chronic smoldering inflammation in the TME and promote the progression of tumors, which may be an important reason why RACK1 promotes OSCC development. Considering the plasticity of TAM and the controversial relationship between the number of M0 and the prognosis of OSCC patients, targeting M2 macrophages instead of all macrophages may be a better treatment strategy.
The present study clearly has limitations that must be acknowledged. The RACK1 concentration and M2/M1 ratio are positively correlated, but the mechanism by which RACK1 promotes macrophage polarization to induce TAM to differentiate towards an M2‐like phenotype requires further investigation. Last but not least, whether RACK1 regulates NF‐κB directly remains to be explored.
5. Conclusions
In conclusion, our study demonstrates that RACK1 and M2 macrophages are upregulated and are associated with a poor prognosis in OSCC through a clinical cohort analysis. Further investigation indicated that RACK1 could inhibit macrophage recruitment and increase the M2/M1 ratio in an NF‐κB axis‐dependent manner, thus promoting the development of OSCC (Fig. 5), suggesting that RACK1 could be used as a potential therapeutic target for antitumor immunity.
Figure 5.
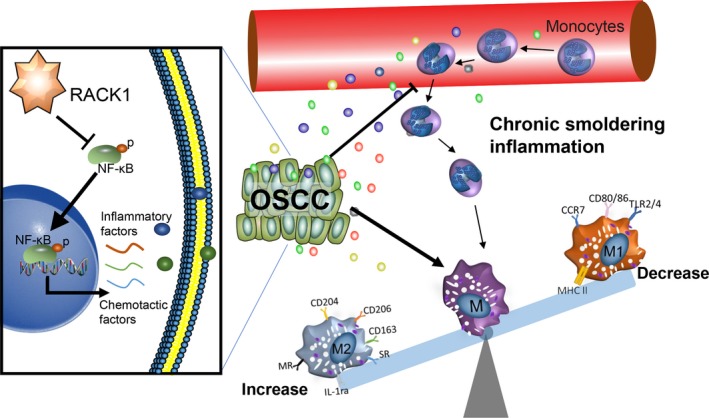
Schematic model by which RACK1 promotes the progression of OSCC. RACK1 inhibits the activation of NF‐κB, regulates the expression and secretion of proinflammatory factors and macrophage chemokines, inhibits the massive recruitment of macrophages and severe inflammatory reactions, induces a chronic smoldering inflammation microenvironment and promotes the development of tumors.
Conflict of interest
The authors declare no conflicts of interest.
Author contributions
HXD, SL and JJL conceived the study. SL, JJL, DJL, FYY, ZHW and JKW carried out the experiments. YZ, LJ, NJ, XZ, JL and QMC analyzed the data. HXD, SL and JJL wrote the manuscript. All authors read and approved the final version of the manuscript.
Supporting information
Fig. S1. M0 number is not correlated with OSCC prognosis but is negatively associated with RACK1 at the mRNA level. (A) OS according to CD68 protein expression in a clinical cohort of OSCC patients (n = 37, P = 0.9829). (B) OS according to CD68 mRNA expression in OSCC TCGA data (n = 460, P = 0.5385). (C) Correlation between RACK1 and CD68 mRNA expression in the TCGA database (Spearman's rank correlation coefficient r = −0.1249, P < 0.01).
Fig. S2. The tumor volumes of the sh‐RACK1 group were smaller than those of the sh‐NC group.
Acknowledgements
This work was supported by the National Natural Science Foundation of China (Nos. 81672675, 81872211, 81621062, 81302371 and 81771081) and the 111 Project of MOE China (Grant No. B14038). We are indebted to Dr. Xikun Zhou for technical help. We are grateful to Prof. Min Zhou for her continuous support and encouragement.
Hongxia Dan, Sai Liu and Jiajia Liu contributed equally.
Contributor Information
Jing Li, Email: lijing1984@scu.edu.cn.
Qianming Chen, Email: qmchen@scu.edu.cn.
References
- Alves AM, Diel LF and Lamers ML (2018) Macrophages and prognosis of oral squamous cell carcinoma: a systematic review. J Oral Pathol Med 47, 460–467. [DOI] [PubMed] [Google Scholar]
- Balermpas P, Rodel F, Liberz R, Oppermann J, Wagenblast J, Ghanaati S, Harter PN, Mittelbronn M, Weiss C, Rodel C et al (2014) Head and neck cancer relapse after chemoradiotherapy correlates with CD163+ macrophages in primary tumour and CD11b+ myeloid cells in recurrences. Br J Cancer 111, 1509–1518. [DOI] [PMC free article] [PubMed] [Google Scholar]
- Balkwill F, Charles KA and Mantovani A (2005) Smoldering and polarized inflammation in the initiation and promotion of malignant disease. Cancer Cell 7, 211–217. [DOI] [PubMed] [Google Scholar]
- Berns H, Humar R, Hengerer B, Kiefer FN and Battegay EJ (2000) RACK1 is up‐regulated in angiogenesis and human carcinomas. FASEB J 14, 2549–2558. [DOI] [PubMed] [Google Scholar]
- Brown JM, Recht L and Strober S (2017) The promise of targeting macrophages in cancer therapy. Clin Cancer Res 23, 3241–3250. [DOI] [PMC free article] [PubMed] [Google Scholar]
- Coma G, Pena R, Blanco J, Rosell A, Borras FE, Este JA, Clotet B, Ruiz L, Parkhouse RM and Bofill M (2006) Treatment of monocytes with interleukin (IL)‐12 plus IL‐18 stimulates survival, differentiation and the production of CXC chemokine ligands (CXCL)8, CXCL9 and CXCL10. Clin Exp Immunol 145, 535–544. [DOI] [PMC free article] [PubMed] [Google Scholar]
- Costa NL, Valadares MC, Souza PP, Mendonca EF, Oliveira JC, Silva TA and Batista AC (2013) Tumor‐associated macrophages and the profile of inflammatory cytokines in oral squamous cell carcinoma. Oral Oncol 49, 216–223. [DOI] [PubMed] [Google Scholar]
- Czimmerer Z, Daniel B, Horvath A, Ruckerl D, Nagy G, Kiss M, Peloquin M, Budai MM, Cuaranta‐Monroy I, Simandi Z et al (2018) The transcription factor STAT6 mediates direct repression of inflammatory enhancers and limits activation of alternatively polarized macrophages. Immunity 48, 75–90.e76. [DOI] [PMC free article] [PubMed] [Google Scholar]
- DeNardo DG and Ruffell B (2019) Macrophages as regulators of tumour immunity and immunotherapy. Nat Rev Immunol 19, 369–382 [DOI] [PMC free article] [PubMed] [Google Scholar]
- Dewar AL, Cambareri AC, Zannettino AC, Miller BL, Doherty KV, Hughes TP and Lyons AB (2005) Macrophage colony‐stimulating factor receptor c‐fms is a novel target of imatinib. Blood 105, 3127–3132. [DOI] [PubMed] [Google Scholar]
- Eggert T, Wolter K, Ji J, Ma C, Yevsa T, Klotz S, Medina‐Echeverz J, Longerich T, Forgues M, Reisinger F et al (2016) Distinct functions of senescence‐associated immune responses in liver tumor surveillance and tumor progression. Cancer Cell 30, 533–547. [DOI] [PMC free article] [PubMed] [Google Scholar]
- Fang J, Li X, Ma D, Liu X, Chen Y, Wang Y, Lui VWY, Xia J, Cheng B and Wang Z (2017) Prognostic significance of tumor infiltrating immune cells in oral squamous cell carcinoma. BMC Cancer 17, 375. [DOI] [PMC free article] [PubMed] [Google Scholar]
- Fujii N, Shomori K, Shiomi T, Nakabayashi M, Takeda C, Ryoke K and Ito H (2012) Cancer‐associated fibroblasts and CD163‐positive macrophages in oral squamous cell carcinoma: their clinicopathological and prognostic significance. J Oral Pathol Med 41, 444–451. [DOI] [PubMed] [Google Scholar]
- Garzia L, Kijima N, Morrissy AS, De Antonellis P, Guerreiro‐Stucklin A, Holgado BL, Wu X, Wang X, Parsons M, Zayne K et al (2018) A hematogenous route for medulloblastoma leptomeningeal metastases. Cell 172, 1050–1062.e1014. [DOI] [PMC free article] [PubMed] [Google Scholar]
- Guo L, Akahori H, Harari E, Smith SL, Polavarapu R, Karmali V, Otsuka F, Gannon RL, Braumann RE, Dickinson MH et al (2018) CD163+ macrophages promote angiogenesis and vascular permeability accompanied by inflammation in atherosclerosis. J Clin Investig 128, 1106–1124. [DOI] [PMC free article] [PubMed] [Google Scholar]
- Gustafson MP, Lin Y, Bleeker JS, Warad D, Tollefson MK, Crispen PL, Bulur PA, Harrington SM, Laborde RR, Gastineau DA et al (2015) Intratumoral CD14+ cells and circulating CD14+HLA‐DRlo/neg monocytes correlate with decreased survival in patients with clear cell renal cell carcinoma. Clin Cancer Res 21, 4224–4233. [DOI] [PubMed] [Google Scholar]
- Han Q, Shi H and Liu F (2016) CD163+ M2‐type tumor‐associated macrophage support the suppression of tumor‐infiltrating T cells in osteosarcoma. Int Immunopharmacol 34, 101–106. [DOI] [PubMed] [Google Scholar]
- Hartwig T, Montinaro A, von Karstedt S, Sevko A, Surinova S, Chakravarthy A, Taraborrelli L, Draber P, Lafont E, Arce Vargas F et al (2017) The TRAIL‐induced cancer secretome promotes a tumor‐supportive immune microenvironment via CCR2. Mol Cell 65, 730–742.e735. [DOI] [PMC free article] [PubMed] [Google Scholar]
- He KF, Zhang L, Huang CF, Ma SR, Wang YF, Wang WM, Zhao ZL, Liu B, Zhao YF, Zhang WF et al (2014) CD163+ tumor‐associated macrophages correlated with poor prognosis and cancer stem cells in oral squamous cell carcinoma. Biomed Res Int 2014, 838632. [DOI] [PMC free article] [PubMed] [Google Scholar]
- Horwitz E, Stein I, Andreozzi M, Nemeth J, Shoham A, Pappo O, Schweitzer N, Tornillo L, Kanarek N, Quagliata L et al (2014) Human and mouse VEGFA‐amplified hepatocellular carcinomas are highly sensitive to sorafenib treatment. Cancer Discov 4, 730–743. [DOI] [PubMed] [Google Scholar]
- Hu Y, He MY, Zhu LF, Yang CC, Zhou ML, Wang Q, Zhang W, Zheng YY, Wang DM, Xu ZQ et al (2016) Tumor‐associated macrophages correlate with the clinicopathological features and poor outcomes via inducing epithelial to mesenchymal transition in oral squamous cell carcinoma. J Exp Clin Cancer Res 35, 12. [DOI] [PMC free article] [PubMed] [Google Scholar]
- Kubota K and Moriyama M (2017) CD163+CD204+ tumor‐associated macrophages contribute to T cell regulation via interleukin‐10 and PD‐L1 production in oral squamous cell carcinoma. Sci Rep 7, 1755. [DOI] [PMC free article] [PubMed] [Google Scholar]
- Kubota K, Moriyama M, Furukawa S, Rafiul H, Maruse Y, Jinno T, Tanaka A, Ohta M, Ishiguro N, Yamauchi M et al (2017) CD163+CD204+ tumor‐associated macrophages contribute to T cell regulation via interleukin‐10 and PD‐L1 production in oral squamous cell carcinoma. Sci Rep 7, 1755. [DOI] [PMC free article] [PubMed] [Google Scholar]
- Lei Y, Xie Y, Tan YS, Prince ME, Moyer JS, Nor J and Wolf GT (2016) Telltale tumor infiltrating lymphocytes (TIL) in oral, head & neck cancer. Oral Oncol 61, 159–165. [DOI] [PMC free article] [PubMed] [Google Scholar]
- Li G, Ji XD, Gao H, Zhao JS, Xu JF, Sun ZJ, Deng YZ, Shi S, Feng YX, Zhu YQ et al (2012a) EphB3 suppresses non‐small‐cell lung cancer metastasis via a PP2A/RACK1/Akt signalling complex. Nat Commun 3, 667. [DOI] [PubMed] [Google Scholar]
- Li J, Guo Y, Feng X, Wang Z, Wang Y, Deng P, Zhang D, Wang R, Xie L, Xu X et al (2012b) Receptor for activated C kinase 1 (RACK1): a regulator for migration and invasion in oral squamous cell carcinoma cells. J Cancer Res Clin Oncol 138, 563–571. [DOI] [PMC free article] [PubMed] [Google Scholar]
- Liu SY, Chang LC, Pan LF, Hung YJ, Lee CH and Shieh YS (2008) Clinicopathologic significance of tumor cell‐lined vessel and microenvironment in oral squamous cell carcinoma. Oral Oncol 44, 277–285. [DOI] [PubMed] [Google Scholar]
- Liu S, Liu D, Zeng X, Wang J, Liu J, Cheng J, Lei K, Bai H, Ji N, Zhou M et al (2018a) PA28gamma acts as a dual regulator of IL‐6 and CCL2 and contributes to tumor angiogenesis in oral squamous cell carcinoma. Cancer Lett 428, 192–200. [DOI] [PubMed] [Google Scholar]
- Liu S, Liu J, Wang J, Cheng J, Zeng X, Ji N, Li J and Chen Q (2018b) RACK1 is an organ‐specific prognostic predictor in OSCC. Oral Oncol 76, 22–26. [DOI] [PubMed] [Google Scholar]
- Long KB, Gladney WL, Tooker GM, Graham K, Fraietta JA and Beatty GL (2016) IFNgamma and CCL2 cooperate to redirect tumor‐infiltrating monocytes to degrade fibrosis and enhance chemotherapy efficacy in pancreatic carcinoma. Cancer Discov 6, 400–413. [DOI] [PMC free article] [PubMed] [Google Scholar]
- Lu CF, Huang CS, Tjiu JW and Chiang CP (2010) Infiltrating macrophage count: a significant predictor for the progression and prognosis of oral squamous cell carcinomas in Taiwan. Head Neck 32, 18–25. [DOI] [PubMed] [Google Scholar]
- Majzoub K, Hafirassou ML, Meignin C, Goto A, Marzi S, Fedorova A, Verdier Y, Vinh J, Hoffmann JA, Martin F et al (2014) RACK1 controls IRES‐mediated translation of viruses. Cell 159, 1086–1095. [DOI] [PMC free article] [PubMed] [Google Scholar]
- Marcus B, Arenberg D, Lee J, Kleer C, Chepeha DB, Schmalbach CE, Islam M, Paul S, Pan Q, Hanash S et al (2004) Prognostic factors in oral cavity and oropharyngeal squamous cell carcinoma. Cancer 101, 2779–2787. [DOI] [PubMed] [Google Scholar]
- Matsuoka Y, Yoshida R, Nakayama H, Nagata M, Hirosue A, Tanaka T, Kawahara K, Nakagawa Y, Sakata J, Arita H et al (2015) The tumour stromal features are associated with resistance to 5‐FU‐based chemoradiotherapy and a poor prognosis in patients with oral squamous cell carcinoma. APMIS 123, 205–214. [DOI] [PubMed] [Google Scholar]
- Mineharu Y, Muhammad AKMG, Yagiz K, Candolfi M, Kroeger KM, Xiong W, Puntel M, Liu C, Levy E, Lugo C et al (2012) Gene therapy‐mediated reprogramming tumor infiltrating T cells using IL‐2 and inhibiting NF‐κB signaling improves the efficacy of immunotherapy in a brain cancer model. Neurotherapeutics 9, 827–843. [DOI] [PMC free article] [PubMed] [Google Scholar]
- Motomura Y, Kanno S, Asano K, Tanaka M, Hasegawa Y, Katagiri H, Saito T, Hara H, Nishio H, Hara T et al (2015) Identification of pathogenic cardiac CD11c+ macrophages in Nod1‐mediated acute coronary arteritis. Arterioscler Thromb Vasc Biol 35, 1423–1433. [DOI] [PubMed] [Google Scholar]
- Ni YH, Ding L, Huang XF, Dong YC, Hu QG and Hou YY (2015) Microlocalization of CD68+ tumor‐associated macrophages in tumor stroma correlated with poor clinical outcomes in oral squamous cell carcinoma patients. Tumour Biol 36, 5291–5298. [DOI] [PubMed] [Google Scholar]
- Olesch C, Sha W, Angioni C, Sha LK, Acaf E, Patrignani P, Jakobsson PJ, Radeke HH, Grosch S, Geisslinger G et al (2015) MPGES‐1‐derived PGE2 suppresses CD80 expression on tumor‐associated phagocytes to inhibit anti‐tumor immune responses in breast cancer. Oncotarget 6, 10284–10296. [DOI] [PMC free article] [PubMed] [Google Scholar]
- Panzarella V, Pizzo G, Calvino F, Compilato D, Colella G and Campisi G (2014) Diagnostic delay in oral squamous cell carcinoma: the role of cognitive and psychological variables. Int J Oral Sci 6, 39–45. [DOI] [PMC free article] [PubMed] [Google Scholar]
- Petruzzi MN, Cherubini K, Salum FG and de Figueiredo MA (2017) Role of tumour‐associated macrophages in oral squamous cells carcinoma progression: an update on current knowledge. Diagn Pathol 12, 32. [DOI] [PMC free article] [PubMed] [Google Scholar]
- Ruffell B and Coussens LM (2015) Macrophages and therapeutic resistance in cancer. Cancer Cell 27, 462–472. [DOI] [PMC free article] [PubMed] [Google Scholar]
- Sakakura K, Takahashi H, Kaira K, Toyoda M, Murata T, Ohnishi H, Oyama T and Chikamatsu K (2016) Relationship between tumor‐associated macrophage subsets and CD47 expression in squamous cell carcinoma of the head and neck in the tumor microenvironment. Lab Invest 96, 994–1003. [DOI] [PubMed] [Google Scholar]
- Salmi S, Siiskonen H, Sironen R, Tyynela‐Korhonen K, Hirschovits‐Gerz B, Valkonen M, Auvinen P and Pasonen‐Seppanen S (2018) The number and localization of CD68+ and CD163+ macrophages in different stages of cutaneous melanoma. Melanoma Res 29, 237–247. [DOI] [PMC free article] [PubMed] [Google Scholar]
- Sato‐Kaneko F, Yao S, Ahmadi A, Zhang SS, Hosoya T, Kaneda MM, Varner JA, Pu M, Messer KS, Guiducci C et al (2017) Combination immunotherapy with TLR agonists and checkpoint inhibitors suppresses head and neck cancer. JCI Insight 2, e93397. [DOI] [PMC free article] [PubMed] [Google Scholar]
- Shen Q, Cohen B, Zheng W, Rahbar R, Martin B, Murakami K, Lamorte S, Thompson P, Berman H, Zuniga‐Pflucker JC et al (2017) Notch shapes the innate immunophenotype in breast cancer. Cancer Discov 7, 1320–1335. [DOI] [PubMed] [Google Scholar]
- Sica A, Larghi P, Mancino A, Rubino L, Porta C, Totaro MG, Rimoldi M, Biswas SK, Allavena P and Mantovani A (2008) Macrophage polarization in tumour progression. Semin Cancer Biol 18, 349–355. [DOI] [PubMed] [Google Scholar]
- Sun H, Miao C, Liu W, Qiao X, Yang W, Li L and Li C (2018) TGF‐beta1/TbetaRII/Smad3 signaling pathway promotes VEGF expression in oral squamous cell carcinoma tumor‐associated macrophages. Biochem Biophys Res Comm 497, 583–590. [DOI] [PubMed] [Google Scholar]
- Tan YS, Sansanaphongpricha K, Prince MEP, Sun D, Wolf GT and Lei YL (2018a) Engineering vaccines to reprogram immunity against head and neck cancer. J Dent Res 97, 627–634. [DOI] [PMC free article] [PubMed] [Google Scholar]
- Tan YS, Sansanaphongpricha K, Xie Y, Donnelly CR, Luo X, Heath BR, Zhao X, Bellile E, Hu H, Chen H et al (2018b) Mitigating SOX2‐potentiated immune escape of head and neck squamous cell carcinoma with a STING‐inducing nanosatellite vaccine. Clin Cancer Res 24, 4242–4255. [DOI] [PMC free article] [PubMed] [Google Scholar]
- Tan‐Garcia A, Wai LE, Zheng D, Ceccarello E, Jo J, Banu N, Khakpoor A, Chia A, Tham CYL, Tan AT et al (2017) Intrahepatic CD206+ macrophages contribute to inflammation in advanced viral‐related liver disease. J Hepatol 67, 490–500. [DOI] [PubMed] [Google Scholar]
- Torre LA, Bray F, Siegel RL, Ferlay J, Lortet‐Tieulent J and Jemal A (2015) Global cancer statistics, 2012. CA Cancer J Clinic 65, 87–108. [DOI] [PubMed] [Google Scholar]
- Tsai YC, Chen WY, Abou‐Kheir W, Zeng T, Yin JJ, Bahmad H, Lee YC and Liu YN (2018) Androgen deprivation therapy‐induced epithelial‐mesenchymal transition of prostate cancer through downregulating SPDEF and activating CCL2. Biochim Biophys Acta 1864, 1717–1727 [DOI] [PubMed] [Google Scholar]
- Udeabor SE, Adisa AO, Orlowska A, Sader RA and Ghanaati S (2017) Tumor‐associated macrophages, angiogenesis, and tumor cell migration in oral squamous cell carcinoma. Ann Afr Med 16, 181–185. [DOI] [PMC free article] [PubMed] [Google Scholar]
- Wang Z, Jiang L, Huang C, Li Z, Chen L, Gou L, Chen P, Tong A, Tang M, Gao F et al (2008) Comparative proteomics approach to screening of potential diagnostic and therapeutic targets for oral squamous cell carcinoma. Mol Cell Proteomics 7, 1639–1650. [DOI] [PMC free article] [PubMed] [Google Scholar]
- Wang H, Wang X, Li X, Fan Y, Li G, Guo C, Zhu F, Zhang L and Shi Y (2014a) CD68+HLA‐DR+ M1‐like macrophages promote motility of HCC cells via NF‐kappaB/FAK pathway. Cancer Lett 345, 91–99. [DOI] [PubMed] [Google Scholar]
- Wang S, Sun M, Gu C, Wang X, Chen D, Zhao E, Jiao X and Zheng J (2014b) Expression of CD163, interleukin‐10, and interferon‐gamma in oral squamous cell carcinoma: mutual relationships and prognostic implications. Eur J Oral Sci 122, 202–209. [DOI] [PubMed] [Google Scholar]
- Wehner P, Shnitsar I, Urlaub H and Borchers A (2011) RACK1 is a novel interaction partner of PTK7 that is required for neural tube closure. Development 138, 1321–1327. [DOI] [PubMed] [Google Scholar]
- Xu X, Yang X, Xiong Y, Gu J, He C, Hu Y, Xiao F, Chen G and Wang X (2015) Increased expression of receptor for activated C kinase 1 in temporal lobe epilepsy. J Neurochem 133, 134–143. [DOI] [PubMed] [Google Scholar]
- Yan X‐J, Dozmorov I, Li W, Yancopoulos S, Sison C, Centola M, Jain P, Allen SL, Kolitz JE, Rai KR et al (2011) Identification of outcome‐correlated cytokine clusters in chronic lymphocytic leukemia. Blood 118, 5201–5210. [DOI] [PMC free article] [PubMed] [Google Scholar]
- Yang Y, Andersson P, Hosaka K, Zhang Y, Cao R, Iwamoto H, Yang X, Nakamura M, Wang J, Zhuang R et al (2016) The PDGF‐BB‐SOX7 axis‐modulated IL‐33 in pericytes and stromal cells promotes metastasis through tumour‐associated macrophages. Nat Commun 7, 11385. [DOI] [PMC free article] [PubMed] [Google Scholar]
- Yao F, Long LY, Deng YZ, Feng YY, Ying GY, Bao WD, Li G, Guan DX, Zhu YQ, Li JJ et al (2014) RACK1 modulates NF‐kappaB activation by interfering with the interaction between TRAF2 and the IKK complex. Cell Res 24, 359–371. [DOI] [PMC free article] [PubMed] [Google Scholar]
- Zhang X, Liu N, Ma D, Liu L, Jiang L, Zhou Y, Zeng X, Li J and Chen Q (2016) Receptor for activated C kinase 1 (RACK1) promotes the progression of OSCC via the AKT/mTOR pathway. Int J Oncol 49, 539–548. [DOI] [PubMed] [Google Scholar]
- Zhou Z, Liu F, Zhang ZS, Shu F, Zheng Y, Fu L and Li LY (2014) Human rhomboid family‐1 suppresses oxygen‐independent degradation of hypoxia‐inducible factor‐1alpha in breast cancer. Can Res 74, 2719–2730. [DOI] [PubMed] [Google Scholar]
- Zhu L, Zhao Q, Yang T, Ding W and Zhao Y (2015) Cellular metabolism and macrophage functional polarization. Int Rev Immunol 34, 82–100. [DOI] [PubMed] [Google Scholar]
Associated Data
This section collects any data citations, data availability statements, or supplementary materials included in this article.
Supplementary Materials
Fig. S1. M0 number is not correlated with OSCC prognosis but is negatively associated with RACK1 at the mRNA level. (A) OS according to CD68 protein expression in a clinical cohort of OSCC patients (n = 37, P = 0.9829). (B) OS according to CD68 mRNA expression in OSCC TCGA data (n = 460, P = 0.5385). (C) Correlation between RACK1 and CD68 mRNA expression in the TCGA database (Spearman's rank correlation coefficient r = −0.1249, P < 0.01).
Fig. S2. The tumor volumes of the sh‐RACK1 group were smaller than those of the sh‐NC group.