Abstract
X-ray luminescence computed tomography (XLCT) is an emerging hybrid imaging modality. It has been recently reported that materials like water, tissue, or even air can generate optical photons upon x-ray irradiation which can increase the noises in measurements of XLCT. In this study, we have investigated the x-ray luminescence from water, air, as well as tissue mimicking phantoms, including one embedded with a 0.01 mg/mL GOS:Eu3+ microphosphor target. We have measured the optical emission spectrum from each sample, including samples of meat and fat, using a spectrograph. Our results indicate that there are plenty of optical photons emitted by x-ray irradiation and a small nanophosphor concentration, as low as 5.28 μM in a deep background can provide enough contrast for XLCT imaging.
1. INTRODUCTION
The principle of x-ray luminescence for imaging purposes (x-ray luminescence imaging, XLI) has been demonstrated through in vitro thin tissue experiments using both Europium (Eu3+) and Terbium (Tb) doped particles of gadolinium oxysulfide (GOS) [1, 2]. Using principles of optical tomography (e.g. fluorescence molecular tomography or bioluminescence optical tomography), this idea was extended to be able to reconstruct the three-dimensional distribution of luminescent particles in vivo through a hybrid molecular imaging modality called x-ray luminescence computed tomography (XLCT). Since XLCT was proposed, several groups including our own have made progress in demonstrating XLCT as a feasible imaging modality [3–19]. In principle, XLCT uses external high-energy x-ray photons that interrogate the object or specimen and embedded contrast agents (typically rare-earth doped nanophosphors such as GOS:Eu3+) will emit optical photons. Some of the emitted optical photons propagate to the object surface to be detected by highly sensitive photodetectors such as an electron multiplying charge-coupled device (EMCCD) camera or photomultiplier tubes (PMT) for optical tomographic image reconstruction. Different x-ray beam geometries have also been utilized for XLCT imaging, being first demonstrated with a narrow (pencil) beam geometry [3, 4, 11, 12], but several groups have used other excitation geometries such as a conical beam [6–10] or sheet beam [19], each with their own advantages and disadvantages. Through this imaging principle, our group was able to demonstrate that XLCT was experimentally capable of submillimeter resolution [13, 14, 17] and capable of imaging GOS:Eu3+ phosphor particle concentrations as low as 0.01 mg/mL (~27 μM) at scanning depths greater than 2 cm [15, 16] using the narrow-beam x-ray geometry. These studies and others have demonstrated that XLCT is a promising molecular tomographic tool for imaging the deeply embedded targets with high spatial resolution and very good sensitivity.
The signal generation in XLCT is a form of radioluminescence where the ionizing radiation (in this case, x-ray photons) causes the emission of optical photons from the embedded contrast agents, and it is generally assumed that all the optical photons generated are emitted only from the contrast agents. However, numerous studies have reported other sources of optical photons from the radioluminescence of air, water, and biological tissue [20–36] at energies below the Cerenkov radiation threshold which will provide background noise and limit the molecular sensitivity of XLCT imaging. Yamamoto et al. conducted various luminescence imaging experiments with different sources of radiation to image both water and air. Using proton-beam irradiation, they found that water was able to luminesce even during traditional proton-therapy, and determined that this information could be useful for dose and range estimation [20–23, 30]. With carbon-ion irradiation, they performed similar luminescence imaging (also with energy below the Cerenkov-threshold) and determined, by measuring and deriving the light spectra, that this water luminescence was likely caused by an electromagnetic pulse produced from the dipole displacement inside water molecules as the derived spectra was found to be proportional to λ−2.0 [24, 25]. In addition, they also determined other radiation sources such as alpha particles [26], beta particles [27], and gamma photons [28] could also produce luminescence in water at energies below the Cerenkov-threshold. Ionization and production of luminescence in air is also generally a well-documented phenomenon and is primarily attributed to atmospheric nitrogen [32, 33]. Lastly, x-ray photons were also demonstrated in the luminescence imaging of water at sub-Cerenkov-threshold energy levels [30, 31] and the emitted luminescence was found to be proportional to the x-ray energy. In particular, this generation of optical photons with low energy x-rays is of particular concern or interest for XLI/XLCT imaging. To examine this phenomenon further, and to observe its implications for XLI/XLCT imaging, we performed several experiments in this paper. We performed two-dimensional (2D) XLI of water, air, and tissue-mimicking phantoms, including a phantom embedded with 0.01 mg/mL GOS:Eu3+ particles, and imaged the phantoms at different scanning depths using a focused x-ray beam with energy much less than the Cerenkov radiation threshold (260 keV for water). We have also used a spectrograph mounted on an EMCCD camera to measure the emitted x-ray luminescence spectra from distilled water, two different tissue-mimicking phantoms, and meat (tissue) and fat samples from both chicken and pork.
The rest of the paper is organized as follows. In Section 2, we present our experimental set-up for both the XLI and the x-ray luminescence spectra measurements. In Section 3, we present the results of our experiments. Lastly in Section 4, we discuss our results and then conclude the paper.
2. METHODS
2.1. X-ray luminescence imaging (XLI)
2.1.1. X-ray luminescence imaging (XLI) experimental set-up
A schematic for the experimental set-up used for the XLI is shown in Fig. 1 and a photograph of the set-up in Fig. 2. The x-ray tube (Polycapillary X-Beam Powerflux, XOS, NY; Target Metal: Molybdenum (Mo)) uses a polycapillary x-ray lens to focus the x-ray beam to a focal spot size of 100 μm with a dual-cone geometry and was utilized in [17] for focused x-ray beam based XLCT imaging. The phantom (or object to be imaged) was placed on a manual lab jack (LJ750/M, Thorlabs) that was fixed on a motorized rotary stage (B4872TS-ZR, Velmex Inc.) and then mounted on a motorized linear stage (Unislide MA40, Velmex Inc.) for translating and rotating the object (for different angular projection measurements) at various depths. The x-ray beam position was monitored using an x-ray detector (Shad-o-box 1024, Rad-Icon Imaging Corp.) which was mounted on the opposite side of the x-ray tube. In this study the object was positioned such that the x-ray beam passed through its center and the XLI was performed with one projection at different scan depths below the object top surface. The luminescent optical photons that propagated to the object top surface were reflected by a flat mirror and detected by a water-cooled EMCCD camera (C9100–13, Hamamatsu) and lens (50 mm, f 1.4, ZEISS) which was shielded by a 0.5 cm thick lead wall to protect from scattered x-ray photons. The entire system was placed inside of a light-tight and x-ray shielding cabinet and mounted on an optics table and controlled by programs on a lab computer.
Fig 1.
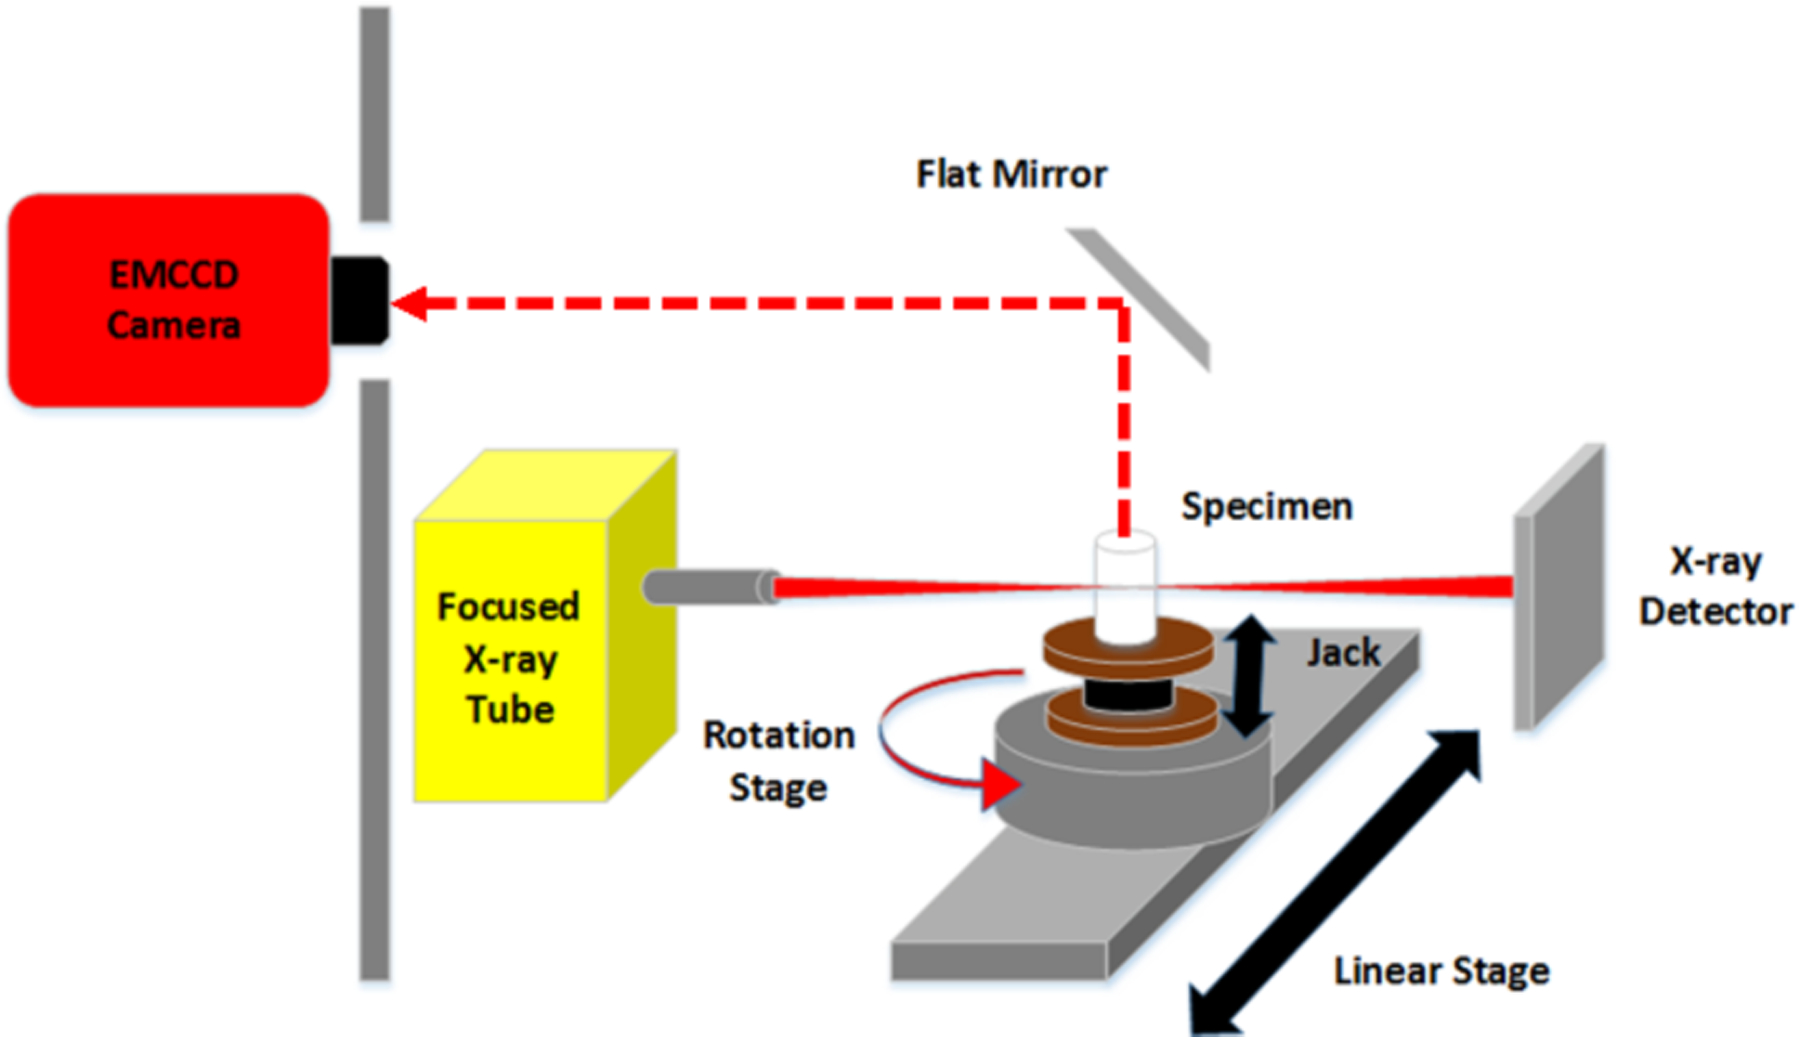
Schematic of the experimental XLI set-up.
Fig. 2.
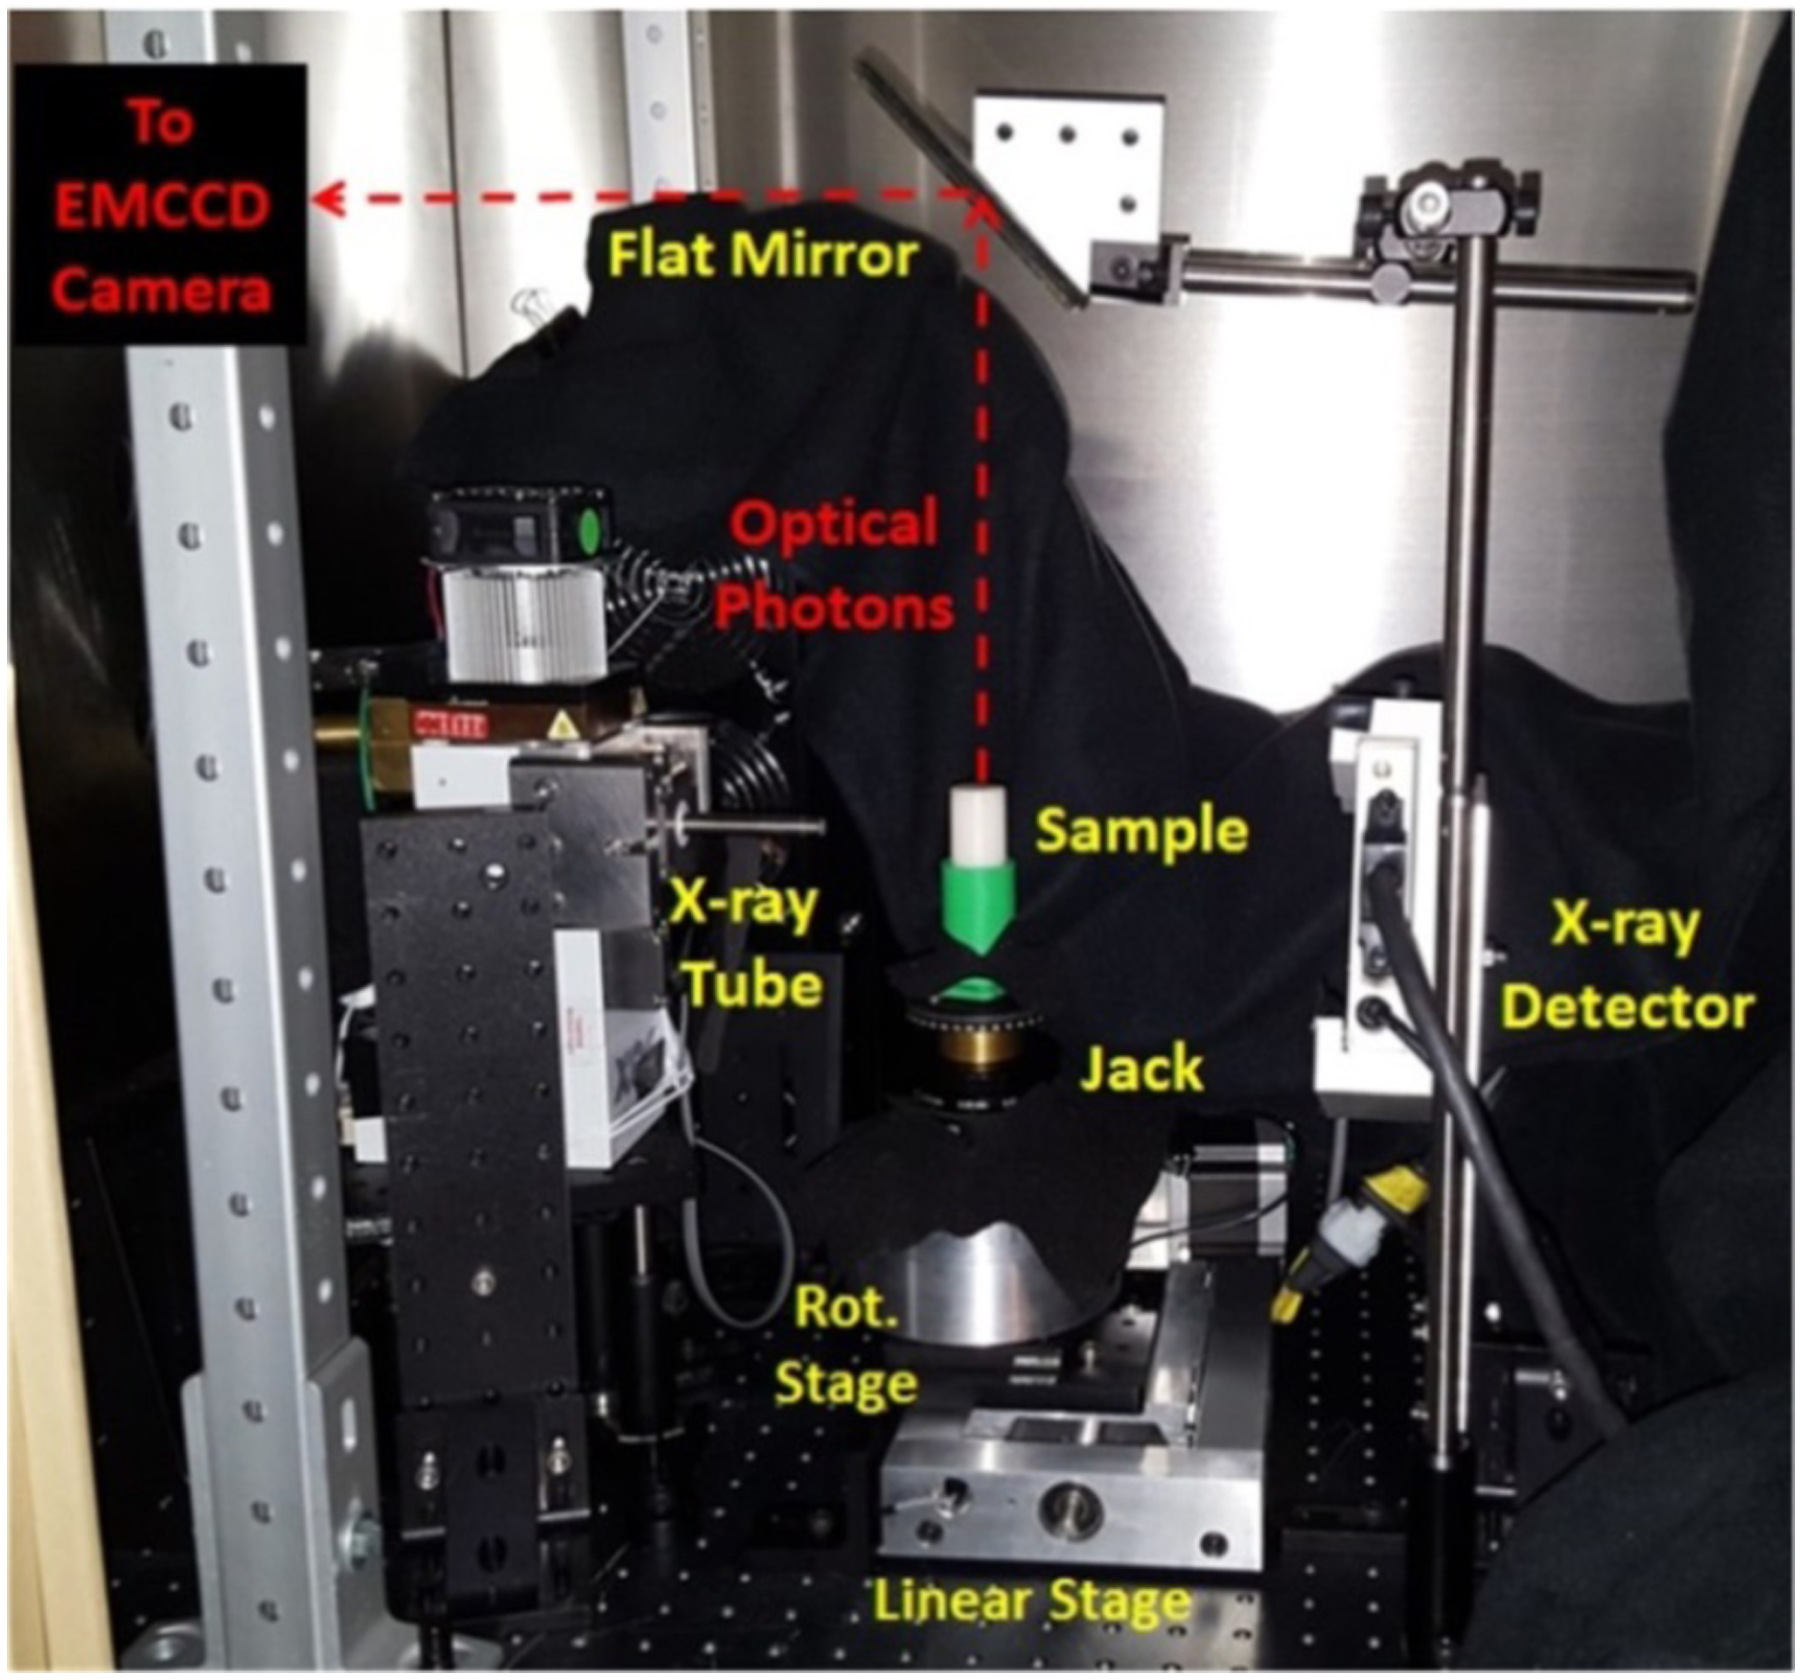
Photograph of the XLI set-up. The EMCCD camera is shielded by a lead wall with an opening and is focused on top surface of the sample reflected by the flat mirror.
2.1.2. Phantoms and scanning scheme for XLI experiments
We have performed XLI experiments for five different phantoms as listed in Table 1 and have also listed their scanning scheme parameters. The geometry of the first three phantoms is plotted in Fig. 3. The fourth and fifth phantoms were the air and liquid water phantoms as shown in Fig. 4, in which the CAD design model of them is plotted. The first phantom was an agar phantom that was composed of water and 2% agar. The second phantom was a titanium dioxide (TiO2) phantom that was composed of 2% agar, 1% TiO2, and 0.003% India ink such that the phantom had tissue-mimicking optical properties of μa = 0.007 mm−1 (absorption coefficient) and μs′ = 1.00 mm−1 (reduced scattering coefficient) at the wavelength of 703 nm, the longest emission peak for GOS:Eu3+. The third phantom, a GOS:Eu3+ phantom, had the same composition as the second phantom, except that it contained a through-hole of 4.60 mm diameter which was embedded with a target containing 0.01 mg/mL of GOS:Eu3+ particles (UKL63/UF-R1, Phosphor Tech. Ltd.) as shown in Fig. 3 (red object). The three phantoms were used to compare the radioluminescence from water and tissue-mimicking phantoms, including a tissue-mimicking phantom which was embedded with a small concentration (0.01 mg/mL) of GOS:Eu3+ particles. The fabrication steps of the phantoms followed a similar procedure as described in [37].
Table 1.
Phantoms for XLI experiments
| Phantom Name | Phantom Composition | Scanning Parameters | Target |
|---|---|---|---|
| Agar Phantom | 2% agar, water | X-ray: 50 kV, 1.0 mA EMCCD Exposure: 5s | None |
| TiO2 Phantom | 2% agar, 1% TiO2, 0.003% India Ink | X-ray: 50 kV, 1.0 mA EMCCD Exposure: 5s | None |
| GOS:Eu3+ Phantom | 2% agar, 1% TiO2, 0.003% India Ink | X-ray: 50 kV, 1.0 mA EMCCD Exposure: 5s | 0.01 mg/mL GOS:Eu3+ Size: 4.60 mm |
| Air | Air | X-ray: 50 kV, 1.0 mA EMCCD Exposure: 60s | None |
| Distilled Water | Distilled Water | X-ray: 50 kV, 1.0 mA EMCCD Exposure: 60s | None |
Fig. 3.
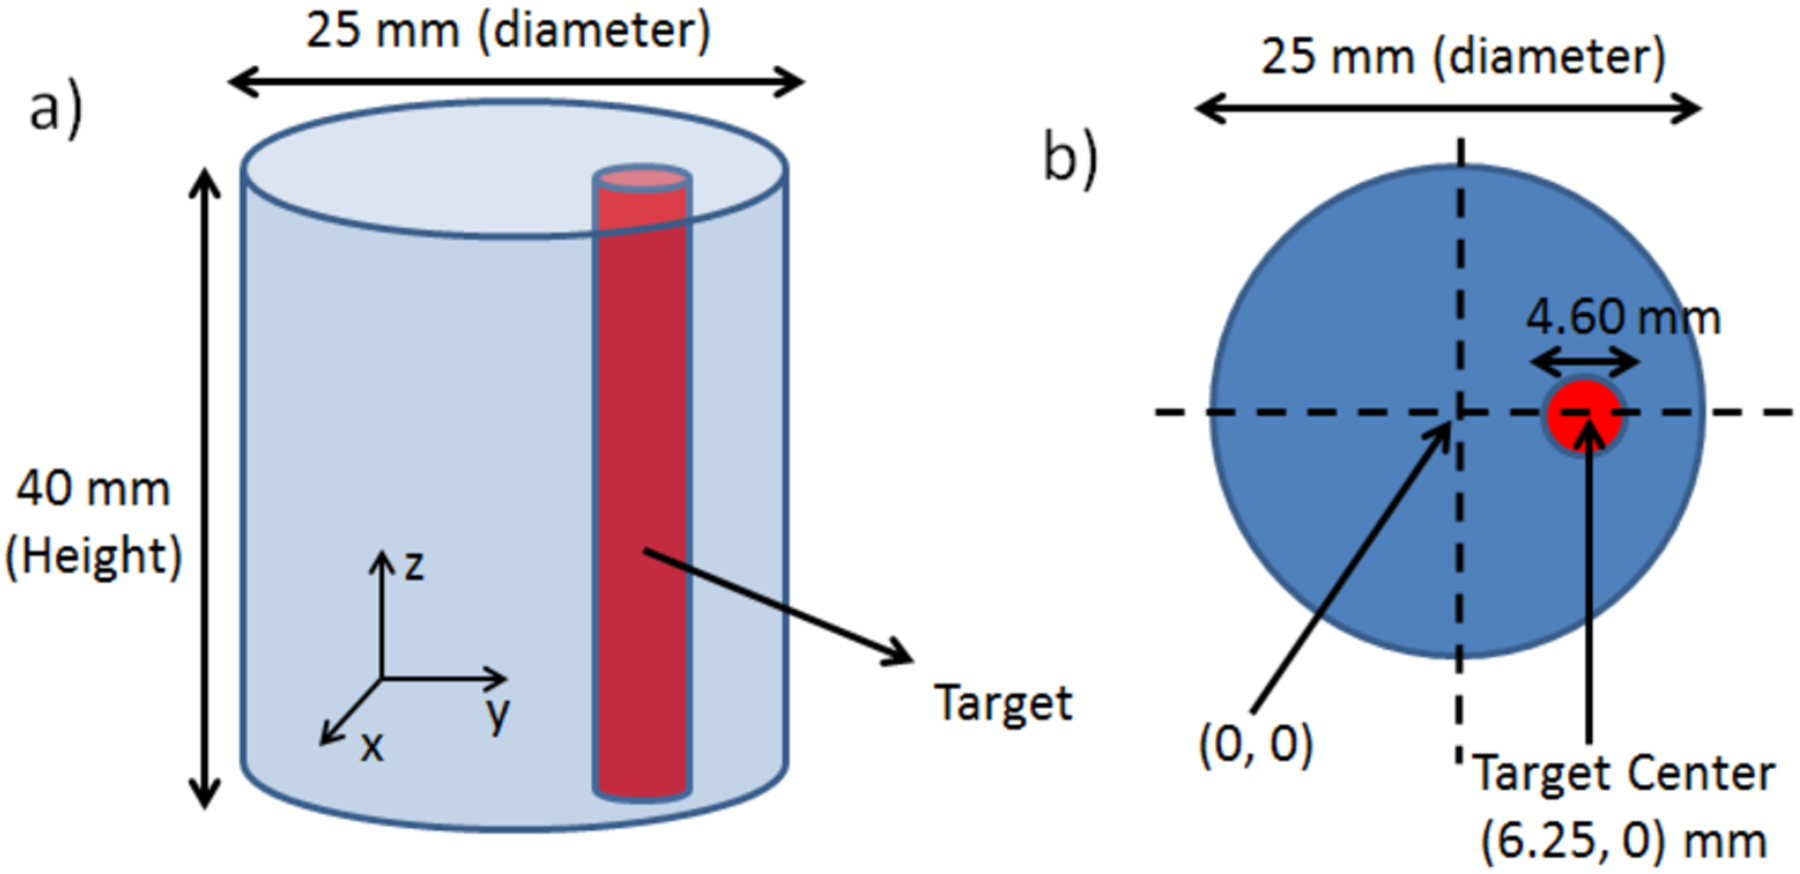
Phantom geometry for the XLI experiment. a) overall phantom geometry and b) top surface geometry showing target location. Note: The GOS:Eu3+ target is for the 3rd phantom only.
Fig. 4.
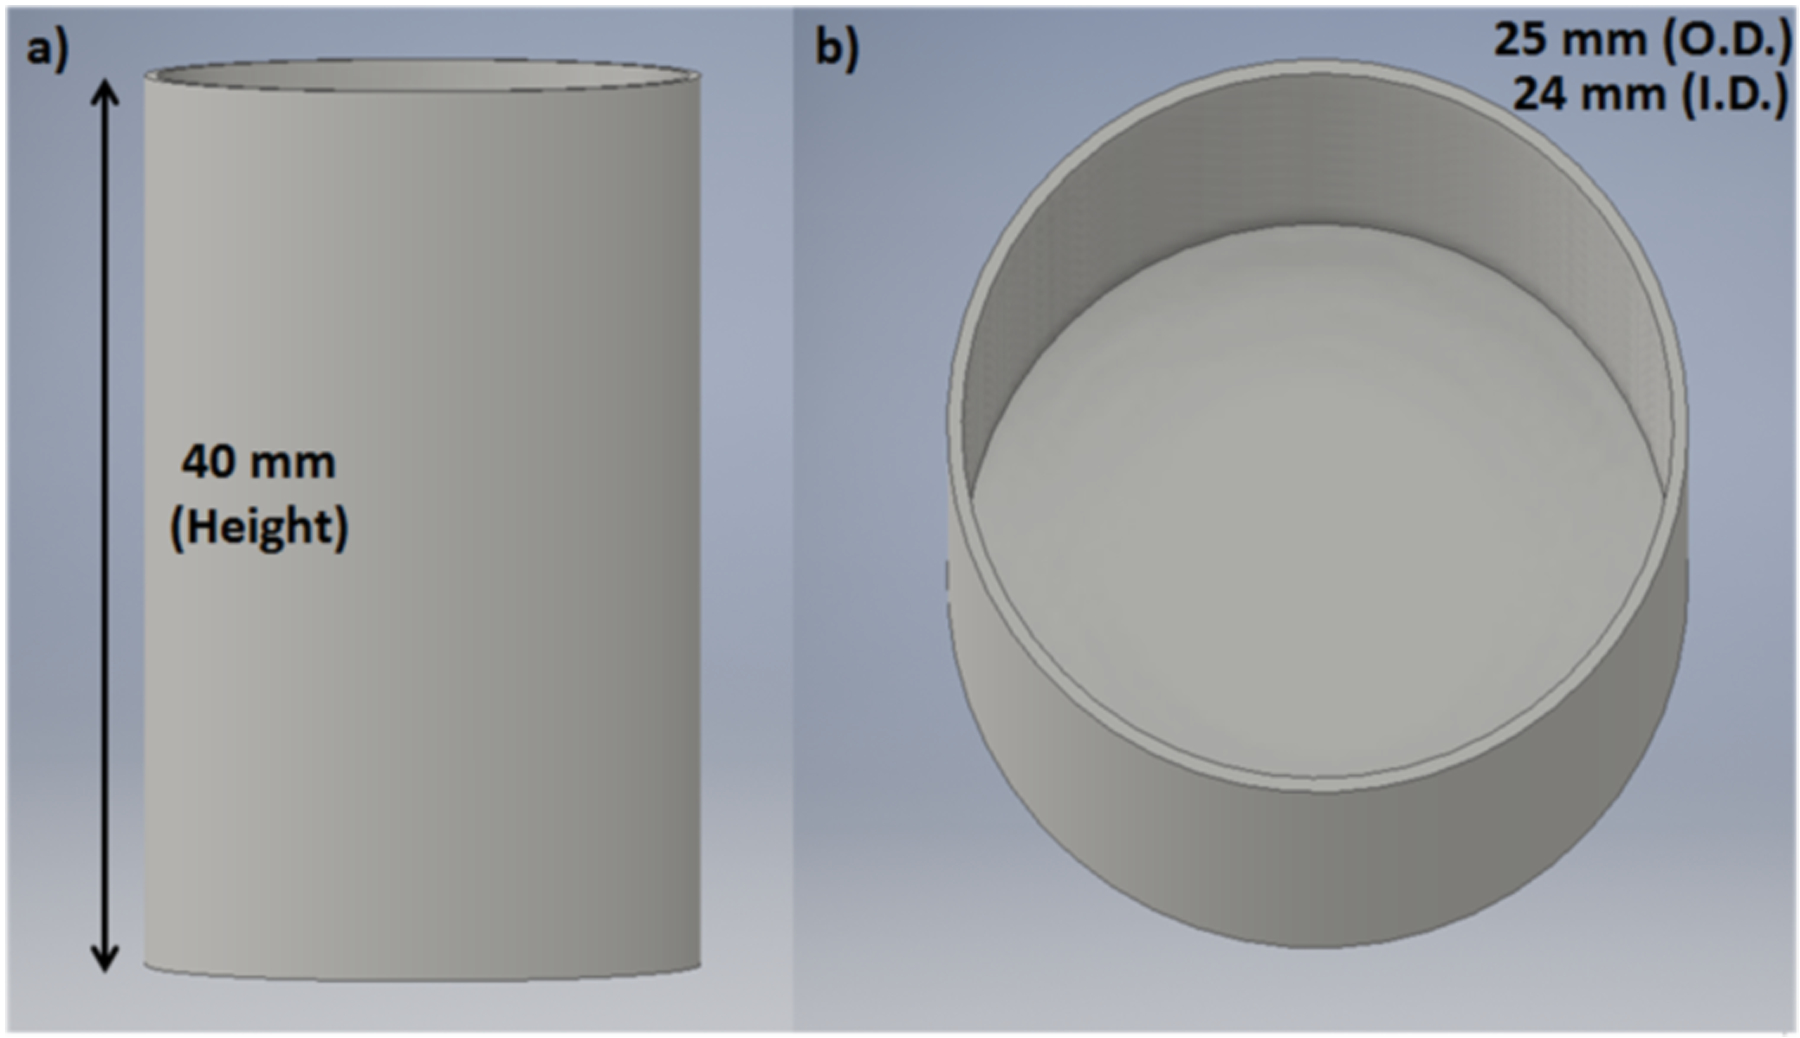
3-D CAD model of the container used for the XLI experiments of air and water. a) side-view and b) top-view.
For the first three phantom experiments, the phantom was placed on the stage of the XLI system (seen in Fig. 2). During the experiments, the x-ray tube was operated at a tube voltage of 50 kV and a tube current of 1.0 mA (50 W) while the EMCCD camera was cooled to a temperature of −92.20°C and operated at the maximum electron-multiplying (EM) gain and sensitivity gain of 255 and 5 respectively. During imaging, the x-ray beam was positioned to excite the center of the phantoms, and for the phantom with the GOS:Eu3+ target, the beam passed the center of the target as well. For the phantom experiments, an EMCCD camera exposure time of 5 seconds was used for each scanning depth (defined as the distance from the scanned section to the top surface of the phantom) of 1 mm to 10 mm (10 depths total, 1 mm increments). We acquired a total of 3 images for each scanning depth to obtain an average. In addition, we took background images (dark images) with the same measurement parameters except with the x-ray tube was off.
Using a 3D printer (Makerbot Replicator 2X, Makerbot), we fabricated a cylindrical black ABS plastic container with an outer diameter (O.D.) of 25 mm and an inner diameter (I.D.) of 24 mm and height of 40 mm with an open top. We performed XLI using the same parameters as the phantom experiment described above for the first three phantoms, except that the EMCCD camera exposure time was increased to 1 minute (1 min). For the XLI of air, we irradiated the empty container. For the XLI of liquid water, we filled the container with distilled water prior to imaging. Similar to the previous experiment, we took 3 images for each scan depth from 1 mm to 10 mm as well as dark images (x-ray off).
2.2. X-ray luminescence spectra
2.2.1. Measurement set-up for the x-ray luminescence spectra
Fig. 5 shows a schematic of the experimental set-up used for the measurements of the x-ray luminescence spectra and Fig. 6 shows a photograph of the set-up. A sample to be measured was placed inside a 3D printed, thin-wall (1 mm) black ABS plastic container which has an optical fiber bundle inserted and sealed into the bottom of the container. The fiber bundle has an aperture diameter of 3 mm and one end was fixed using a lab-made adapter to the front of a spectrograph (Imspector V8E, Specim) which has a spectral sensitivity range from 380 to 800 nm and was calibrated using 2 monochromatic lasers with known wavelengths. The spectrograph was mounted on the same EMCCD camera used for the previous XLI experiments and was operated at the maximum gain and a temperature of −92.20°C.
Fig. 5.
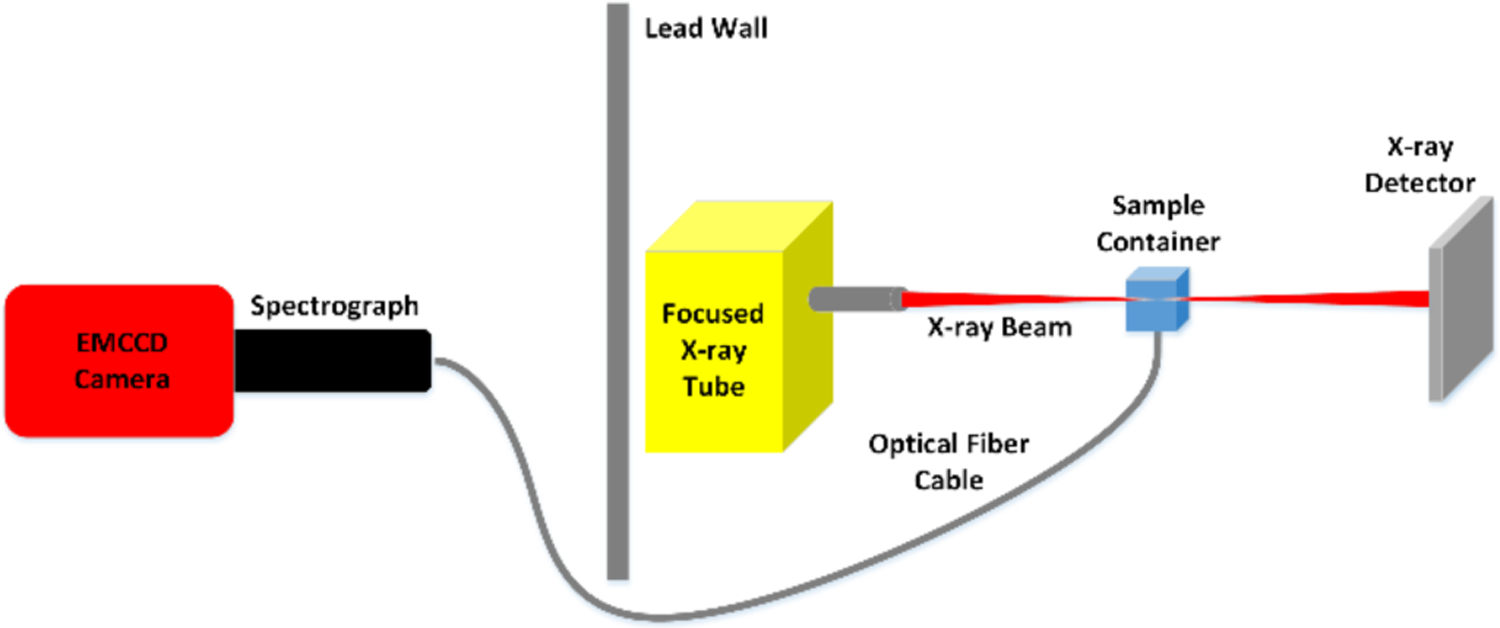
Schematic of the experimental set-up for x-ray luminescence spectrum measurements.
Fig. 6.
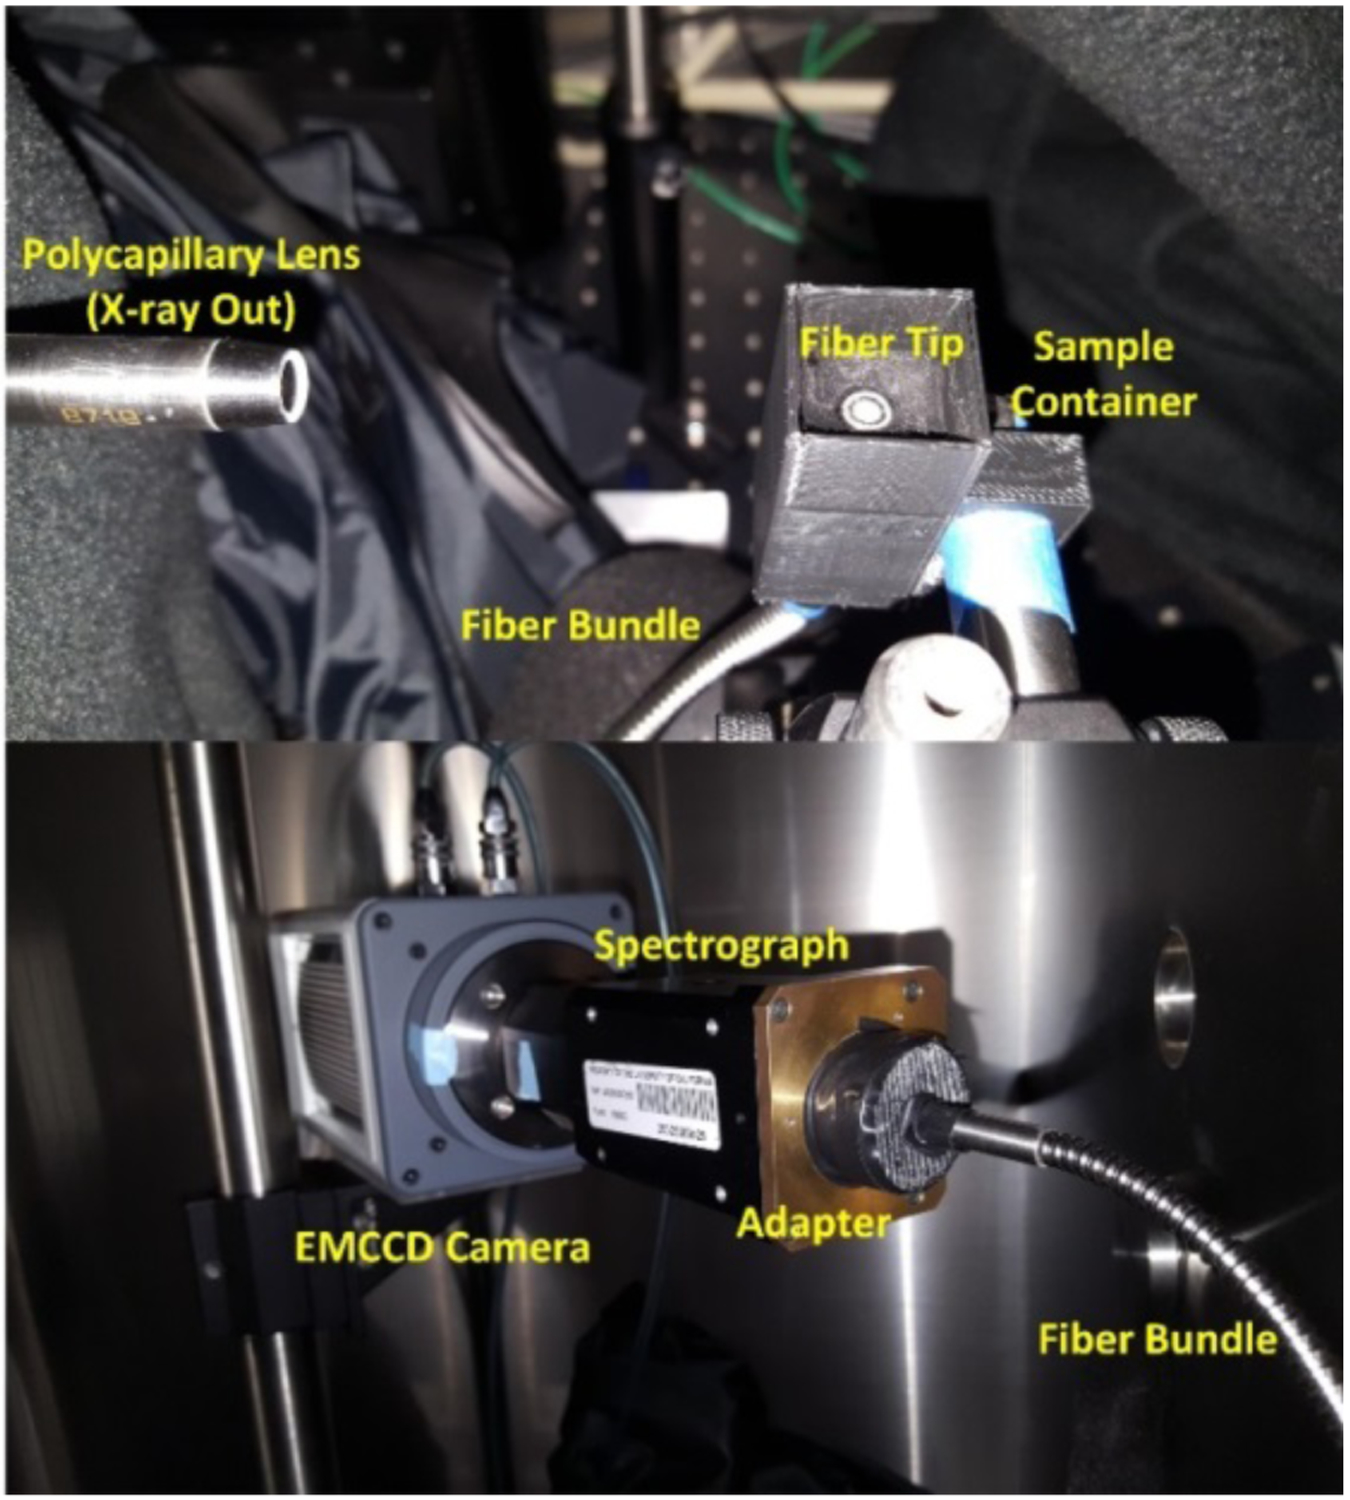
Photograph of the x-ray luminescence spectra measurement set-up. The sample container is shown without the cap so the fiber tip can be visible in the photo. The bottom photo shows the other end of the fiber which delivers the emitted photons to the spectrograph and the EMCCD camera.
2.2.2. Phantoms for the x-ray luminescence spectra
All of the phantoms for the x-ray luminescence spectra measurements and their measurement parameters are listed below in Table 2. The first sample to be measured was a suspension of GOS:Eu3+ particles (1.0 mg/mL) which we used to confirm the known emission peaks from previous literature to ensure that the spectrometer was calibrated properly. The GOS:Eu3+ particles were mixed with distilled water and the solution was poured into the container for measurement. For the GOS:Eu3+ measurement, we used an EMCCD camera exposure time of 1 min. Next, we irradiated and measured the x-ray luminescence spectra of distilled water as well as cubic phantoms made of TiO2 and India ink that had the same optical properties as in the previous XLI phantom experiments as well as an additional phantom composed of 1% Intralipid and 2% agar to compare between two different recipes commonly used for background phantoms. The distilled water was poured into the container for measurement and the phantoms were each cut into cubes of 10 mm2 size and then placed into the container directly on top of the fiber bundle tip. During all measurements, the top of the container is sealed with a black lid to prevent ambient light. Also of note, the stability of water luminescence was confirmed in [20, 30] and it was determined that distilled and tap-water had no difference in radioluminescence intensity and distribution. Lastly, as a simple comparison between the tissue-mimicking phantoms and real biological tissue we also used chicken and pork samples and measured their x-ray luminescence spectra as well. We separated the pure fat portions from the portions containing only the meat and measured the spectra of both separately. The meat and fat were cut into similar sizes as the cubic phantoms before being placed in the container. The exposure time of the EMCCD camera was increased to 10 mins for all of these measurements. For each measurement, the x-ray beam was positioned 2 mm above the optical fiber bundle tip in the container (confirmed using the x-ray detector). After each measurement was taken, a background spectrum was acquired using the same settings with the x-ray beam turned off. The x-ray tube was set to max power for all measurements (50 kV and 1.0 mA). During these experiments, the EMCCD camera and the spectrograph were placed inside of an x-ray shielding, light-tight cabinet and were covered with a black blanket.
Table 2.
Phantoms for the x-ray luminescence spectra
| Phantom Name | Phantom Composition | Measurement Parameters |
|---|---|---|
| GOS:Eu3+ particles | GOS:Eu3+, water | X-ray Tube: 50 kV, 1.0 mA EMCCD Exposure: 60 s |
| Distilled Water | Distilled Water | X-ray Tube: 50 kV, 1.0 mA EMCCD Exposure: 600 s |
| TiO2 Phantom | 2% agar, 1% TiO2, 0.003% India Ink | X-ray Tube: 50 kV, 1.0 mA EMCCD Exposure: 600 s |
| Intralipid Phantom | 2% agar, 1% intralipid | X-ray Tube: 50 kV, 1.0 mA EMCCD Exposure: 600 s |
| Chicken Meat | Chicken Meat | X-ray Tube: 50 kV, 1.0 mA EMCCD Exposure: 600 s |
| Pork Meat | Pork Meat | X-ray Tube: 50 kV, 1.0 mA EMCCD Exposure: 600 s |
| Chicken Fat | Chicken Fat | X-ray Tube: 50 kV, 1.0 mA EMCCD Exposure: 600 s |
| Pork Fat | Pork Fat | X-ray Tube: 50 kV, 1.0 mA EMCCD Exposure: 600 s |
3. RESULTS
A. Results from the XLI experiments
In Fig. 7, we show the top surface measurements by the EMCCD camera for the three different phantoms (Agar phantom (Fig. 7b), TiO2 phantom (Fig. 7c), and the GOS:Eu3+ phantom (Fig. 7d)) under x-ray irradiation for the scanning depth of 5 mm and a background image when the x-ray beam was off (Fig. 7a). For the agar phantom, we can visualize the x-ray beam as it enters the phantom initially, then the intensity quickly fades away. The luminescence intensity seems to increase in the area where the x-ray beam entered the phantom indicating optical photons being generated by the agar phantom from the x-ray irradiation. For the case of the TiO2 phantom with no targets (Fig. 7c), the x-ray beam could not be visualized entering the phantom as we could in Fig. 7b due to the absorption and scattering of optical photons by the phantom, but the overall luminescence intensity from the phantom top surface is still brighter for this case than for water. Lastly, we can see that with the inclusion of a 0.01 mg/mL GOS:Eu3+ target, the overall signal intensity from the phantom top surface increases quite dramatically because the target emits much more photons than the background phantom.
Fig. 7.

Top surface EMCCD camera images for the 5 mm scan depth. a) background image (x-ray off), b) agar phantom (x-ray on), c) TiO2 phantom (x-ray on), d) GOS:Eu3+ phantom (x-ray on). The grayscale indicates the luminescence intensity in arbitrary units.
To further compare the luminescence intensities for the three phantoms for all the scanning depths, we took an elliptical region of interest (ROI) of 2.8 by 5.5 mm2 on the phantom top surface for all three images acquired at each scan depth, and obtained an averaged intensity value in that region. Then using the dark images acquired, we subtracted the mean dark value for all the cases. The final intensity values obtained are then plotted for each case for each of the scanning depths in Fig. 8 using the logarithm (base-10) of the intensities for better visualization. The highest luminescence intensity was seen for the GOS:Eu3+ phantom (red line), then the TiO2 phantom (green line), finally the lowest intensity was seen in the agar phantom (blue line). From Fig. 8, for the scan depth of 1 mm, the ratios of the luminescence intensity for the cases with the GOS:Eu3+ target to the intensity for the TiO2 phantom and for the agar phantom (prior to taking the logarithm) was calculated to be 12.5:1.0 and 18.0:1.0 respectively, which means that the TiO2 phantom and agar phantom is equivalent to a GOS:Eu3+ target with an approximate concentration of 0.8 μg/mL and 0.55 μg/mL, respectively in terms of the emitted luminescence intensity.
Fig. 8.
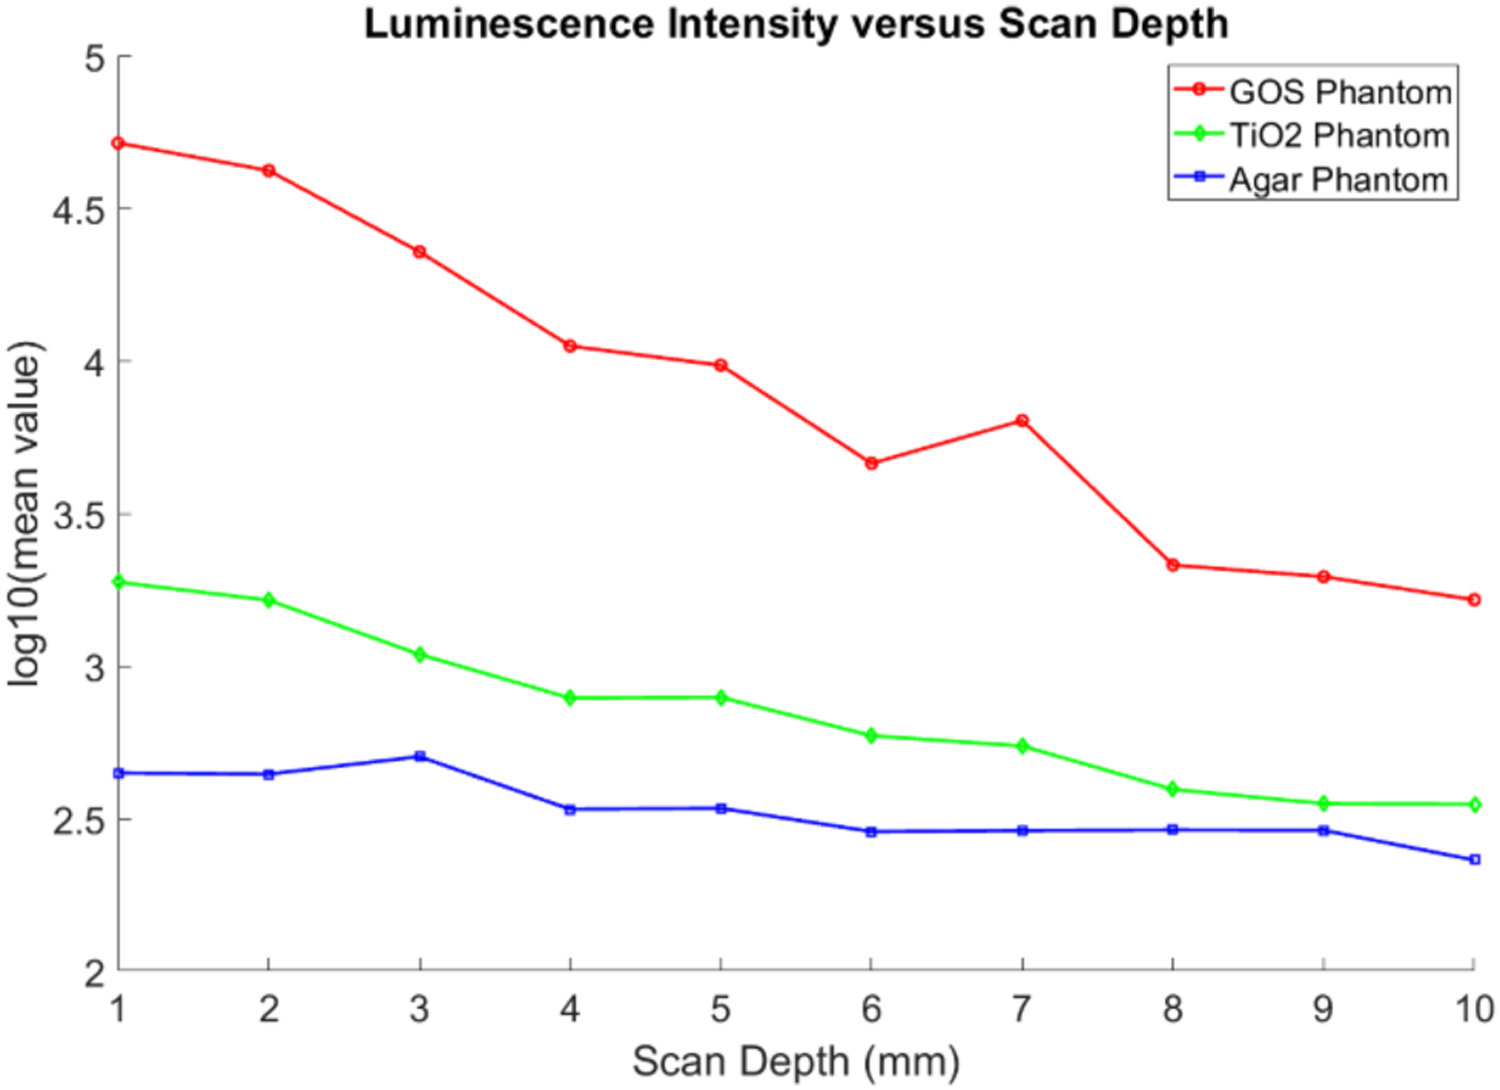
Plot of the luminescence intensity versus the x-ray scan depths for the XLI experiment. Logarithm scale is used to better visualize the intensity differences.
Fig. 9 shows an EMCCD camera image from the irradiation of air (Fig. 9a) and water (Fig. 9b) at the scan depth of 5 mm. The scale of these images was adjusted for better visualization. In both images, the focused x-ray beam could be clearly visualized (from the ionization of air) and for the case of water, we can see as the x-ray beam passes through the water in the container, that there are optical photons being generated despite that the x-ray energy level used (50 kV) is well below the Cerenkov radiation threshold. Because there are three LEDs on our x-ray tube, we can see a small reflection on the top surface of the water in Fig. 9b (highlighted as noise in the figure) due to them not being perfectly covered. To compare the intensity values for different scan depths, we plotted the mean value from a similar 2.8 by 5.5 mm2 elliptical ROI from the 3 images acquired at each scan depth after background subtraction in Fig. 10. We can see that for each scan depth, there was very little difference in the luminescence intensities for both cases. In addition, the average intensity obtained from water was approximately 3 times greater in magnitude than for the case of air.
Fig. 9.
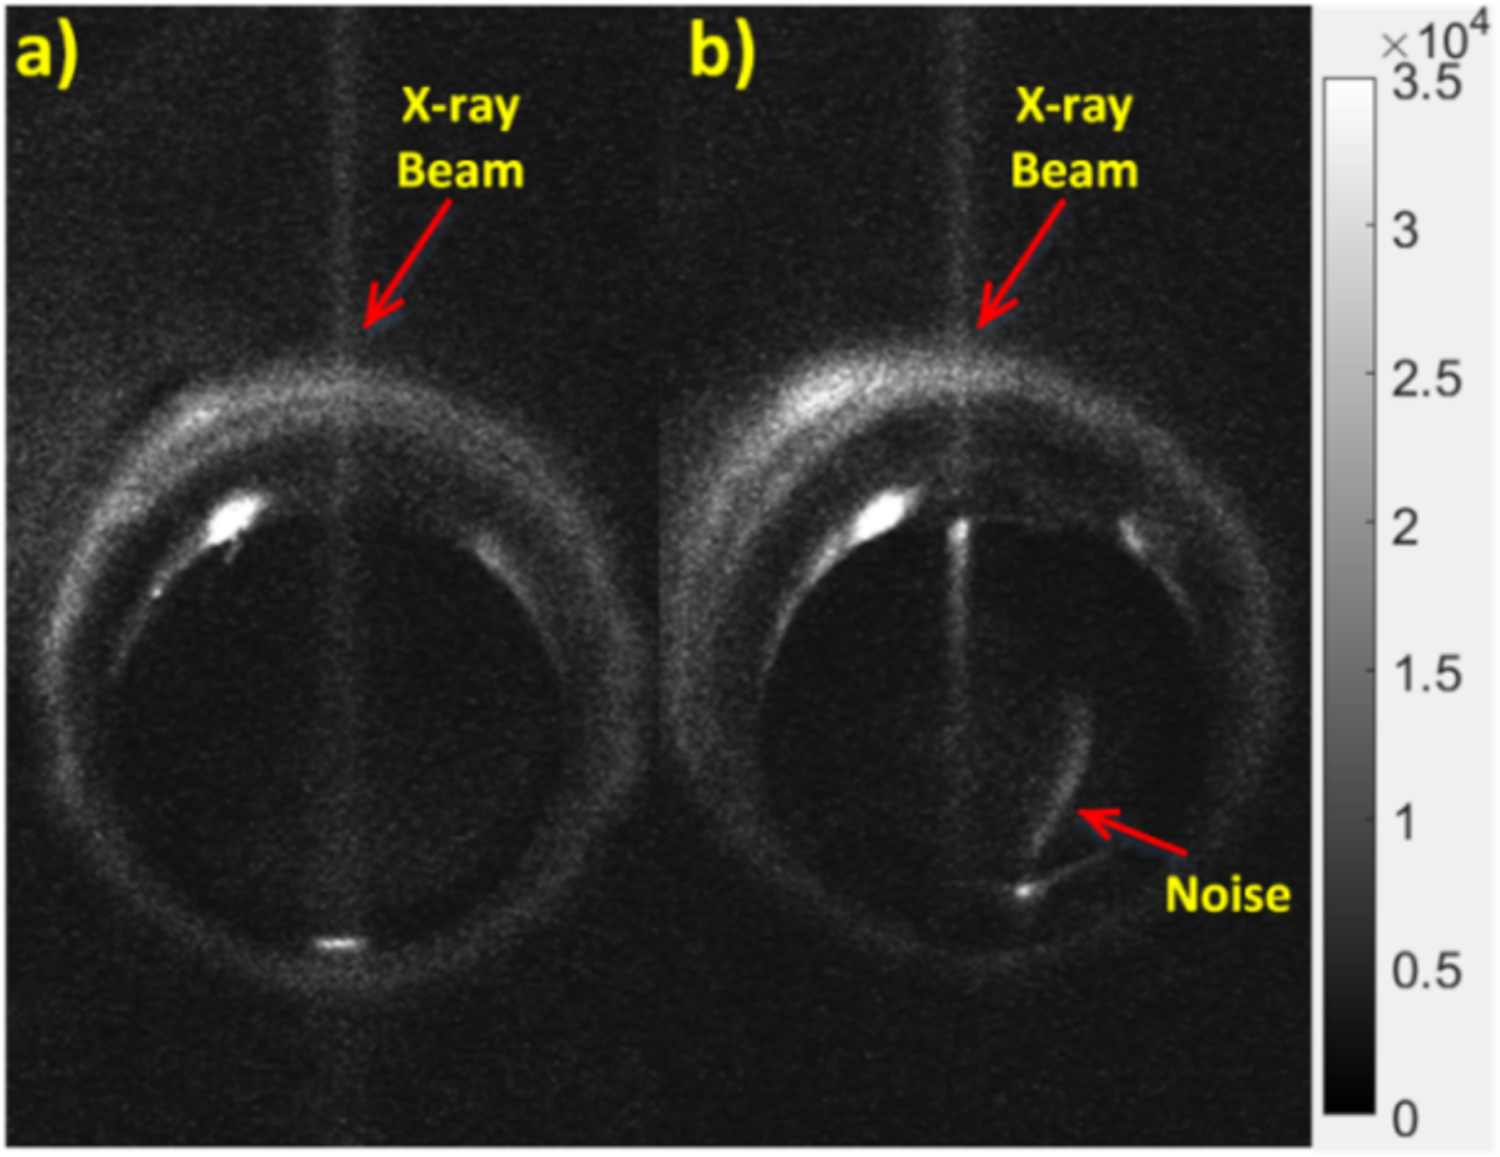
EMCCD camera images with adjusted scale to show the radioluminescence of a) air and b) water at 5 mm scan depth. The grayscale indicates the luminescence intensity in arbitrary units.
Fig. 10.
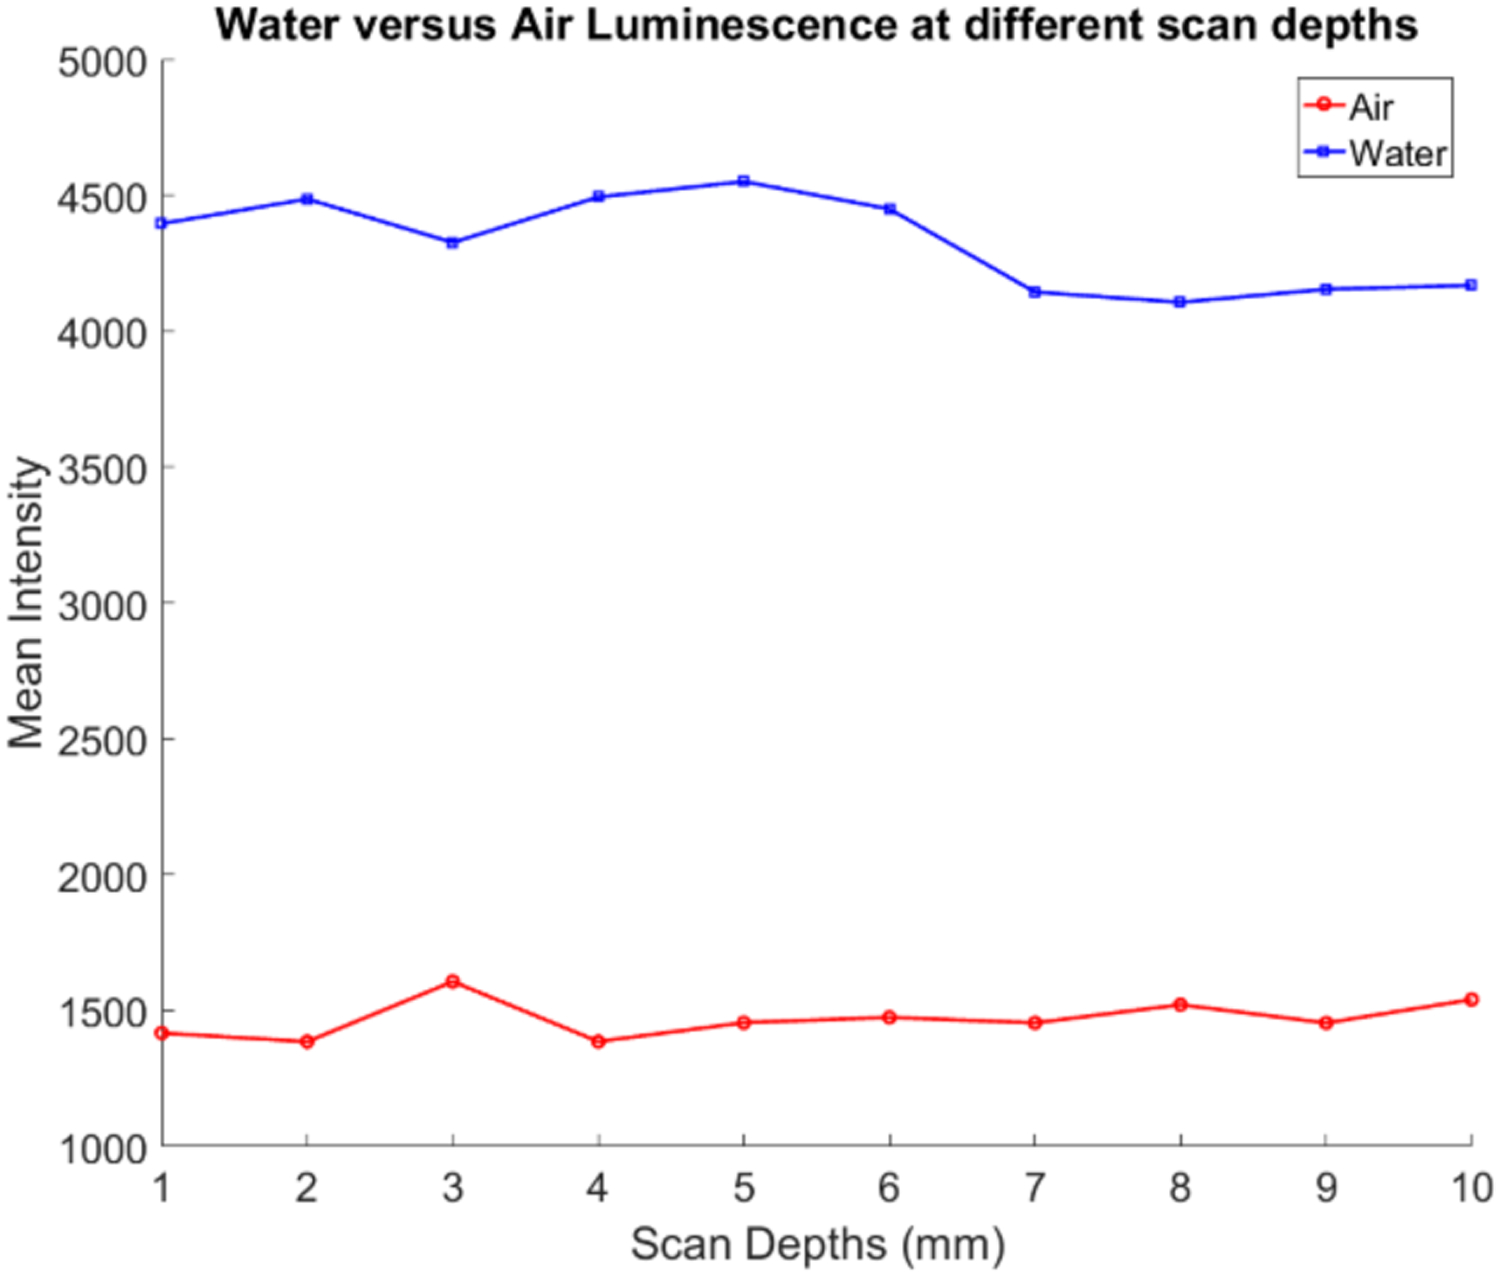
Plot of the mean intensity values versus scanning depth for the intensity differences. case of water (blue line) and air (red line) x-ray luminescence.
B. Results from the x-ray luminescence spectra measurements
After taking the measurements from the spectrograph with the EMCCD camera, a simple image correction was performed on the images to reduce the EMCCD image noise (hot spots) using the open source ImageJ software (ImageJ, NIH). Afterwards, the background spectrum was removed and the final resulting spectra for each case were plotted using MATLAB. The emission spectrum from GOS:Eu3+ is shown in Fig. 11. For the GOS:Eu3+ particles, we identify the emission characteristic peaks at 588, 612, 623, and 703 nm respectively as indicated in Fig. 11, which validates this spectrum measurement system.
Fig. 11.
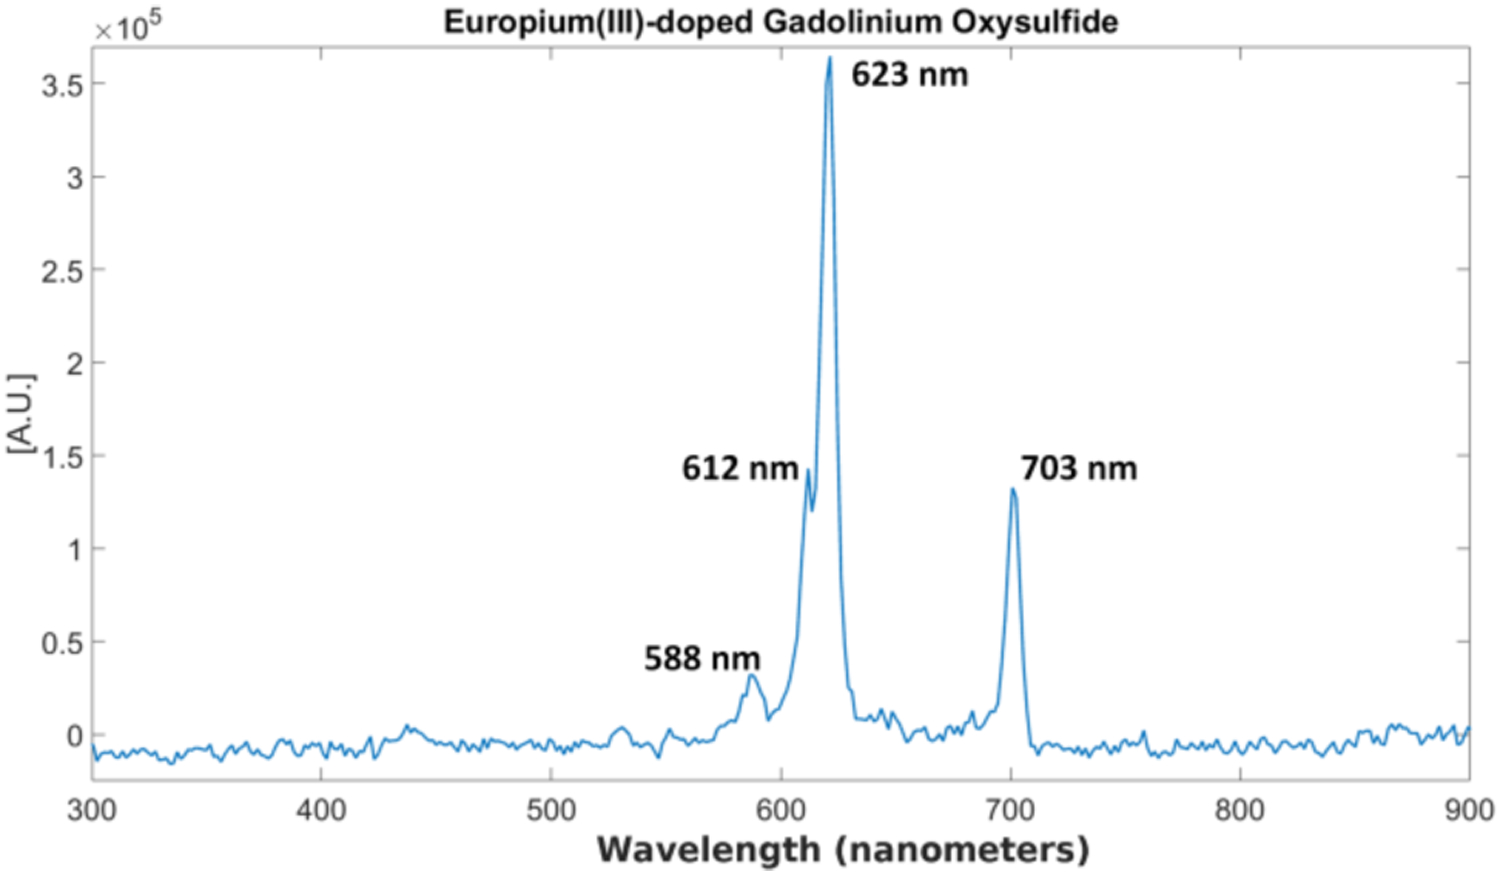
Measured x-ray luminescence spectrum for GOS:Eu3+ particles.
The x-ray luminescence spectra for distilled water and the tissue-mimicking phantoms are shown in Figs. 12 and 13 respectively. For the spectrum of water under x-ray irradiation, we see a broad spectrum across the entire visible range is produced. The two peaks around 775 and 800 nm are from EMCCD camera noise that was not completely removed during the image correction. For the spectrum obtained from the Intralipid phantom (Fig. 13a), we also do not observe any obvious peaks as well and for the spectrum of the phantom made from the TiO2 (Fig. 13b), we see a small but broad peak from around 400 nm to around 700 nm produced under x-ray irradiation which is unseen in the previous two cases. In addition, the overall spectral intensity was also higher in the TiO2 compared with the intralipid. These samples were all measured in the same time window for more comparable results. Lastly, we plotted the measured x-ray luminescence spectra from the chicken and pork meat samples (Fig. 14) and fat samples (Fig. 15). From the spectra obtained from the fat samples (Fig. 15), we can see very obviously in both cases, that there is a large peak around the 600 nm range. With exception to the peak that can be seen at around 525–550 nm for the chicken fat (Fig. 15a), the spectra for fat in both cases seem to share similarities in their overall shape and intensities.
Fig. 12.
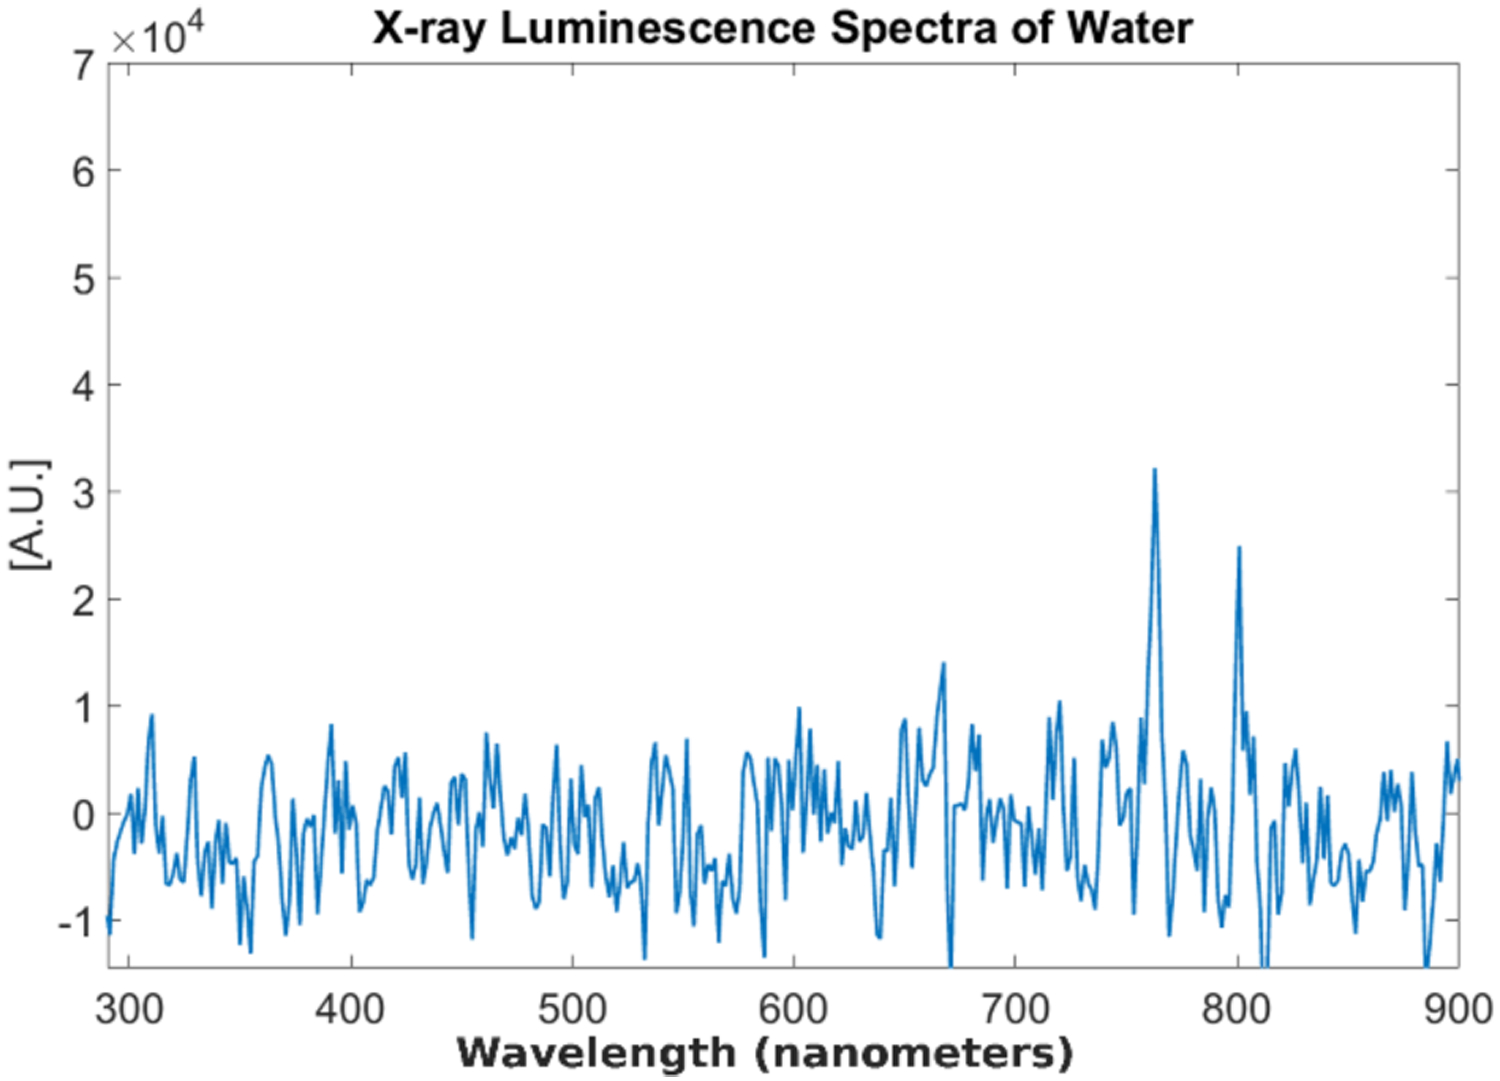
Measured x-ray luminescence spectra from distilled water.
Fig. 13.

Measured x-ray luminescence spectra for the two different tissue phantoms. (a) Intralipid phantom (b) TiO2 phantom.
Fig. 14.

Measured x-ray luminescence spectra from the different meat samples. (a) Chicken meat and (b) Pork meat.
Fig. 15.

Measured x-ray luminescence spectra from the different fat samples. (a) Chicken fat and (b) Pork fat.
4. DISCUSSION AND CONCLUSIONS
In this work, we performed x-ray luminescence imaging (XLI) of air, water, and tissue-mimicking phantoms and measured the x-ray luminescence spectra of water, two different types of tissue-mimicking phantoms, as well as meat and fat samples from both chicken and pork. These sources of optical photons should be considered, as they will limit the molecular sensitivity of XLCT imaging, especially for in vivo imaging studies. From our results of the XLI of the different types of phantoms (Figs. 7 and 8) we can see clear differences in the luminescence intensities for each case. As expected, the GOS:Eu3+ phantom had the highest luminescence intensity. When compared to the luminescence from the TiO2 phantom, we can see that the luminescence intensity was slightly higher than the agar phantom as well which means there is another source of optical photons in the TiO2 phantom. With regards to the luminescence intensity as the scanning depth was increased, we can see an expected drop in the intensity. For the GOS:Eu3+ phantom, we can see that even at the 10 mm scan depth, after subtraction of the background signal, we still have a strong signal which is expected since we were able to reconstruct a similar phantom with the same concentration target in [15, 16] using XLCT for scan depths up to 21 mm. In addition, GOS:Eu3+ is known to emit optical photons in the red and near-infrared range (NIR optic window) with good tissue penetration ability which means that photons can travel longer distances, thus being able to reach the top surface even when generated at large scan depths. If the signal-to-noise ratio is 1, we can estimate that the XLCT imaging sensitivity limitation is about 0.8 μg/mL if the GOS:Eu3+ particles are used as contrast agents. A recently published study has reported that the luminescent efficiency of nanoscale rare-earth phosphors is about 40% of that from the microscale particles (as was used in this paper) [38]. Thus, we can estimate that the XLCT imaging limitation of nanophosphors is about 2.0 μg/mL (or about 5.28 μM) for the phantom experiments. It is worth noting that the imaging limitation is also dependent upon other factors as well such as the imaging depth.
For the experiment comparing the XLI of air and water (Figs. 9 and 10) we can see that water produced a greater luminescence intensity than air, about 3 times the intensity (Fig. 10) and that for the different scanning depths there was very little change in the intensities seen for both due to the fact that there is almost no optical absorption and scattering in these two media. The luminescence of air was expected as it is a well-documented phenomenon and is attributed primarily to the ionization of nitrogen in the air [32–33, 36]. Since the ionization produces optical photons primarily in the range of 350–450 nm, it should not be a major problem for XLCT imaging since photons in this short wavelength range can easily be absorbed by tissues and then filtered with a long pass filter. For the XLI of water, we can see in Fig. 9b for the distilled water and even in Fig. 7b for the agar phantom, that as the x-ray beam entered our sample, the luminescence intensity is actually increased quite a bit as the x-ray energy is being absorbed by the water even though the x-ray photon energy is far below the Cerenkov radiation threshold. Recently, there has been much research regarding the radioluminescence of water at energy levels well below the Cerenkov radiation threshold which was confirmed in our experiment. Currently, the exact mechanism of this phenomenon is not yet fully understood, but several proposals have been made from the ionization of radicals generated in water [34] and more recently as mentioned before, from carbon-ion irradiation experiments, from the electromagnetic pulse produced from the dipole displacement inside water molecules [25]. Reports on the radioluminescence yield of water have also estimated that per 100 keV x-ray photon absorbed, 0.17 optical photons is emitted [36].
In Figs. 11–15, we plotted the results of the different x-ray luminescence spectra for the different cases. In [25], using carbon-ion irradiation and an EMCCD camera equipped with long pass filters at various wavelengths, the spectra of water there was found to range from 300–700 nm, with most of the luminescence occurring in the UV or blue part of the spectrum (300–500 nm). In addition in [26], the radioluminescence of water using alpha particles was also shown to produce a pretty broad spectrum from about 350 to 650 nm. In the spectrum shown for the phantom made from TiO2 and India ink (Fig. 13b), we found that there was a broad emission peak from about 400 to 700 nm which was not seen in the spectrum for Intralipid (Fig. 13a), which might suggest that we prefer to use Intralipid as the optical scatterer instead of TiO2 in future XLCT imaging experiments. As a quick and easy comparison to the tissue-mimicking phantoms, we obtained both chicken and pork from a local store, and separated meat and fat samples from each to see any differences in the obtained spectra. As we can see from Figs. 14 and 15, the spectra we obtained, especially for the fat samples differed quite a bit in terms of the shape. Of course, the meat samples themselves also have small traces of fat as well so we see some similar characteristics in both the meat and fat spectra, although we have a more apparent peak in the fat samples that arises starting in both at around 400 nm and extending to approximately 700 nm. Compared with the tissue-mimicking phantoms, it looks like the meat does not have any obvious emission peaks as seen in Fig. 14. The fat spectra, however, has a more noticeable emission peak as seen in Fig. 15. If nanophosphors that emit at 700 nm or longer are used for XLI/XLCT imaging the background luminescence at the shorter wavelengths can be spectrally filtered out, if necessary, to obtain a higher signal-to-background (SBR) ratio for improved imaging. In addition, other techniques for removing background noise can also be used to achieve a higher SBR for XLCT to improve the image quality. For example, more recently there has been much interest in applying deep-learning methods to aid in not only image analysis, but also in image reconstruction [39, 40]. For example, we could incorporate different information such as spectral or spatial information (e.g. x-ray beam location) to reduce unwanted background signals via post-processing. We could possibly remove the photons caused by air scintillation since this phenomenon can be observed directly from the images by possibly training an algorithm to recognize this (similar to pattern recognition). In addition, we could possibly monitor the x-ray beam position and remove any signals not in the trajectory which would improve the imaging.
In summary, we have measured the x-ray luminescence intensity from distilled water and different phantoms, from which we can see that the luminescence intensity from the phantom background is equivalent to a GOS:Eu3+ microphosphor target concentration of 0.8 μg/mL or 2.0 μg/mL (5.28 μM) for nanophosphor GOS:Eu3+. We have validated our x-ray luminescence spectrum measurement set-up and then measured the x-ray luminescence spectrum from distilled water, an Intralipid phantom, a TiO2 phantom, as well as samples of both chicken and pork meat and fat as comparisons to real biological tissue. Our results suggest that it is better to use Intralipid instead of TiO2 phantoms for future XLCT phantom imaging studies.
Acknowledgment.
We thank Dr. Simon R. Cherry from UC Davis for lending us the spectrograph used for the spectra measurements.
Funding Information. National Institutes of Health (NIH) (R01 EB026646); University of California, Merced (Start-up funds).
Footnotes
Disclosure. The authors declare that there are no conflicts of interest related to this article.
References
- 1.Chen H, Longfield DE, Varahagiri VS, Nguyen KT, Patrick AL, Qian H, VanDerveer DG, and Anker JN, “Optical imaging in tissue using X-ray excited luminescent sensors,” Roy. Chem. Soc. Analyst, 136, 3438–45 (2011). [DOI] [PubMed] [Google Scholar]
- 2.Chen H, Patrick AL, Yang Z, Vanderveer DG, and Anker JN, “High-resolution Chemical Imaging Through Tissue with an X-ray Scintillator Sensor,” ACS Analy. Chem 83, 5045–49 (2011). [DOI] [PubMed] [Google Scholar]
- 3.Pratx G, Carpenter CM, Sun C, Rao R, and Xing L, “Tomographic molecular imaging of x-ray excitable nanoparticles,” Opt. Lett 35, 3345–3347 (2010). [DOI] [PubMed] [Google Scholar]
- 4.Pratx G, Carpenter CM, Sun C, and Xing L, “X-ray luminescence computed tomography via selective excitation: a feasibility study,” IEEE Trans. Med. Imag 29, 1992–99 (2010). [DOI] [PubMed] [Google Scholar]
- 5.Carpenter CM, Sun C, and Pratx G, “Hybrid x-ray/optical luminescence imaging: characterization of experimental conditions,” Med. Phys 37, 4011–4018 (2010). [DOI] [PMC free article] [PubMed] [Google Scholar]
- 6.Chen D, Zhu S, Yi H, Zhang X, Chen D, Jiang J, and Tian J, “Cone beam x-ray luminescence computed tomography: a feasibility study,” Med. Phys 40, 031111 (2013). [DOI] [PubMed] [Google Scholar]
- 7.Chen D, Zhu S, Cao X, Zhao F, and Liang J, “X-ray luminescence computed tomography based on x-ray distribution and adaptively split Bregman method,” Biomed. Opt. Expr 6, 2649–2663 (2015). [DOI] [PMC free article] [PubMed] [Google Scholar]
- 8.Liu X, Liao Q, and Wang H, “In vivo x-ray luminescence tomographic imaging with single-view data,” Opt. Lett 38 (22), 4530–3 (2013). [DOI] [PubMed] [Google Scholar]
- 9.Liu X, Liao Q, and Wang H, “Fast x-ray luminescence computed tomography imaging,” IEEE Trans. Biomed. Eng 61, 1621–27 (2014). [DOI] [PubMed] [Google Scholar]
- 10.Cong W, Shen H, and Wang G, “Spectrally resolving and scattering-compensated x-ray luminescence/fluorescence computed tomography,” J. of Biomed. Opt 16 (6) (2011). [DOI] [PMC free article] [PubMed] [Google Scholar]
- 11.Li C, Di K, Bec J, and Cherry SR, “X-ray luminescence computed tomography imaging: experimental studies,” Opt. Lett 38, 2339–41 (2013). [DOI] [PMC free article] [PubMed] [Google Scholar]
- 12.Li C, Martinez-Davalos A, and Cherry SR, “Numerical simulation of x-ray luminescence computed tomography for small-animal imaging,” J. of Biomed. Opt 19, 046002 (2014). [DOI] [PMC free article] [PubMed] [Google Scholar]
- 13.Zhang W, Zhu D, Lun M, and Li C, “Collimated superfine x-ray beam based x-ray luminescence computed tomography,” J. of X-ray Sci. and Techn 25 (6), pp 945–957, (2017). [DOI] [PMC free article] [PubMed] [Google Scholar]
- 14.Zhang W, Zhu D, Lun M, and Li C, “Multiple pinhole collimator based x-ray luminescence computed tomography ,” Biomed. Opt. Expr 7 (7), 2506–23 (2016). [DOI] [PMC free article] [PubMed] [Google Scholar]
- 15.Lun MC, Zhang W, and Li C, “X-ray luminescence computed tomography: a sensitivity study,” Proc. of SPIE, Vol. 10057 (2017). [DOI] [PMC free article] [PubMed] [Google Scholar]
- 16.Lun MC, Zhang W, and Li C, “Sensitivity study of x-ray luminescence computed tomography,” Appl. Opt 56 (11), 3010–3019 (2017). [DOI] [PMC free article] [PubMed] [Google Scholar]
- 17.Zhang W, Lun MC, Nguyen A, and Li C, “A focused x-ray beam based x-ray luminescence computed tomography,” J. of Biomed. Opt 22 (11), 116004 (2017). [DOI] [PMC free article] [PubMed] [Google Scholar]
- 18.Lun MC, Zhang W, Zhao Y, Anker JN, Cong W, Wang G, and Li C, “Development of a focused-X-ray luminescence tomography (FXLT) system,” arXiv:1709.10186 [physics.med-ph] (September 2017). [Google Scholar]
- 19.Quigley BP, Smith CD, Cheng S, Souris JS, Pelizarri CA, Chen C, Lo L, Reft CS, Wiersma RD, La Riviere PJ, “Sensitivity Evaluation and Selective Plane Imaging Geometry for X-ray Induced Luminescence Imaging,” Med. Phys 44 (10), 5367–5377 (2017). [DOI] [PMC free article] [PubMed] [Google Scholar]
- 20.Yamamoto S, Toshito T, Okumura S, and Komori M, “Luminescence Imaging of water during proton-beam irradiation for range estimation,” Med. Phys 42 (11) (2015). [DOI] [PubMed] [Google Scholar]
- 21.Komori M, Sekihara E, Yabe T, Horita R, Toshito T, and Yamamoto S, “Luminescence imaging of water during uniform-field irradiation by spot scanning proton beams,” Phys. in Med. & Bio 63 (2018). [DOI] [PubMed] [Google Scholar]
- 22.Yabe T, Komori M, Horita R, Toshito T, and Yamamoto S, “Estimation of the optical errors on the luminescence imaging of water for proton beam,” Nucl. Inst. and Meth. in Phys. Res., A, 888 (2018). [Google Scholar]
- 23.Yabe T, Sasano M, Hirano Y, Toshito T, Akagi T, Yamashita T, Hayashi M, Azuma T, Sakamoto Y, Komori M, and Yamamoto S, “Addition of luminescence process in Monte Carlo simulation to precisely estimate the light emitted from water during proton and carbon-ion irradiation,” Phys. in Med. and Bio 63 (2018). [DOI] [PubMed] [Google Scholar]
- 24.Yamamoto S, Komori M, Akagi T, Yamashita T, Koyama S, Morishita Y, Sekihara E, and Toshito T, “Luminescence imaging of water during carbon-ion irradiation for range estimation,” Med. Phys 43 (5), (2016). [DOI] [PubMed] [Google Scholar]
- 25.Yamamoto S, Akagi T, Yamashita T, Toivonen J, Yamaguchi M, Komori M, and Kawachi N, “Source of luminescence of water lower energy than the Cerenkov-light threshold during irradiation of carbon-ion,” J. of Phys. Commun 2 (2018). [Google Scholar]
- 26.Yamamoto S, Komori M, Koyama S, and Toshito T, “Luminescence imaging of water during alpha particle irradiation,” Nucl. Inst. and Meth. in Phys. Res., A, 819 (2016). [Google Scholar]
- 27.Yamamoto S, “Luminescence Imaging of Water During Irradiation of Beta Particles with Energy Lower than Cerenkov-Light threshold,” Trans. on Rad. and Plas. Med. Sci, Vol. 1, No. 4 (2017). [Google Scholar]
- 28.Yabe T, Komori M, Toshito T, Yamaguchi M, Kawachi N, and Yamamoto S, “Estimation and correction of produced light from prompt gamma photons on luminescence imaging of water for proton therapy dosimetry,” Phys. in Med. and Bio 63 (2018). [DOI] [PubMed] [Google Scholar]
- 29.Yamamoto S, Koyama S, Komori M, and Toshito T, “Luminescence imaging of water during irradiation of X-ray photons lower energy than Cerenkov-light threshold,” Nucl. Inst. and Meth. in Phys. Res., A, 832 (2016). [Google Scholar]
- 30.Yamamoto S, Koyama S, Yabe T, Komori M, Tada J, Ito S, Toshito T, Hirata T, and Watanabe K, “Stability and linearity of luminescence imaging of water during irradiation of proton-beams and x-ray photons lower energy than the Cerenkov threshold,” Nucl. Inst. and Meth. in Phys. Res., A, 883 (2018). [Google Scholar]
- 31.Yamamoto S, Koyoma S, Komori M, and Toshito T, “Luminescence imaging of water during irradiation of X-ray photons lower than Cerenkov-light threshold,” Nucl. Inst. and Meth. in Phys. Res., A, 832 (2016). [Google Scholar]
- 32.Yamamoto S, Toshito T, Akagi T, Yamashita T, Komori M, “Scintillation imaging of air during proton and carbon-ion beam irradiations,” Nucl. Inst. and Meth. in Phys. Res., A, 833 (2016). [Google Scholar]
- 33.Fahimian B, Ceballos A, Turkan S, Kapp DS, and Pratx G, “Seeing the invisible: direct visualization of therapeutic radiation beams using air scintillation,” Med. Phys 41 (1), 010702 (2014). [DOI] [PubMed] [Google Scholar]
- 34.Yamamoto S, “Discovery of luminescence of water during radiation irradiation and application for medical physics,” Proc. of SPIE, Vol. 10049 (2017). [Google Scholar]
- 35.Tarasov MD, El’yash SL, Goncharova VF, Petrushin ON, Savel’ev YA, Tarakanov MY, and Shigaev YS, “Efficiency of radioluminescence of water under the action of accelerated electrons,” Inst. and Exp. Techn 50 (6), 761–763 (2007). [Google Scholar]
- 36.Pratx G, “A tale of two photons: radioluminescence and its application in molecular imaging,” Proc. of SPIE, Vol. 10049 (2017). [Google Scholar]
- 37.Li C, Mitchell GS, Dutta J, Ahn S, Leahy RM, and Cherry SR, “A three-dimensional multispectral fluorescence optical tomography imaging system for small animals based on a conical mirror design,” Opt. Expr 17, 7571–7585 (2009). [DOI] [PMC free article] [PubMed] [Google Scholar]
- 38.Chen HY, Wang FL, Moore TL, Qi B, Suleimanovic D, Hwu SJ, Mefford OT, Alexis F, Anker JN, “Bright x-ray and up-conversion nanophosphors annealed using encapsulated sintering agents for biomedical applications,” J. of Mater. Chem. B 5 (27), 5412–5424 (2017). [DOI] [PMC free article] [PubMed] [Google Scholar]
- 39.Wang G, “A perspective on deep imaging,” IEEE Access Vol. 4, (2016). [Google Scholar]
- 40.Wang G, Ye JC, Mueller K, and Fessler JA, “Image reconstruction is a new frontier of machine learning,” IEEE Trans. on Med. Imag, Vol. 27, No. 6, June 2018. [DOI] [PubMed] [Google Scholar]


