

Abstract
Objectives:
This study reports findings on functional change trajectories for long-stay residents by examining the effects of baseline medical conditions and functional status on changes in physical impairment across residents’ length of stay (LOS).
Method:
A 5% sample of nursing home residents from Michigan from 1999 through 2003 was used to create longitudinal episodes of care including Minimum Data Set (MDS) assessments. Data were analyzed using hierarchical linear models.
Results:
On average, physical impairment increases throughout a resident’s stay and is more rapid later in the stay. Greater physical and cognitive impairment at baseline leads to increasing impairment for residents whereas presence of baseline medical conditions, including heart disease and hip fracture, leads to slower rates of impairment.
Discussion:
Baseline functional status is critical to predicting changes in impairment while the impact of medical diagnoses is significant but weaker than the effect of baseline impairment.
Keywords: health services, nursing homes, physical function
Medical conditions can have complex effects on the functional status of the elderly (Lee, Cigolle, & Blaum, 2009), and some older adults are frail, typically due to an ill-defined etiology (Fried et al., 2001; Rockwood, Abeysundera, & Mitnitski, 2007). Subsequently, elderly can experience decrements in the ability to perform activities of daily living (ADL), which define the extent that individuals require extensive and routine assistance with their lives (Verbrugge & Jette, 1994). Frailty itself is frequently conceptualized as a system-level decline that represents a “general vulnerability to environmental challenge” and that often results in functional loss (Yang and Lee, 2010). Functional status is subsequently a key factor determining the extent of services needed and health outcomes of long-stay nursing home residents (Gillen, Spore, Mor, & Freiberger, 1996; Katz, 1983; Wang, Kane, Eberly, Virnig, & Chang, 2009).
Admission and the early period of a nursing home stay are critical times at which existing functional impairment may have a lasting impact on a resident’s health outcomes during their length of stay (LOS) in the nursing home. Nursing home admission is frequently preceded by an immediate decline or medical problem which leads to institutionalization (Banaszak-Holl et al., 2004; Luppa et al., 2009). Furthermore, institutionalization represents a transition in the resident’s medical care and his environment, with disruption of existing social support and clinical service systems in addition to increasing stress on the resident (Freedman, 1996). During this period, nursing home staff will use a resident’s arrival as a time to assess clinical needs and set care planning. All of these changes can have a lasting impact on the nursing home resident’s health.
This article reports results of a unique study of functional change trajectories for long-stay residents and identifies the impact of baseline functional status on patterns of change across residents’ stays. A health trajectory is the pathway through time of health states that an individual experiences, and includes transitions across successive months and years, constituting a class of longitudinal outcome measures. We limit this study to long-stay residents because short-stay residents frequently come from the hospital, predominately need intensive rehabilitative and medical services for narrowly defined health problems and are largely covered by Medicare (Boaz & Muller, 1994; Gill et al., 2009; Liu & Manton, 1983). Grabowski (2007) indicates that the bifurcated payment systems for short and long stayers is partly responsible for the differences in both service use and needs within these populations, which is supported by data on these populations (Decker, 2005). Because this study examines patterns of change across longer periods and is focused on functional status changes rather than changes related to immediate medical needs or service use, we exclude short stayers from our study.
At the same time, we take advantage of recent availability of health assessments across resident stays. We use slightly more than 4 years of Minimum Data Set (MDS) assessment records for a random sample of Michigan nursing home residents to predict intraindividual differences. Much of the research on health changes in the nursing home population focuses on a limited set of medical outcomes (Richardson, Bedard, & Weaver, 2001) or has studied transitions between a relatively small number of time points, most often only two periods (Buttar, Blaum, & Fries, 2001; Gillen et al., 1996). In contrast, our investigation mirrors community studies, which have long studied trajectories of disease prevalence and functional status across multiple years (Gill, Guo, & Allore, 2008; Martin, Shoeni, Freedman, & Andreski, 2007).
For long-stay residents, we suggest that functional impairment at baseline will lead to future and lasting decline. We expect that among incoming residents, higher initial impairment reflects greater vulnerability and subsequently leads to faster loss in functioning as compared to those entering the nursing home with less impairment. This should hold equally true for those with cognitive deficits, which are not necessarily related to physical frailty but have been shown to be a significant factor in declining health (McConnell, Branch, Sloane, & Pieper, 2003). Specifically, we test two hypotheses regarding the long-term impact of baseline functional status.
Hypothesis 1: Greater physical impairment at baseline leads to increases in functional impairment over time and a greater rate of impairment over the LOS.
Hypothesis 2: Greater cognitive impairment at baseline leads to increases in functional impairment over time and a greater rate of impairment over the LOS.
As part of the study, we evaluate whether impairment accelerates with LOS and compare the effects of baseline clinical conditions on functional impairment.
Method
Study Population
We examine changes in functional impairment over as much of a stay as possible and using a sample drawn from the full population of nursing home residents in Michigan. Data include MDS version 2.0 assessments collected across the 5 years from July 1998 to May 2003. Use of these data was granted through a Data Use Agreement with the State of Michigan, approved for human participants through the University of Michigan IRB, and accessed through the University of Michigan Assessment Archive Project (UMAAP). An important aspect of the UMAAP data is that it includes all the assessments for the population of nursing home residents within the state, not just a sample.
The MDS is a component of the National Nursing Home Resident Assessment Instrument (RAI), and is reliable and valid for residents’ physical and cognitive functioning with more than 100 questions on demographics, cognitive functioning, physical functioning, continence, disease diagnoses, and other health conditions (Frederiksen, Tariot, & De Jonghe, 1996; Hawes et al., 1995; Sgadari et al., 1997; Zhang, Paek, & Wan, 2009). Assessments are performed at admission, quarterly intervals, on significant changes in health and periodically at or close to the 5th, 14th, 30th, 60th, & 90th days during the LOS. Discharge records include date and reason for discharge. Mandated use of the MDS has increased availability of resident data across multiple years (Zhang et al., 2009).
The population includes 178,808 residents and 1,315,605 records over the study period. We dropped residents with only a discharge record or who had no admission date. A 5% random sample of 8,825 residents (and their 48,401 assessments) was used in analyses to enhance computational speed, and given that this is a random sample, no weighting of observations is used. Analyses were redone using a second 5% random sample to evaluate whether results can be replicated and validated across samples. Those analyses are not reported here because they did not vary significantly from reported results. In this article, analyses are only reported for those with long stays of more than 6 months (N = 3,634), although analyses were also repeated for those with short stays of less than 6 months (N = 5,191), and those with short stays less than 3 months (N = 4,378, a subset of those with stays less than 6 months).
Nursing home stays end in one of three ways: (a) a death, recorded if discharge status is “deceased,” (b) transfer to another setting, defined as discharged for reasons other than deceased and including discharge home or transfer to a hospital or other facility, and (c) censoring if the resident is still in the facility at the end of the study period.
Measurement
Functional Status and Change
Functional status is measured using the computed ADL Hierarchy Index (AHI; Morris, Fries, & Morris, 1999) at baseline and at each assessment. The AHI is reported to be both reliable and valid and is calculated using four ADLs critical to those requiring long-term care. These four ADLs include the following: (a) whether the resident requires help with locomotion, (b) requires assistance in eating, (c) toilet use, and (d) personal hygiene. The extent of a resident’s independence in an ADL ranges from totally independent (0) to totally dependent (4). The AHI takes into consideration the relationship across ADL using a hierarchical coding scheme that includes the progression in which ADLs are commonly lost and does not double count ADLs commonly lost together. Hence, the AHI scale has a more limited range from 0 (no impairment) to 6 (total dependence) than an independent count of ADL changes would include. The AHI was developed specifically to be sensitive to changes in late loss ADLs as is commonly observed in the nursing home setting and this measure has been used historically and is still used in current nursing home studies (Morris, Fries, & Morris, 1999; Wang et al., 2009). Although an ordinal scale, the AHI in this population comes close to a Normal distribution with a mean relatively close to the center of the scale (for the range of 0 to 6, the mean for this variable is 3.43 with a standard deviation of 1.67, skewness of .142 and kurtosis of 2.18). Further information on the distribution of the AHI is provided with other descriptive statistics in the results section.
LOS
LOS is measured as the time from admission until a resident’s-recorded assessment during the study period. LOS varies across a resident’s stay. Although residents may be discharged and readmitted repeatedly, residents with stays that were interrupted by an interval of less than 6 months are treated as having a continuous episode of care (in these cases, functional change during gaps is not observed but is available through the LOS). An interval of more than 6 months outside a nursing home leads to the creation of a new episode for that resident; sensitivity analyses were done on the multivariate hierarchical models to determine whether residents with multiple episodes had different patterns of functional change but the episode variable was not significant.
Although analyses are limited to long stayers, changes in functional change are observed across the full LOS including the initial 6 months. As described in our analytic methods, we use a sample selection variable to model whether the likelihood of being a short stayer affects our model.
Cognitive Performance
Cognitive impairment is measured at baseline using the Cognitive Performance Scale (CPS), which is reported to be reliable and valid (Hirdes et al., 2002). The CPS uses MDS questions on cognition and mobility to identify the resident’s level of cognitive functioning (Morris, Fries, Mehr et al., 1994) and correlates well with other measures of cognition such as the Mini-Mental State Examination (Hartmaier et al., 1995). The CPS is composed from measures that include the resident’s time awake, whether the resident is comatose, whether the resident has bed mobility, transfer capability, eating and toileting capability, extent of short-term memory loss, cognitive skills for daily decision making, and whether the resident can make him- or herself understood. The CPS ranges from 0 (intact) to 6 (very severe impairment). Although the CPS scale includes several measures of functioning in ADL, the CPS is distinct in its incorporation of other critical elements of cognitive performance; subsequently, the correlation between CPS and AHI at baseline is only .36, well below the criterion for multicollinearity.
Clinical Diagnosis
Baseline measures of disease conditions are also taken from the resident’s first available assessment. Disease diagnoses include the presence of cancer, heart disease (including arteriosclerotic heart disease, cardiac dysrhythmias, congestive heart failure, and other cardiovascular conditions), diabetes, hip fracture, and stroke. They are not comprehensive of resident’s clinical conditions but represent major conditions contributing to chronic disability among nursing home residents. Among these conditions, hip fracture and stroke may result from a number of clinical conditions but are also themselves disabling (Liebson, Toteson, Gabriel, Ransom, & Melton, 2002).
These are limited measures for disease conditions but include only what is available in the MDS. MDS data are fairly reliable overall, and measures in the MDS are more reliable for chronic conditions and those directly related to the long-term needs of nursing home residents (Intrator, Mor, Unruh, Nathilvar, & Feng, 2009). MDS data on disease conditions, however, do not include the severity of disease diagnoses and are limited in comparison to Medicare diagnostic codes or clinical diagnoses, which were unavailable in this case. Finally, we recognize that the diagnoses at baseline may not persist across the resident’s stay although for the most part, the chosen clinical diagnoses include chronic conditions that will likely persist (except for hip fracture, which was also included because of its importance to this population). Overall, the analyses focus on the potential long-term consequences of clinical conditions present early in the nursing home stay.
Residents’ gender, age, and education at baseline assessment are also included in the model. Age was converted to a dummy variable that indicates whether the resident belongs to the group of the oldest old, those 85 years and older (variable was coded 1 = age 85 years or older, and 0 = otherwise). The oldest old have been found to have the heaviest use of nursing home care (Campion, 1994; Fries et al., 2000). Education was converted to values equal to the mid-point of categories in terms of years achieved: 0 = no formal education, 4.5 = an 8th-grade education or less, 10 = an education of 9–11 years, 12 = completion of either high school, technical, or trade school, 14 = some college education, 16 = a bachelor’s degree, and 17 = graduate degree.
Methods of Analysis
We use hierarchical linear modeling (HLM), a common method for studying trajectories of change (Liang et al., 2008; Raudenbush & Bryk, 2002), to predict functional change over the entire episode of care for long-stay residents. Individual trajectories are estimated using repeated observations per individual, where:
| (1) |
In Equation 1, YiT is functional status for individual i at time T (T equals the resident’s LOS at that assessment); π0i is the intercept for individual i; π1i is the rate of change (slope) in functional status for individual i over time; and εiT represents random error in functional status for individual i at time T. This study uses a quadratic relationship between time and functional change by adding a second-order term for time to Equation 1 (e.g., π2iT2 for the quadratic time effect). In these analyses, LOS is centered at its mean to minimize possible multicollinearity with time terms (Liang et al., 2008). Discussion, however, focuses on the impact on LOS because that is more meaningful than discussion of standardized effects.
We explored several specifications of the model including using an ordinal logistic model given that AHI has a limited range from 0 to 6. The ordinal logistic predicted similar trends in functional change although it was much more difficult to achieve convergence in parameter estimates and results of the ordinal logistic were more difficult to interpret. Hence, we use the hierarchical linear modeling presented here. Statistical modeling was completed using HLM version 6.05.
Equation 1 assumes that intercept and growth parameters will vary across individuals. These parameters become dependent variables in a Level 2 (or person-level) model, in which individual attributes predict interindividual differences in functional change trajectories. This is represented by the following model for the individual growth parameters:
| (2) |
In Equation (2), rpi is a random parameter for individual i with a mean of 0. The Xqi are the individual’s initial clinical conditions (e.g., baseline status and clinical diagnoses) and other individual characteristics (e.g., sociodemographic and episode variables) for individual i, and βpq represents the effect of Xq on the pth growth parameter for individual i (πpi). Subsequently, in our results, we report three parameter estimates for each covariate that include an effect on the intercept (p = 1), on the first-order change in functional status over time (p = 2), and on the second-order change in functional status over time (p = 3) because we have specified a quadratic relationship between LOS and functional status. Because these three parameters contribute to a nonlinear relationship between contributing factors (such as a medical condition or baseline impairment) and change in functional status, our discussion focuses on constructing the overall relationship (or trajectory) created by the effects of all three parameters and presented in the figures in the results section.
We have adjusted for potential sample selection bias by including the predicted likelihood that a resident would be a short stayer as a predictor of individual differences in Equation 2 (Heckman, 1979). Predicted likelihood of being a short stayer is estimated using data on all residents in the 5% sample and logistic analyses with covariates including age, education, gender, diabetes, hip fracture, stroke, cancer, heart disease, cognitive performance score, and baseline functional status as covariates (the full set of parameter estimates for the logistic model is provided in appendix). In addition, the models include variables indicating whether the resident’s stay ended in death or exit from the facility; these variables are treated as confounding variables, which is similar to the approach used in other health trajectory models (see Liang et al., 2010). These measures are not intended to represent causal factors or to be interpreted as such.
Information on measures is fairly complete; however, a number of respondents are missing data on education (242 missing values) and marital status (586 missing values). To minimize loss of subjects due to missing data, we use multiple imputation. Five complete data sets with imputation of missing values were created using the NORM software (Schafer, 1997); multivariate analyses are run within each data set and reported parameter estimates and standard errors are derived by averaging across imputations and adjusting for their variance.
To assess relative fit of models, we compare the Akaike Information Criterion (AIC), which can be used with any two models using the same data, and the pseudo R2 separately for within person and across person variance components. Singer and Willet (2003) indicate that the AIC statistic can be compared across any models using identical data and that the one with the lower AIC fits better. Pseudo R2 are calculated by taking the difference between residual variances from the unconditional model with residual variances in the model with covariates to determine the proportion of additional variance explained by the model with covariates (Singer & Willett, 2003).
Results
First, descriptive statistics on all nursing home residents in our 5% sample of Michigan nursing home residents are presented in Table 1, including distributional information on the AHI and LOS of residents over time as well as AHI reported at baseline; these data reflect key differences between the short- and long-stayer populations. Following that we discuss results of the multivariate hierarchical models.
Table 1.
Descriptive Data on 5% Sample of MI Nursing Home Residents, 1998–2003
| Long-stay residents (≥ 180 days) | Short-stay residents (< 180 days) | |||||
|---|---|---|---|---|---|---|
| n | M | SD | n | M | SD | |
| Assessment-level data | ||||||
| Length of stay | 34,184 | 14.25 | 12.33 | 14,217 | 0.87 | 1.07 |
| ADL hierarchy | 3.43 | 1.67 | 3.31 | 1.6 | ||
| 25th percentile | 2.0 | 2.0 | ||||
| 50th percentile | 3.0 | 3.0 | ||||
| 75th percentile | 5.0 | 5.0 | ||||
| 99th percentile | 6.0 | 6.0 | ||||
| Resident-level data | ||||||
| Total number of residents | 3,634 | 5,191 | ||||
| Dead dischargeN | 1,281 | 0.35 | 0.48 | 1,051 | 0.20 | 0.40 |
| Live dischargeN | 763 | 0.21 | 0.41 | 3,371 | 0.65 | 0.48 |
| CensoredN | 1,286 | 0.35 | 0.48 | 456 | 0.09 | 0.28 |
| AttrittedN | 304 | 0.08 | 0.28 | 313 | 0.06 | 0.24 |
| Baseline characteristics | ||||||
| MaleN | 1,039 | 0.29 | 0.45 | 1,868 | 0.36 | 0.48 |
| MarriedN | 811 | 0.22 | 0.42 | 1,650 | 0.32 | 0.47 |
| 85 and olderN | 1,622 | 0.45 | 0.50 | 1,868 | 0.36 | 0.48 |
| Education (years 0–17) | 3,634 | 10.23 | 3.78 | 5,191 | 11.05 | 3.44 |
| DiabetesN | 777 | 0.21 | 0.41 | 1,393 | 0.27 | 0.44 |
| Hip fractureN | 223 | 0.06 | 0.24 | 488 | 0.09 | 0.29 |
| StrokeN | 705 | 0.19 | 0.40 | 922 | 0.18 | 0.38 |
| CancerN | 239 | 0.07 | 0.25 | 665 | 0.13 | 0.33 |
| Heart disease | 1,599 | 0.44 | 0.50 | 2,678 | 0.52 | 0.50 |
| Cognitive impairment (scale 0–6) | 3,634 | 2.44 | 1.73 | 5,191 | 1.63 | 1.73 |
| ADL hierarchy (scale 0–6) | 3,634 | 3.33 | 1.62 | 5,191 | 3.40 | 1.56 |
Note: These variables are dummy measures and hence, N indicates the number reporting that characteristic and the M represents the proportion within the population with that characteristic. Nursing home residents experiencing a dead discharge, live discharge, censored visit, or attrited in their nursing home stay sum to the total number of residents displayed in the table.
Out of a random 5% sample of nursing home residents (n = 8,825), 58% (n = 5,191) of them were short stayers and left within 6 months or less, whereas 41% (n = 3,634) were long stayers with stays greater than 6 months. The data include 34,184 assessments on long stayers and 14,217 assessments on short stayers. Among long stayers, the mean LOS across assessments is 14.25 months whereas the maximum LOS observed is 58.7 months (i.e., close to 5 years in length). Table 1 provides distributional information on LOS showing that 95% of residents had stays of 3 years or less.
A larger proportion of long stayers (35%) died during their stay as compared to only 18% of short stayers. However, short stayers are more likely to be discharged (65% were discharged as compared to 21% of long stayers). Short stayers are also younger than long-stayers (36% of short stayers are 85 and older as compared to 45% of long stayers), more likely to be male (36% as compared to 29%), and more likely to be married (32% as compared to 22%).
There are also differences in clinical diagnoses and baseline functional status between the short- and long-stay populations. Within the short- and long-stay populations, close to the same proportion of residents are reported to have diabetes at baseline, whereas the proportion of residents with hip fractures, cancer, and heart disease is slightly higher among short stayers than among long stayers and strokes are slightly less likely among short stayers. Cognitive impairment at baseline is higher among long stayers (a mean of 2.44 as compared to a mean of 1.63 for short stayers). Baseline AHI does not appear to differ across these populations.
We next calculated the unconditional relationship between LOS and functional status, as is shown in Figure 1 and reported in the top part of Table 2. The observed relationship between functional status and LOS is one of increasing impairment that is increasing over time. These results indicate the following change in functional status for person i as a function of LOS in months:
Figure 1.
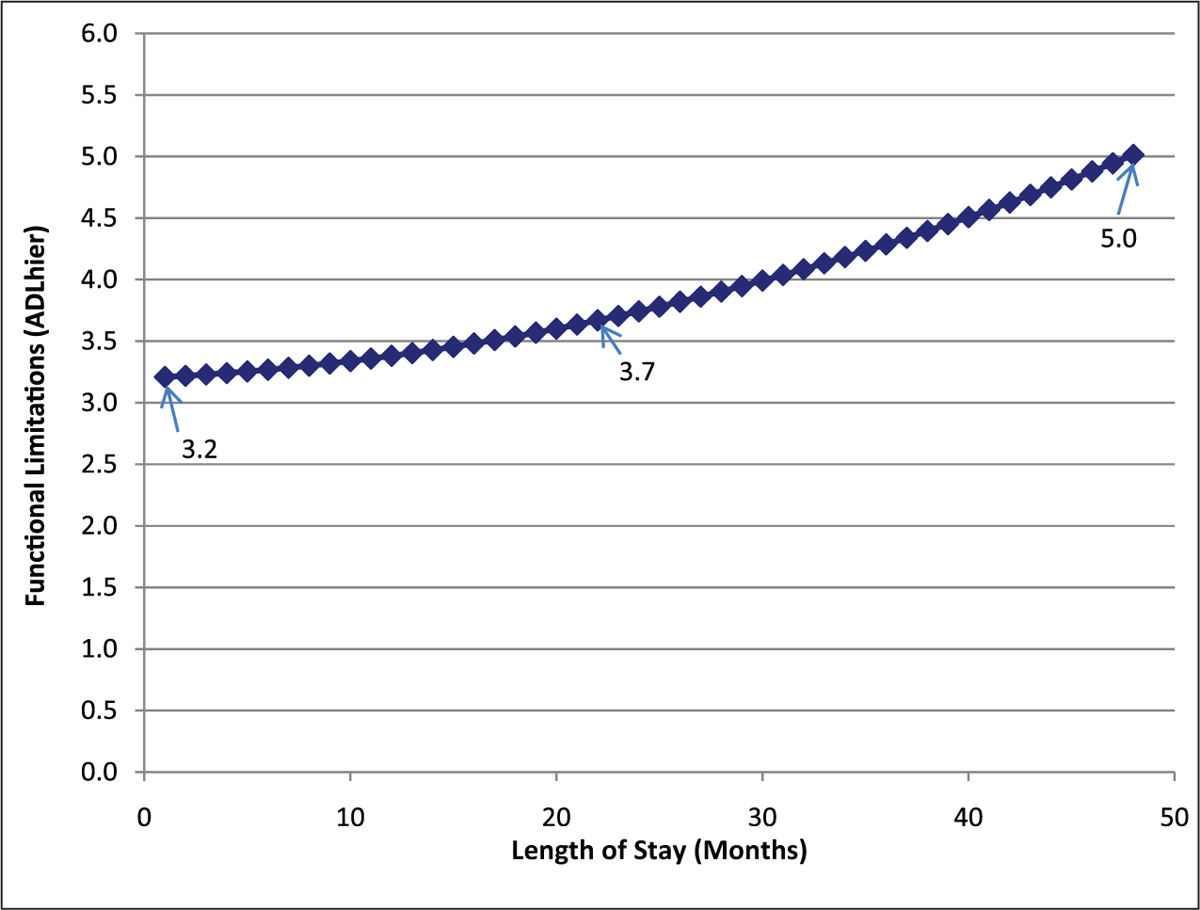
Unconditional model of functional change for long-stay residents
Table 2.
Hierarchical Models of Functional Change for Long-Stay Residents, Unconditional and With Covariates
| Intercept, B0 | Linear slope, B1 | Quadratic slope, B2 | ||||
|---|---|---|---|---|---|---|
| Coefficient | SE | Coefficient SE | Coefficient | SE | ||
| Unconditional model | ||||||
| Fixed effect Intercept | 3.435 | 0.029*** | 0.313 | 0.016*** | 0.096 | 0.013*** |
| Random effect Intercept (Variance) | 2.831*** | 0.588*** | 0.331*** | |||
| Model with covariates | ||||||
| Fixed effect Intercept | 3.442 | 0.025*** | 0.370 | 0.016*** | 0.132 | 0.015*** |
| Death | 0.406 | 0.079*** | 0.386 | 0.054*** | 0.027 | 0.050 |
| Censored | −0.313 | 0.073*** | −0.186 | 0.049*** | 0.049 | 0.044 |
| Ever Attrited | −0.209 | 0.102* | −0.113 | 0.064 | 0.040 | 0.055 |
| Male | −0.120 | 0.102 | −0.081 | 0.061 | −0.001 | 0.056 |
| Married | 0.150 | 0.064 | 0.027 | 0.040 | −0.066 | 0.033* |
| Sample selection probability | 0.371 | 0.952 | 0.457 | 0.545 | 0.229 | 0.514 |
| Age (85 years or older) | 0.110 | 0.056* | 0.099 | 0.033** | −0.013 | 0.030 |
| Education | 0.010 | 0.011 | 0.001 | 0.006 | −0.005 | 0.006 |
| Diabetes | 0.016 | 0.072 | 0.071 | 0.042 | 0.008 | 0.039 |
| Hip fracture | −0.482 | 0.131*** | −0.223 | 0.077** | 0.072 | 0.072 |
| Stroke | −0.072 | 0.067 | −0.012 | 0.038 | 0.033 | 0.036 |
| Cancer | 0.023 | 0.163 | −0.080 | 0.095 | −0.068 | 0.090 |
| Heart condition | −0.148 | 0.072* | −0.102 | 0.042** | 0.005 | 0.039 |
| Cognitive impairment | 0.215 | 0.067** | 0.100 | 0.038** | −0.030 | 0.036 |
| Baseline ADL | 0.456 | 0.040*** | −0.245 | 0.023*** | 0.121 | 0.022*** |
| Random effect Intercept (Variance) | 1.888*** | 0.449*** | 0.358*** | |||
Note: The reliability estimates are based on 3,600 of 3,634 assessments with sufficient data for computation. Fixed effects and variance components are based on all the data. Final estimation of fixed effects is reported with robust standard errors. Model fit statistics: Unconditional Model AIC Fit 93,313.6, Level-1; R is 0.476; Model with Covariates AIC Fit Index 85,889.42; level-1, R is .455.
Level of significance:
p ≤ .05.
p ≤ .01.
p ≤ .001.
Over the average LOS for residents, which is 1.85 years, functional status would increase by 0.5 (see Figure 1) on the scale from 0 to 6. The AIC statistic for the unconditional model predicting change in functional status is 93,313.63; this goodness of fit measure will be compared to fit for the model including covariates.
Table 2 presents the results of both the unconditional model and multivariate hierarchical model including health covariates and sociodemographics (in the lower half of the table). Both models allow within-subject variation across time. For the model with covariates, the AIC is 85,889.42, indicating that it is a better fitting model than the unconditional.
The pseudo R2 statistic offers further evidence of goodness of fit, as evaluated by the reduction in unexplained variance attributable to adding covariates and can be evaluated for both within- and between-person variance components. In our results, the model with covariates explains an additional 34% of the between-person variance and only an additional 4% of the within-person variance. This is as expected, in that the covariates are largely baseline characteristics that identify between-person differences. The pseudo R2 for between-person variance is also substantial at 34%, indicating that the baseline characteristics make a significant contribution to explaining variance in functional impairment between nursing home residents across the length of their stay.
Figures 2 and 3 show predicted trajectories for residents with baseline status one standard deviation above and below the mean for functional (Figure 2) and cognitive impairment (Figure 3). As stated in the Methods section, the figures offer the best opportunity to see the combined effect of parameter estimates on the trajectories of change in functional impairment. In discussion, we highlight the expected level of impairment at several points—the minimum, maximum, and mean LOS (indicated in the figures)—on the predicted trajectory of functional change. As shown in Figure 2, higher physical impairment at baseline is associated with slower increases in functional impairment (counter our expectations), although at an increasing rate (B1 is negative and B2 positive for the effects of baseline functional impairment; these parameters are statistically significant at p < .01). In this figure, functional impairment increases steadily for those at one standard deviation below the mean level of functional impairment; whereas change is less and even includes some improvement during the initial year for those one standard deviation above the mean in functional impairment.
Figure 2.
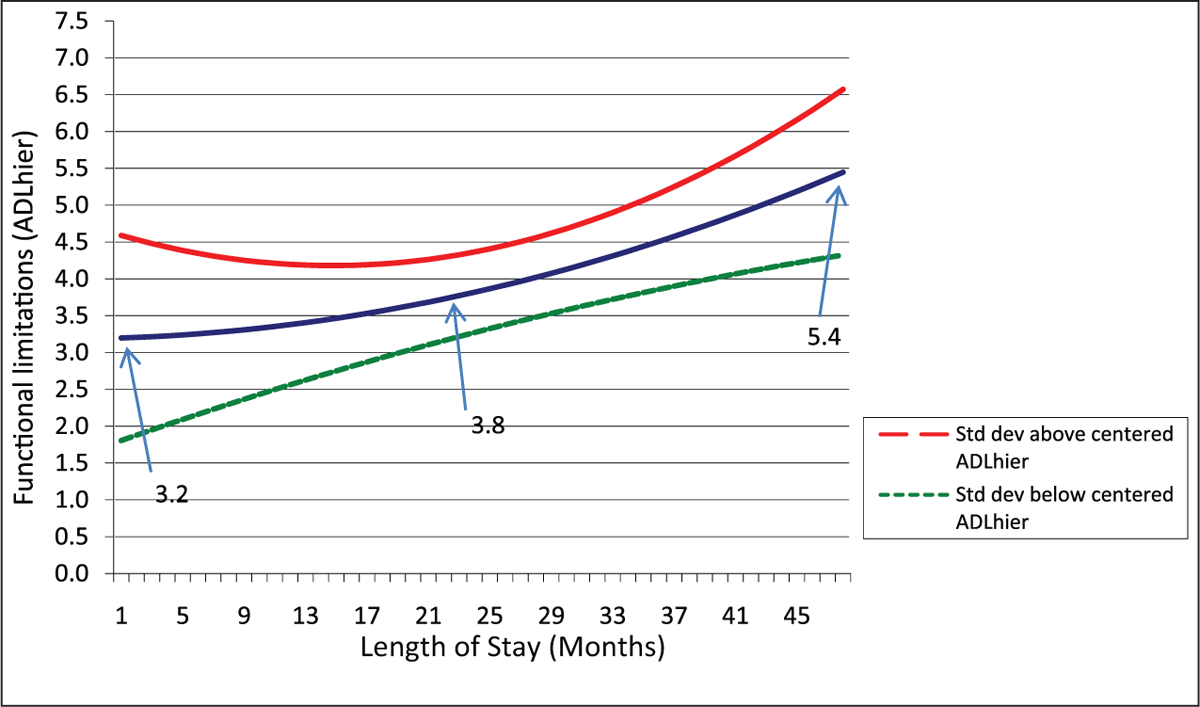
Impact of baseline functional status on functional change
Figure 3.
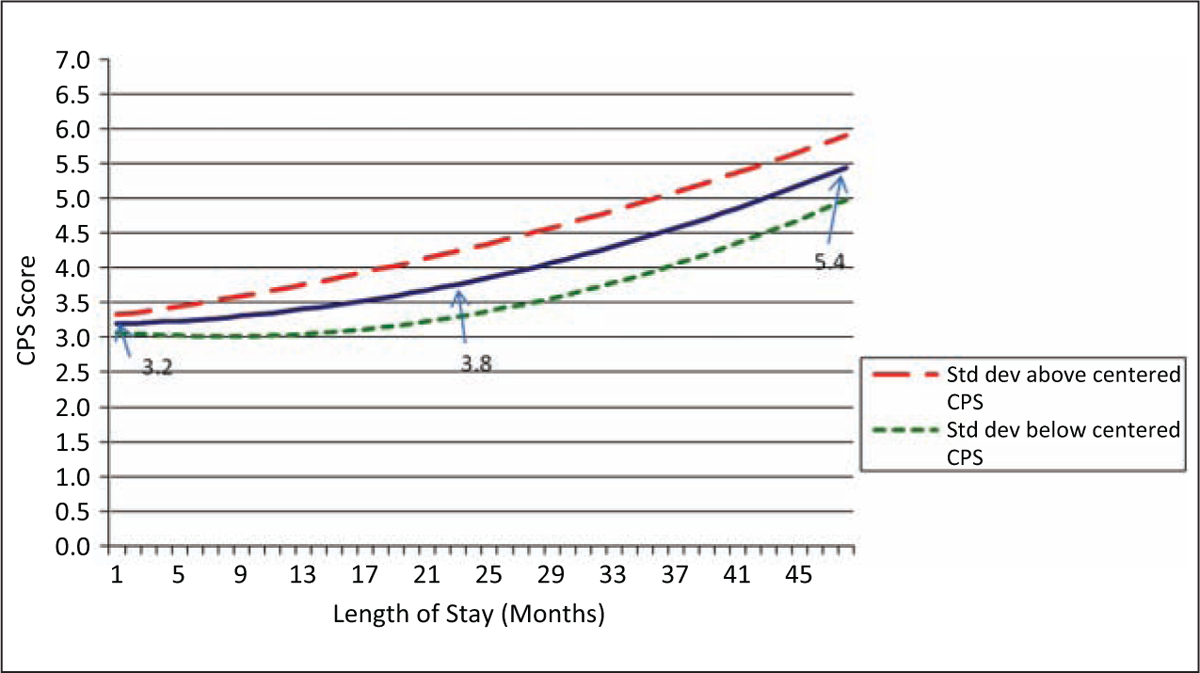
Effect of baseline cognitive status on functional change
These results support the first part of Hypothesis 1, in which we stated that functional impairment will increase over time for this population. However, the second part of Hypothesis 1, which stated that those with higher impairment would decline faster, is not supported, and in fact, we find that within the first 2 years of a nursing home stay, physical functioning declines more rapidly among those starting with lower levels of impairment. This may in part be a ceiling effect in that those with higher impairment at baseline are closer to highest levels of impairment initially and hence, decline more slowly. However, these results differ markedly from effects of baseline cognitive performance for which we would also expect a ceiling effect and for which fairly rapid impairment occurs across the population.
Figure 3 shows changes in functional impairment related to baseline cognitive performance, with again three lines representing change at the mean cognitive performance level and one standard deviation above and below that mean. In this case, higher levels of cognitive impairment at baseline predict greater impairment in physical functioning (the parameter estimates of B0 and B1 are both statistically significant) although the parameter for the effect on the rate of change (B2) is not statistically significant. In this case, baseline cognitive performance leads to the largest declines in functioning in and after the resident’s second year in a facility (and hence, most important for those with the longest stays). At baseline, there is a relatively high level of impairment among all residents (range for one standard deviation is from 3.1 to 3.3). By the end of the second year of a nursing home stay, those who started with highest levels of cognitive impairment (one standard deviation above the mean) declined in physical functioning from 3.3 to 4.2 on the AHI whereas those who started with the lowest levels of cognitive impairment (one standard deviation below the mean) increased only slightly from 3.1 to 3.5 AHI.
Among baseline clinical diagnoses, diabetes, stroke, and cancer do not have statistically significant effects on functional change, whereas hip fracture and heart disease have significant but unexpected effects on impairment. Those with heart disease experience slower impairment (first-order effect) at a slower rate of increase (second-order effect) than among those without heart disease. The presence of a hip fracture likewise leads to slower increases in impairment (first-order effect) and change at a slower rate (second-order effect) than among those without hip fracture. These significant effects run counter to the expectation that baseline clinical conditions would lead to faster and more impairment. At the same time, both heart disease and hip fracture have smaller impacts on functional impairment than baseline functional and cognitive status.
Among demographic factors, being male or married and the extent of one’s education do not affect the rate of functional impairment, whereas those more than the age of 85 experienced more functional impairment and started at higher levels of impairment than younger residents (statistically significant at p < .05 for B0 and p < .01 for B1). In addition, the effect of the sample selection measure, the predicted probability of being a short stayer, was not statistically significant. Within our model, potential confounding factors including whether the resident’s episode of care ended through exit from the nursing home or because of death are highly significant and hence, adjusting for their presence was important.
Discussion
Our results show that overall functional status, often reflective of multiple geriatric conditions, has a significant effect on a resident’s subsequent impairment across their nursing home stay. Baseline cognitive performance and physical functioning have stronger effects than baseline disease diagnoses for predicting long-term changes in functioning. These results suggest that the classic disablement model, in which functional impairment is critical in how clinical conditions lead to disability (Lawrence & Jette, 1996), applies in institutionalized settings.
Functional status may be more important in predicting long-term change than clinical diagnoses because diagnosed problems have their biggest impact within shorter periods of time. The immediate consequence of a clinical diagnosis is treatment, which may lead to resolution with fewer long-term effects or may contribute to increasing functional impairment depending on which comorbidities are present. Observed long-term trajectories, however, reflect cumulative effects of multiple clinical problems over the nursing home stay. Baseline functional impairment may indicate some vulnerability to future health problems that ultimately results in the long-term decline over the nursing home stay.
The impact of some baseline disease conditions was unexpected. Residents with either heart disease or hip fracture experienced smaller declines in physical functioning during their LOS than residents without these diagnoses. These findings may be explained by a selection process in which individuals without these conditions had other conditions that both led to admission and predict increasing impairment over the nursing home stay. Alternatively, residents with heart disease and hip fracture may do better after admission either because the facility takes over disease management when residents previously failed at self-management or because these individuals are survivors whereas those with more serious levels of these diseases do not even enter the nursing home. Further analyses of these clinical conditions, both at baseline and as they are allowed to vary during the nursing home stay, are needed to clarify what is happening among these residents.
It is a limitation of this study that it examines the importance of factors defined at or close to the point of admission to the nursing home when changing health conditions may also be predictors of long-term functional status in a facility. Although we recognize the limited scope of our study, we did find that health conditions on entry into the nursing home explained a significant amount of the variance in long-term functional status of nursing home residents. Indeed, baseline functional status may be critical to refining the development of clinical pathways. Further identification of the nursing home admits who experience common trajectories based on both their starting health conditions and changes across LOS could be used to target services even more effectively (Kinosian, Stallard, & Wieland, 2007). Such analyses can be done using latent class analyses of individual resident health trajectories.
Although case mix systems, such as the RUGS reimbursement process, target financial resources within the facility to residents depending on their current health needs, further research exploring trajectories of change in impairment can be used to more effectively plan for service provision for residents as their impairments increase across the nursing home stay. Such planning may be especially important for facilities with large long-stay populations and in which some residents have particularly long stays. For example, our results indicate that even slight increases in the cognitive impairment of residents at admission will lead to increasing physical functional decline across the nursing home stay. Consequently, additional interventions targeted to retaining physical functioning may be a useful change at admission for the cognitively impaired. Further research should also further explore whether combined physical and cognitive impairment attenuates rates of decline further.
This study applies techniques for studying health trajectories commonly used in community studies (Miller & Wolinsky, 2007). Health trajectories have been a class of longitudinal outcome measures that were not easily studied before modern hierarchical modeling techniques and current data from MDS assessments became available. Our results describe the changing burden associated with increased functional impairment during nursing home stays. Further research may also consider a more holistic description and analysis of functional patterns of change that span both institutional and community settings.
Funding
The authors disclosed receipt of the following financial support for the research, authorship, and/or publication of this article:
This study was supported by the Blue Cross Blue Shield of Michigan Foundation (Grant #973).
Appendix
Logistic Model Predicting Probability of Having a Short-Stay (LOS < 180 Days)
| B | SE | p value | |
|---|---|---|---|
| Age | −0.007 | 0.002 | .001 |
| Education | 0.108 | 0.015 | .001 |
| Male | 0.356 | 0.050 | .001 |
| Diabetes | 0.103 | 0.055 | .061 |
| Hip fracture | 0.391 | 0.088 | .001 |
| Stroke | −0.094 | 0.059 | .114 |
| Cancer | 0.602 | 0.082 | .001 |
| Heart disease | 0.232 | 0.047 | .001 |
| Cognitive impairment | −0.289 | 0.014 | .001 |
| ADL hierarchy | 0.158 | 0.016 | .001 |
| Constant | 0.263 | 0.190 | .165 |
| Predicted probability, M (SD) | 0.589 (0.147) |
Footnotes
Declaration of Conflicting Interests
The authors declared no potential conflicts of interest with respect to the research, authorship, and/or publication of this article.
References
- Banaszak-Holl J, Fendrick AM, Foster NL, Herzog AR, Kabeto MU, Kent DM, … Langa KM (2004). Predicting nursing home admission: Estimates from a 7-year follow-up of a nationally representative sample of older Americans. Alzheimer Disease and Associated Disorders, 18, 83–89. [DOI] [PubMed] [Google Scholar]
- Boaz RF & Muller CF (1994). Predicting the risk of “permanent” nursing home residence: The role of community help as indicated by family helpers and prior living arrangements. Health Services Research, 29, 391–474. [PMC free article] [PubMed] [Google Scholar]
- Buttar A, Blaum C, Fries BE (2001). Clinical characteristics and 6-month outcomes of nursing home residents with low activities of daily living (ADL) dependency. Journals of Gerontology A: Medical Sciences, 56A, M292–M297. [DOI] [PubMed] [Google Scholar]
- Campion EW (1994). The oldest old. The New England Journal of Medicine, 330, 1819–1820. [DOI] [PubMed] [Google Scholar]
- Decker FH (2005). 1977–99: What has changed, what has not? Hyattsville, MD: National Center for Health Statistics. [Google Scholar]
- Frederiksen K, Tariot P, De Jonghe E (1996). Minimum Data Set Plus (MDS+) scores compared with scores from five rating scales. Journal of the American Geriatrics Society, 44, 305–309. [DOI] [PubMed] [Google Scholar]
- Freedman VA (1996). Family structure and the risk of nursing home admission. Journals of Gerontology B: Social Sciences, 51, S61–S69. [DOI] [PubMed] [Google Scholar]
- Fried LP, Tangen CM, Walston J, Newman AB, Hrsch C, Gottdiener J, … McBurnie MA (2001). Frailty in older adults: Evidence for a phenotype. Journals of Gerontology A: Medical Sciences, 56, M146–M156. [DOI] [PubMed] [Google Scholar]
- Fries BE, Morris JN, Skarupski KA, Blaum CS, Galecki A, Bookstein F, & Ribbe M (2000). Accelerated dysfunction among the very oldest-old in nursing homes. Journals of Gerontology A: Medical Sciences, 55, M336–M341. [DOI] [PubMed] [Google Scholar]
- Gill TM, Gahbauer EA, Han L, & Allore H (2009). Functional trajectories in older persons admitted to a nursing home after an acute hospitalization. Journal of the American Geriatrics Society, 57, 195–201. [DOI] [PMC free article] [PubMed] [Google Scholar]
- Gill TM, Guo Z, & Allore HG (2008). Subtypes of disability in older persons over the course of nearly 8 years. Journal of the American Geriatrics Society, 56, 436–443. [DOI] [PMC free article] [PubMed] [Google Scholar]
- Gillen P, Spore D, Mor V, & Freiberger W (1996). Functional and residential status transitions among nursing home residents. Journals of Gerontology A: Medical Sciences, 51(1), M29–M36. [DOI] [PubMed] [Google Scholar]
- Grabowski DC (2007). Medicare and Medicaid: Conflicting incentives for long-term care. Milbank Quarterly, 85, 579–610. [DOI] [PMC free article] [PubMed] [Google Scholar]
- Hartmaier SL, Sloane PD, Guess HA, Koch GG, Mitchell CM, & Phillips CD (1995). Validation of the Minimum Data Set Cognitive Performance Scale: Agreement with the Mini-Mental State Examination. Journals of Gerontology A: Medical Sciences, 50A, M128–M133. [DOI] [PubMed] [Google Scholar]
- Hawes C, Morris JN, Phillips CD, Mor V, Fries BE, & Nonemaker S (1995). Reliability estimates for the Minimum Data Set for nursing home resident assessment and care screening (MDS). The Gerontologist, 35, 172–178. [DOI] [PubMed] [Google Scholar]
- Heckman J (1979). Sample selection bias as a specification error. Econometrica, 47, 153–161. [Google Scholar]
- Hirdes JP, Smith TF, Rabinowitz T, Yamauchi K, Perez E, Telegdi NC, … Fries BE (2002). The Resident Assessment Instrument-Mental Health (RAI-MH): Inter-rater reliability and convergent validity. Journal of Behavioral Health Services Research, 29, 419–432. [DOI] [PubMed] [Google Scholar]
- Intrator O, Mor V, Unruh M, Nathilvar V, & Feng Z (2009, November). Data sources and data quality Presentation at the Annual Gerontological Society of America meeting, Atlanta, GA: Retrieved from www.LTCfocUS.org [Google Scholar]
- Katz S (1983). Assessing self maintenance: Activities of daily living, mobility and instrumental activities of daily living. Journal of the American Geriatrics Society, 31, 721–726. [DOI] [PubMed] [Google Scholar]
- Kinosian B, Stallard E, & Wieland D (2007). Projected use of long-term-care services by enrolled veterans. The Gerontologist, 47, 356–364. [DOI] [PubMed] [Google Scholar]
- Lawrence RH & Jette AM (1996). Disentangling the disablement process. Journals of Gerontology B: Social Sciences, 51B, S173–S182. [DOI] [PubMed] [Google Scholar]
- Lee PG, Cigolle C, & Blaum C (2009). The co-occurrence of chronic diseases and geriatric syndromes: The Health and Retirement Study. Journal of the American Geriatrics Society, 57, 511–516. [DOI] [PubMed] [Google Scholar]
- Liang J, Quinones AR, Bennett JM, Ye W, Xu X, Shaw BA, & Ofstedal MB (2010). Evolving self-rated health in middle and old age: How does it differ across Black, Hispanic and White Americans. Journal of Aging and Health, 22(1), 3–26. [DOI] [PMC free article] [PubMed] [Google Scholar]
- Liang J, Bennett JM, Shaw BA, Quiñones AR, Ye W, Xu X, & Ofstedal MB (2008). Changes in functional status in middle and older age: Are there any age variations? Journals of Gerontology B: Social Sciences, 63, S282–S292. [DOI] [PMC free article] [PubMed] [Google Scholar]
- Liebson CL, Toteson ANA, Gabriel SE, Ransom JE, & Melton JL III. (2002). Mortality, disability, and nursing home use for persons with and without hip fracture: A population-based study. Journal of the American Geriatrics Society, 50, 1644–1650. [DOI] [PubMed] [Google Scholar]
- Liu K, & Manton KG (1983). Length of stay patterns and nursing home admissions. Medical Care, 21, 1211–1222. [DOI] [PubMed] [Google Scholar]
- Luppa M, Luck T, Weyerer S, Konig HH, Brahler E, & Riedel-Heller SG (2009). Prediction of institutionalization in the elderly. A systematic review. Age and Ageing, 39, 31–38. [DOI] [PubMed] [Google Scholar]
- Martin LG, Shoeni RF, Freedman VA, & Andreski P (2007). Feeling better? Trends in general health status. Journals of Gerontology B: Social Sciences, 62B(1), S11–S21. [DOI] [PubMed] [Google Scholar]
- McConnell ES, Branch LG, Sloane RJ, & Pieper CF (2003). Natural history of change in physical function among long-stay nursing home residents. Nursing Research, 52, 119–126. [DOI] [PubMed] [Google Scholar]
- Miller TR, & Wolinsky FD (2007). Self-rated health trajectories and mortality among older adults. Journals of Gerontology B: Social Sciences, 62B, S22–S27. [DOI] [PMC free article] [PubMed] [Google Scholar]
- Morris JN, Fries BE, Mehr DR, Hawes C, Phillips C, Mor V, & Lipsitz LA (1994). MDS Cognitive Performance Scale. Journals of Gerontology A: Medical Sciences, 49, M174–M182. [DOI] [PubMed] [Google Scholar]
- Morris JN, Fries BE, & Morris SA (1999). Scaling ADLs within the MDS. Journals of Gerontology A: Medical Sciences, 54, M546–M553. [DOI] [PubMed] [Google Scholar]
- Raudenbush SW, & Bryk AS (2002). Hierarchical linear models: Applications and data analysis methods (2nd ed.). Thousand Oaks, CA: SAGE. [Google Scholar]
- Richardson J, Bedard M, & Weaver B (2001). Changes in physical functioning in institutionalized older adults. Disability and Rehabilitation, 23, 683–689. [DOI] [PubMed] [Google Scholar]
- Rockwood K, Abeysundera MJ, & Mitnitski A (2007). How should we grade frailty in nursing home patients? Journal of the American Medical Directors Association, 8, 595–603. [DOI] [PubMed] [Google Scholar]
- Schafer JL (1997). Analysis of incomplete multivariate data. London, UK: Chapman and Hall. [Google Scholar]
- Sgadari A, Morris JN, Fries BE, Ljunggren G, Jonsson PV, DuPaquier JN, & Schroll M (1997). Efforts to establish the reliability of the Resident Assessment Instrument. Age Ageing, 26(Suppl 2), 27–30. [DOI] [PubMed] [Google Scholar]
- Singer JD, & Willett JB (2003). Applied longitudinal data analysis: Modeling change and event occurrence. New York, NY: Oxford University Press. [Google Scholar]
- Verbrugge LM, & Jette AM (1994). The disablement process. Social Science and Medicine, 38, 1–14. [DOI] [PubMed] [Google Scholar]
- Wang J, Kane RL, Eberly LE, Virnig BA, & Chang LH (2009). The effects of resident and nursing home characteristics on activities of daily living. Journals of Gerontology A: Medical Sciences, 64, 473–480. [DOI] [PMC free article] [PubMed] [Google Scholar]
- Yang Y, & Lee LC (2010). Dynamics and heterogeneity in the process of human frailty and aging: Evidence from the U.S. older population. Journal of Gerontology: Social Sciences, 65B, 246–255. [DOI] [PMC free article] [PubMed] [Google Scholar]
- Zhang NJ, Paek SC, & Wan TH (2009). Reliability estimates of clinical measures between Minimum Data Set and Online Survey Certification and Reporting Data of U.S. nursing homes. Medical Care, 47, 492–495. [DOI] [PubMed] [Google Scholar]