Abstract
Three-dimensional (3D) chromatin architectural differences can influence the integrity of topologically associating domains (TADs) and rewire specific enhancer-promoter interactions, impacting gene expression and leading to human disease. Here, we investigate the 3D chromatin architecture in T cell acute lymphoblastic leukemia (T-ALL) using primary human leukemia specimens and its dynamic responses to pharmacological agents. Systematic integration of matched in situ Hi-C, RNA-seq and CTCF ChIP-seq datasets revealed widespread differences in intra-TAD chromatin interactions and TAD boundary insulation in T-ALL. Our studies identify and focus on a TAD “fusion” event associated with absence of CTCF-mediated insulation, enabling direct interactions between the MYC promoter and a distal super-enhancer. Moreover, our data also demonstrate that small molecule inhibitors targeting either oncogenic signal transduction or epigenetic regulation can alter specific 3D interactions found in leukemia. Overall, our study highlights the impact, complexity and dynamic nature of 3D chromatin architecture in human acute leukemia.
Introduction
The human genome is replete with regulatory elements such as promoters, enhancers and insulators. Recent findings have highlighted the impact of spatial genome organization in governing the physical proximity of these elements for the precise control of gene expression 1–3. Genome organization is a multistep process that involves compacting chromatin into nucleosomes, chromatin fibers, compartments and into chromosome territories 3,4. Multiple lines of evidence suggest that at the sub-megabase level, the genome is organized in distinct regions of highly self-interacting chromatin called TADs 5–7. An important function of TADs is to restrict the interactions of regulatory elements to genes within the TADs, while insulating interactions from neighboring domains 3,4. Further evidence from our laboratory suggests that super-enhancers, which often regulate key genes determining cellular identity or driving tumorigenesis 8,9, are frequently insulated by and co-duplicated with strong TAD boundaries in cancer 10. TAD boundaries are enriched in binding of structural proteins (CTCF, cohesin) 11. Cohesin-mediated, convergently oriented CTCF-CTCF structural loops are essential for the organization of the genome into TADs 12–14. Abrogation of CTCF binding or inversion of its orientation in boundary regions can change TAD structure, reconfigure enhancer-promoter interactions 15 leading to aberrant gene activation and developmental defects 1,16.
In light of these reports, understanding how chromatin organization contributes to cancer pathogenesis remains largely unexplored barring a few examples 2,17,18. Here, using T-ALL as a model 19,20, we investigated potential reorganization of global chromatin architecture in primary T-ALL samples, T-ALL cell lines and healthy peripheral T cells. Our analysis identified recurrent structural differences at TAD boundaries and significant alterations in intra-TAD chromatin interactions that mirrored differences in gene expression. Both types of alterations affected effectors of oncogenic NOTCH1 signaling. Furthermore, as a principal example, we identified a recurrent TAD boundary change in T-ALL within the locus of a key driver of T cell leukemogenesis, MYC, which facilitates long-range interactions of the MYC promoter with a previously characterized NOTCH-bound super-enhancer. Furthermore, in highlighting a direct role for NOTCH1 in organizing chromatin architecture, inhibition of NOTCH1 signaling using gamma secretase inhibitors (γSI) reduced chromatin looping in a number of enhancer-promoter pairs that are sensitive to γSI treatment (called “dynamic NOTCH1” sites 21). Loss of chromatin interactions between enhancer-promoter loops was associated with a reduction of H3K27ac marks at the respective enhancer. However, a subset of enhancer-promoter loops including the MYC super-enhancer loop retained their interactions with target promoters following γSI treatment, despite being bound by NOTCH1. In exploring putative co-factors maintaining long-range interactions, we identified CDK7 binding to be enriched in γSI-insensitive chromatin contacts. Pharmacological inhibition of CDK7 using the covalent inhibitor THZ1 significantly reduced MYC super-enhancer promoter contacts, underlining the complexity of factors regulating 3D architecture. Taken together, our findings provide a deeper insight into how the 3D chromatin architecture can affect the regulatory landscape of oncogenes in human leukemia and suggest that some of those changes can be inhibited by targeted drug treatments.
Results
Widespread changes in 3D chromatin landscape in human T-ALL
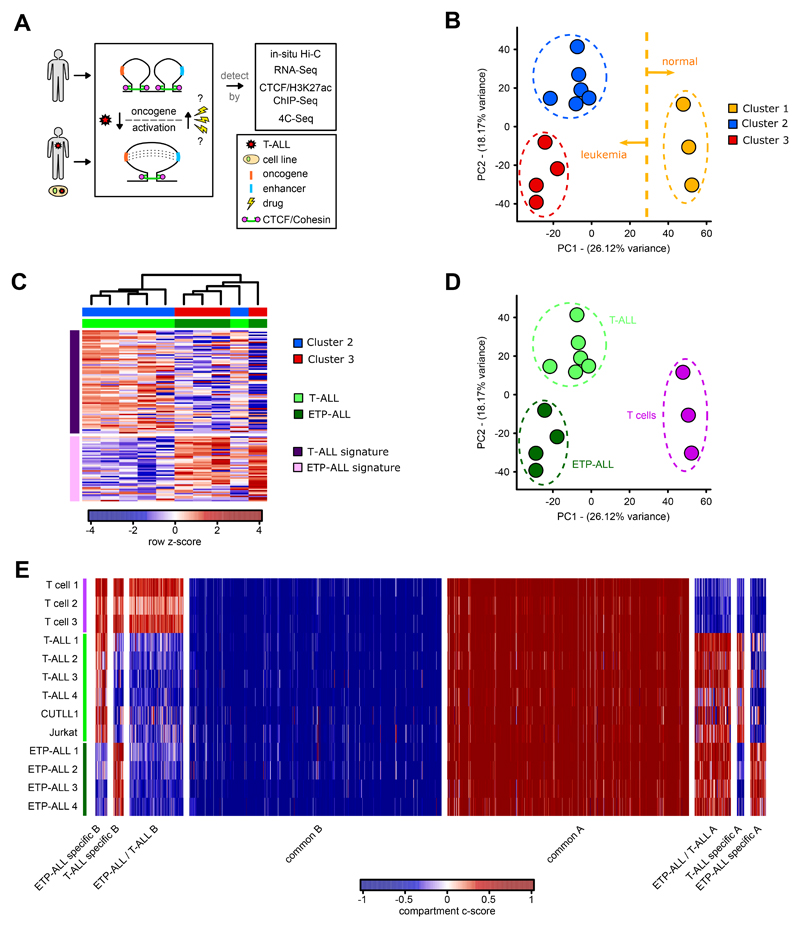
T-ALL accounts for approximately 25% of ALL cases 22 and is characterized by activating mutations in NOTCH1 in approximately 50% of patients 23,24. Based on gene expression signatures and immunophenotyping, T-ALL is classified into two subtypes including the “canonical” T-ALL characterized by frequent NOTCH1 mutations with an immature T cell phenotype and the early T-lineage progenitor (ETP) leukemia subtype, frequently expressing stem cell and myeloid surface markers 25,26. Though the genetic drivers of T-ALL are well-characterized, it has not been investigated whether malignant transformation of immature T cells is associated with widespread changes in chromatin architecture. Herein, to broadly assess the global chromatin architecture in T-ALL, we performed in situ Hi-C in eight primary peripheral blood T-ALL samples, T-ALL cell lines (CUTLL1 27 and Jurkat 28) and peripheral blood mature T cells from three healthy donors. We integrated these datasets with CTCF binding, RNA expression and enhancer activity (Fig. 1A). The Hi-C data, processed by our HiC-bench platform 29, showed alignment rates with a high percentage of usable long-range read pairs (Extended Data Fig. 1A, Supplementary Table 1). Principal Component Analysis (PCA) of genome-wide “hic-ratio” insulation scores (from HiC-bench platform), representing the insulation capacity of every genome-wide bin, indicated three distinct clusters of samples clearly separated by the first two components (Fig. 1B). Cluster 1 samples were identified as mature peripheral T cells and separated from T-ALL samples (cluster 2 and 3) by the first principal component. To discern the identity of clusters 2 and 3, we interrogated expression patterns of these samples using gene signatures for canonical T-ALL and ETP-ALL 24,26,30. Amongst the T-ALL samples, four T-ALL samples that grouped in cluster 3 were identified to share a characteristic gene signature of the ETP-ALL subtype (Fig. 1C). The expression of cluster 2 samples overlapped with that of canonical T-ALL, with a single exception (Supplementary Note). Thus, the assignment of canonical T-ALL and ETP-ALL using gene expression information explains the variation in Hi-C insulation scores between clusters 2 and 3 (Fig. 1D). Additionally, we calculated matrix-wide stratum-adjusted correlation coefficients using HiCRep 31 between the Hi-C contact matrices for all pairwise comparisons. We observed higher correlation amongst the T cells and amongst the two T-ALL subtypes (Extended Data Fig. 1B), further supporting genome-wide variations in 3D architecture between the T cells and T-ALL samples but also between the two distinct T-ALL subtypes. To better characterize differences in 3D architecture that underlie this separation, we first examined compartmentalization of the genome between the three clusters of Hi-C samples (Supplementary Note). Compartment shifts both common and unique to each T-ALL subtype were identified relative to T cells (Extended Data Fig. 1C). We also identified strong correlations of compartment shifts with expression changes (Fig. 1E, Extended Data Fig. 1D, 1E; Supplementary Table 3). Collectively, these data show that differences in 3D architecture occur between T cells and T-ALL and also between subtypes of human T-ALL.
Fig. 1. In Situ Hi-C analysis identifies genome-wide 3D chromatin differences between normal T cells and T-ALL subtypes.
A) Schematic showing the overall study design.
B) Principal Component Analysis (PCA) of “hic-ratio” insulation scores for each Hi-C dataset (n = 13) identified three distinct clusters. Clustering was performed using R package Mclust, with EII and VII models showing an optimal separation using three clusters.
C) Heatmap representation of RNA-seq results for clusters 2 and 3 separated by T-ALL and ETP-ALL gene signature (rows). Gene signature was derived from RNA-seq results from 24,26,30. Heatmap shows row z-score of FPKM normalized read-counts using edgeR function rpkm.
D) Principal Component Analysis (PCA) of the “hic-ratio” insulation scores as in B) (n = 13), colored by cell type assignment with the help of RNA-seq.
E) Compartment analysis using the c-score tool on all Hi-C datasets (n = 13). Different categories of disease-specific / common compartment switches were identified using unpaired two-sided t test on c-scores between T-ALL, ETP-ALL and T cells (P value < 0.1).
Intra-TAD activity differences affect downstream effectors of T-ALL pathogenesis
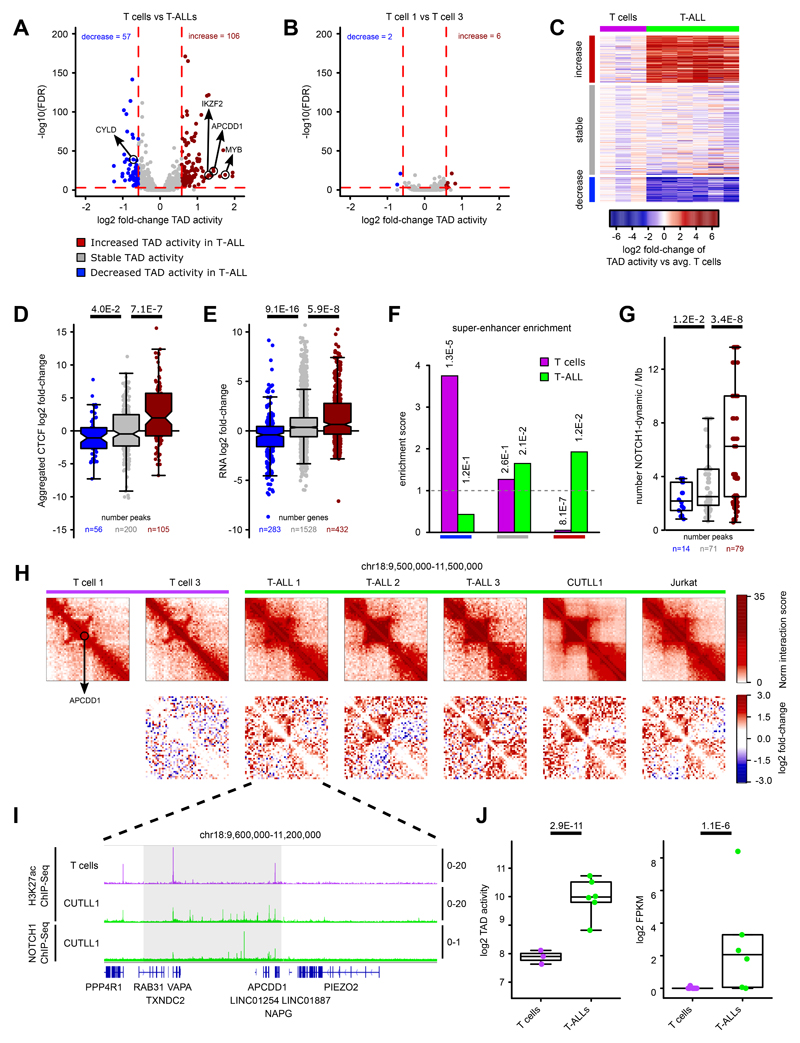
We then focused on all common TADs between T cells and T-ALL found within the transcriptionally active A compartment in either T cells or T-ALL. We defined “intra-TAD activity” as the average of normalized interaction scores of all interactions within the particular TAD. Differences in the intra-TAD activity were determined by comparing the fold-change of average intra-TAD activity between all T cell samples and the four primary canonical T-ALL samples (Supplementary Methods). Comparison of intra-TAD activity between canonical T-ALL samples and controls identified several statistically significant increases and decreases (Fig. 2A; Supplementary Table 4; FDR < 0.1, log2 fold-change > 0.58 or < -0.58) whereas, comparison between two independent T cell samples revealed only few changes by applying the same thresholds (Fig. 2B). Furthermore, the TAD activity changes were highly similar across primary canonical T-ALL samples and T-ALL cell lines (Fig. 2C), with some expected heterogeneity. Only ~16-18% of the identified intra-TAD activity changes had concomitant compartment shifts, with the majority falling in the A compartment in both T cells and T-ALL samples (Supplementary Fig. 1A). Additionally, TAD activity changes were minimally impacted by genomic alterations such as translocations and copy number variants (Supplementary Note).
Fig. 2. Intra-TAD activity changes affect downstream effectors of T-ALL pathogenesis.
A) Volcano plot showing differential intra-TAD activity for comparisons of T cells versus canonical T-ALL (all TADs n = 1027). Statistical evaluation was performed using paired two-sided t test pairing each interaction-bin per TAD between averages of T cells and canonical T-ALL, followed by multiple testing correction.
B) Volcano plot of the same analysis as in A) between two independent T cell Hi-C samples (all TADs n = 1,027).
C) Heatmap showing average per-sample intra-TAD activity in T-ALL samples and T cells normalized by the average intra-TAD activity across all three T cell samples. Rows are showing differentially active / stable TADs as highlighted in A).
D) Integration of CTCF binding with TAD boundary categories from A). All CTCF bindings from surrounding TAD boundaries are aggregated, and log2 fold-change of CTCF signals between T-ALL and T cell is shown. Significant differences are calculated using an unpaired one-sided t test comparing decreased / increased intra-TAD activity with stable TADs
E) Integration of RNA-seq (FPKM > 1) within TADs with decreased / increased intra-TAD activity. For each gene, log2 fold-change between T cells and T-ALL from RNA-seq is shown. Significant differences are calculated using an unpaired one-sided t test comparing genes from TADs with decreased / increased intra-TAD activity with genes from stable TADs.
F) Super-enhancer integration with differentially active TADs. Enrichment score was calculated as observed overlap between super-enhancers and differentially active / stable TADs over expected background. Statistical enrichment was calculated using two-sided Fisher’s exact test.
G) Number of dynamic NOTCH1-binding sites per 1 Mb within TADs of decreased, stable or increased TAD activity as defined in A). Significant differences of increased/decreased categories versus stable TADs was performed using an unpaired two-sided t test.
H) Hi-C interaction heatmaps (first row) showing the APCDD1 containing TAD. Second row shows heatmaps of per-bin log2 fold-change interactions when compared to T cell 1.
I) H3K27ac and NOTCH1 ChIP-seq tracks for the APCDD1 locus, shown as fold-enrichment over input. Number replicates: T cells H3K27ac n = 2; CUTLL1 H3K27ac n = 2; CUTLL1 NOTCH1 n = 1.
J) Quantifications for intra-TAD activity (left; as highlighted in G)) and expression of APCDD1 (right). Statistical evaluation for intra-TAD activity was performed using paired two-sided t test of average per interaction-bin for APCDD1 TAD between averages of T cells (n = 3) and T-ALL (n = 6), followed by multiple testing correction. APCDD1 expression was determined by RNA-seq and shown as log2 FPKM for T cells (n = 13) and T-ALL (n = 6) samples; normalization and statistical evaluation was performed using edgeR followed by multiple testing correction.
To further characterize differential intra-TAD activity between T-ALL and T cells, we integrated CTCF binding (ChIP-seq) with our Hi-C datasets. Interestingly, changes in intra-TAD activity strongly correlated with CTCF binding changes at the boundaries of differentially active TADs. A stronger insulation by CTCF was associated with stronger intra-TAD activity (Fig. 2D). Next, to investigate whether CTCF binding-associated differences in intra-TAD interactions are also associated with changes in gene expression, we performed differential expression analysis of all expressed genes (FPKM >1; canonical T-ALL vs T cells) within differentially active TADs. Increased chromatin interactions in T-ALL significantly associated with positive fold-changes in gene expression, whereas decreased intra-TAD activity in T-ALL associated with negative fold-changes in gene expression relative to expression changes within stable TADs (Fig. 2E). We then overlapped intra-TAD activity results with cell-type-specific super-enhancer occurrence in T-ALL and T cells (Supplementary Note). We found significant enrichment of T-ALL specific super-enhancers within TADs of increased activity in T-ALL and vice versa (Fig. 2F). Additionally, TADs with higher activity in T-ALL were significantly enriched in dynamic NOTCH1 binding sites 21 whereas TADs with lower activity in T-ALL were significantly depleted of dynamic NOTCH1-binding sites compared to stably active TADs (Fig. 2G). Taken together, these results demonstrate widespread changes in intra-TAD activity in T-ALL when compared to peripheral T cells that are associated with CTCF binding, mRNA expression and super-enhancer activity. Furthermore, we identified SNVs to have minimal impact on the observed differential CTCF binding (Supplementary Fig. 1F).
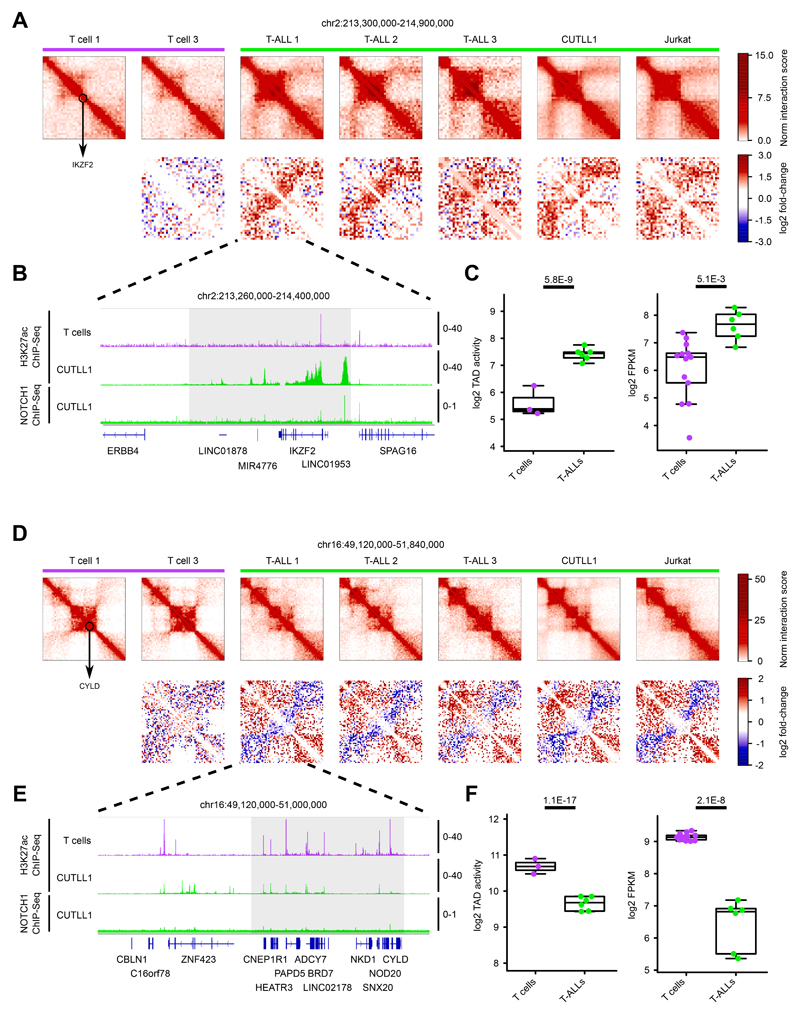
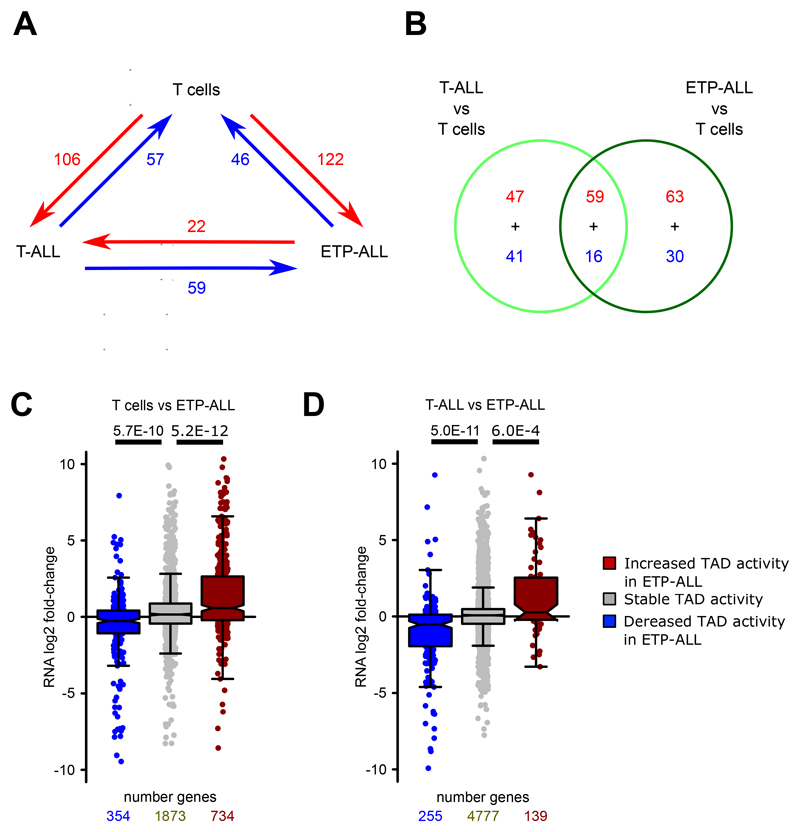
Our comparison of changes in TAD activity and super-enhancer firing suggests that 3D chromosomal changes potentially occur in loci important for T-ALL pathogenesis, including NOTCH1 target genes highly expressed in T-ALL patient samples. One such gene is adenomatous polyposis coli downregulated 1 (APCDD1), encoding a membrane-bound glycoprotein overexpressed in T-ALL patient samples. APCDD1 is a NOTCH1 target gene significantly downregulated following inhibition of NOTCH1 signaling by γSI (dynamic NOTCH1 target) 21. Our Hi-C data showed APCDD1 to be present in a highly active TAD in T-ALL (Fig. 2H, J) which was common among all the T-ALL samples and displayed concomitant enhancer elements in T-ALL (Fig. 2I). The gain of TAD activity also correlated with increased expression of APCDD1 in T-ALL samples relative to T cells (Fig. 2J). Another example of a T-ALL-specific increase in intra-TAD activity, enhancer activity and gene expression is the Ikaros family gene IKZF2 (Helios), previously found to be involved in the regulation of T cell differentiation 32. We identified a T-ALL specific super-enhancer within the same TAD, as well as significantly increased gene expression in T-ALL compared to T cells (Extended Data Fig. 2A, B, C). In contrast, among the TADs that lost activity in T-ALL, we identified CYLD, encoding a deubiquitinating enzyme that represses NF-kB signaling and known as a T-ALL tumor suppressor 33,34. We found significant reduction of interactions in the TAD that harbors CYLD in all profiled T-ALL samples (Extended Data Fig. 2D, E). The reduced TAD activity also correlated with reduced expression in T-ALL samples (Extended Data Fig. 2F). Extending our analysis, we also identified subtype-specific differences in intra-TAD activity between the canonical T-ALL and ETP-ALL samples (Supplementary Note).
Identification of recurrent TAD insulation changes in T-ALL
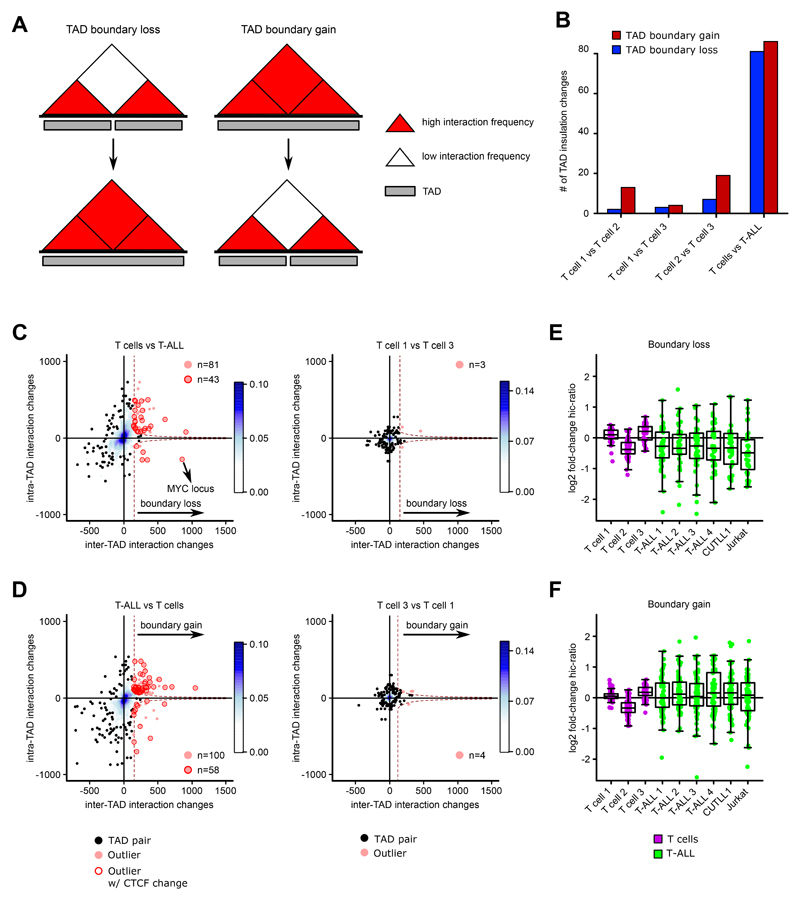
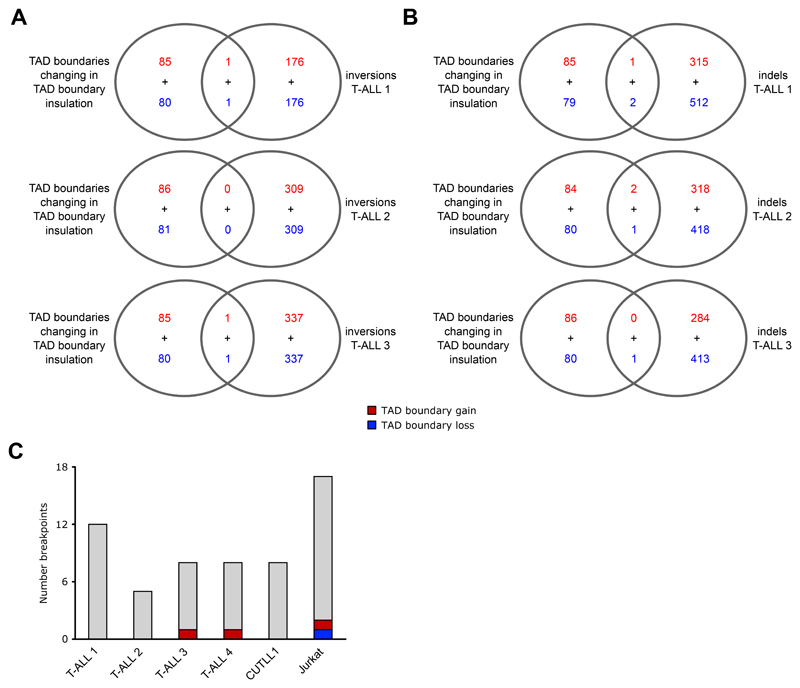
Following our intra-TAD activity analysis, we investigated TAD boundary changes between normal T cells and T-ALL samples. A TAD boundary “loss” was defined as an increase in inter-TAD interactions between two adjacent TADs leading to a TAD “fusion”. Conversely, a TAD boundary “gain” was defined as decrease in inter-TAD interactions between two adjacent TADs leading to a TAD “separation” (Fig. 3A; Supplementary Methods). Global TAD insulation alteration analysis revealed TAD boundary changes in both directions (Fig. 3A), whereas pairwise comparison of T cells from independent donors identified only few TAD boundary alterations. However, considering all such insulation changes between the T cell samples as false-positives, we estimated an approximate false discovery rate (FDR) of 9.58% for TAD boundary changes in T-ALL compared to T cells (Fig. 3B). Furthermore, about 53-58% of TAD boundary differences were accompanied by simultaneous changes in CTCF binding within the respective boundaries (Fig. 3C, D). As an independent validation of these findings, we calculated the hic-ratio insulation score for all TAD boundary alterations found between T-ALLs and T cells. The hic-ratio insulation score was on average increased/decreased for TAD boundary gains/losses, respectively, across all T-ALL samples (Fig. 3E, F). Very few of the observed TAD insulation changes overlapped with genomic alterations such as deletions or insertions (Supplementary Note).
Fig. 3. TAD boundary insulation analysis reveals changes in insulation of neighboring TADs.
A) Schematic describing TAD boundary insulation alteration events.
B) Total numbers of TAD boundary gains / losses identified between T-ALL and T cells.
C+D) Representation of TAD insulation alteration events (red dots) among all pairs of adjacent TADs (black dots; n = 2,160 for boundary loss; n = 2,772 for boundary gain). Plots depict comparisons for TAD boundary losses of adjacent T cell TADs within T-ALL samples (C left), or between T cell samples 1 and 3 (C right). Plots in D) depict comparisons for TAD boundary gains of adjacent T-ALL TADs when compared to T cell samples (D left), or between T cell samples 1 and 3 (D right). Encircled adjacent TADs demarcate outliers of increased / decreased insulation accompanied by at least one increased / decreased CTCF binding, respectively. Significant changes in CTCF binding were calculated using the R package DiffBind with edgeR-method and filtered for FDR < 0.1 and log2 fold-change > 1 / < -1.
E+F) All TAD boundary alterations (boundary loss (E), boundary gain (F)) from comparisons in C) and D) between T-ALL and T cells were used to estimate heterogeneity. Hic-ratio insulation scores for each boundary and sample were compared vs. the average hic-ratio insulation score of all T cell samples. Boundary losses (n = 81) come with a decrease in insulation scores on average, while boundary gains (n = 86) come with increase in insulation scores across all T-ALLs on average when compared to the average hic-ratio insulation score of all T cell samples.
CTCF-mediated TAD insulation defines accessibility of MYC promoter/super-enhancer looping
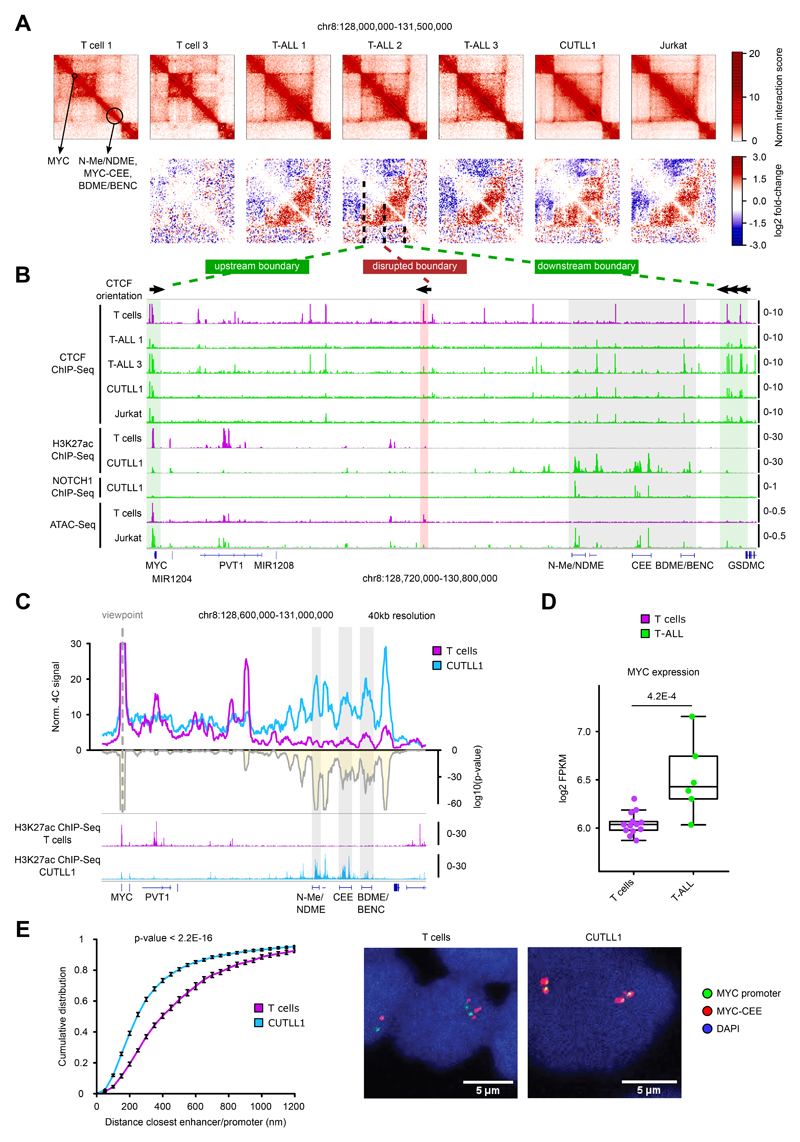
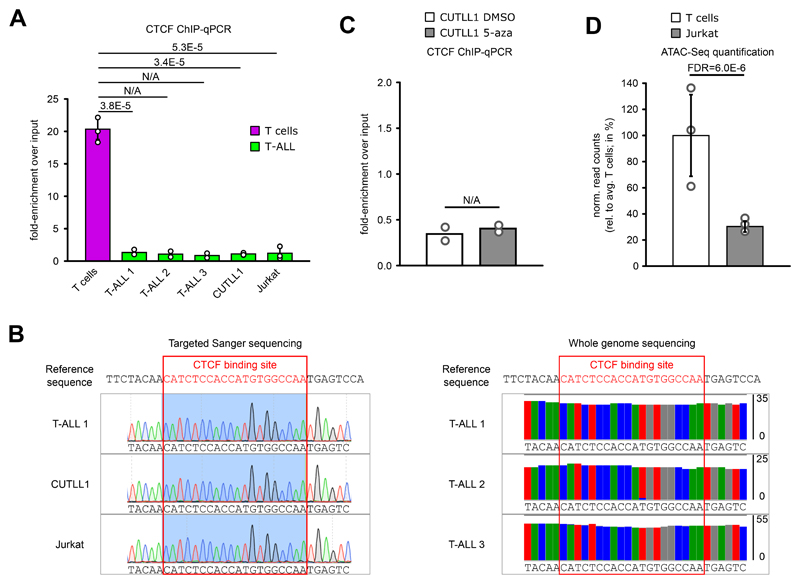
MYC expression is significantly up-regulated in T-ALL and is one of the main oncogenes activated downstream of NOTCH1 signaling 35,36. Intriguingly, we identified a recurrent TAD fusion in the MYC locus in all T-ALL samples compared to T cells (Fig. 4A), which was associated with a strong increase in inter-TAD interactions in T-ALL. Furthermore, the TAD fusion was associated with CTCF changes. We confirmed CTCF binding at the TAD boundary in T cells, and an almost complete absence of binding across the T-ALL samples (Fig. 4B, Extended Data Fig. 5A). The absence of CTCF binding was neither due to genomic mutations (Extended Data Fig. 5B) nor to DNA hyper-methylation within or adjacent to the CTCF binding site in T-ALL (data not shown). Furthermore, 5-azacytidine treatment leading to global DNA demethylation showed no restoration of CTCF binding in CUTLL1 cells (Extended Data Fig. 5C). Instead, ATAC-seq data indicated significantly reduced chromatin accessibility of the CTCF binding site in T-ALL (Fig. 4B, Extended Data Fig. 5D).
Fig. 4. CTCF-mediated TAD insulation defines accessibility of MYC promoter/super-enhancer looping.
A) Hi-C interaction heatmaps (first row) showing the MYC locus. Second row shows heatmaps of per-bin log2 fold-change interactions when compared to T cell 1.
B) CTCF and H3K27ac ChIP-seq tracks for the MYC locus. CTCF orientation is shown for canonical CTCF binding motifs derived from PWMScan 61 (database JASPAR CORE vertebrates; filtered by P value < 1 × 10⁻⁵; n = 143,164 total CTCF binding motifs). ChIP-seq and ATAC-seq tracks show fold-enrichment over input where applicable, counts-per-million reads otherwise. Number replicates: T cells CTCF n = 2; T-ALL 1 CTCF n = 2; T-ALL 3 CTCF n = 1; CUTLL1 CTCF n = 5; Jurkat CTCF n = 2; T cells H3K27ac n = 2; CUTLL1 H3K27ac n = 2; CUTLL1 NOTCH1 n = 1; T cells ATAC-seq n = 6; Jurkat ATAC-seq n = 3.
C) 4C-seq using MYC promoter as viewpoint. Positive y-axis shows interactions with the MYC promoter viewpoint as normalized read counts, negative y-axis shows significance of differential interactions between T cells and CUTLL1 as log10(P value) derived using edgeR function glmQLFTest. Tracks below show H3K27ac ChIP-seq tracks for T cells and CUTLL1 as fold-enrichment over input. Number replicates: T cells 4C n = 2; CUTLL1 4C n = 5; T cells H3K27ac n = 2; CUTLL1 H3K27ac n = 2.
D) MYC expression shown as log2 FPKM for T cells (n = 13) and T-ALL (n = 6). Statistical evaluation was performed using two-sided edgeR analysis with glmQLFTest followed by multiple testing correction.
E) Distance between MYC promoter and center enhancer element (MYC-CCE) measured by DNA-FISH analysis (left). Statistical difference between distributions of probe distances was calculated using two-sample one-sided Kolmogorov-Smirnov test following the hypothesis of increased probe-distance in T cells when compared to T-ALL. Error bars indicate s.d.; center value indicates median. Probe-pairs T cells = 993; Probe-pairs CUTLL1 = 2,001. Median distance T cells = 412.84 μm. Median distance CUTLL1 = 264.28 μm.
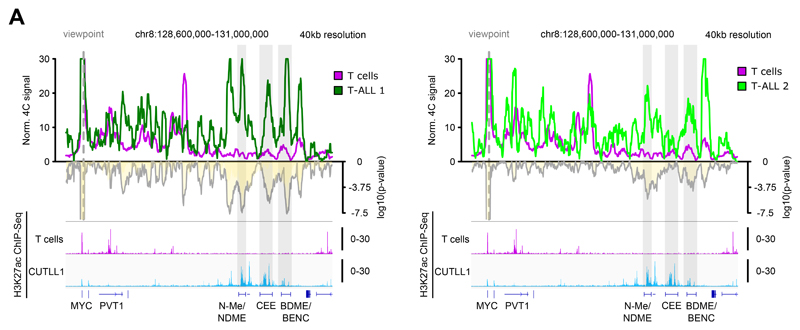
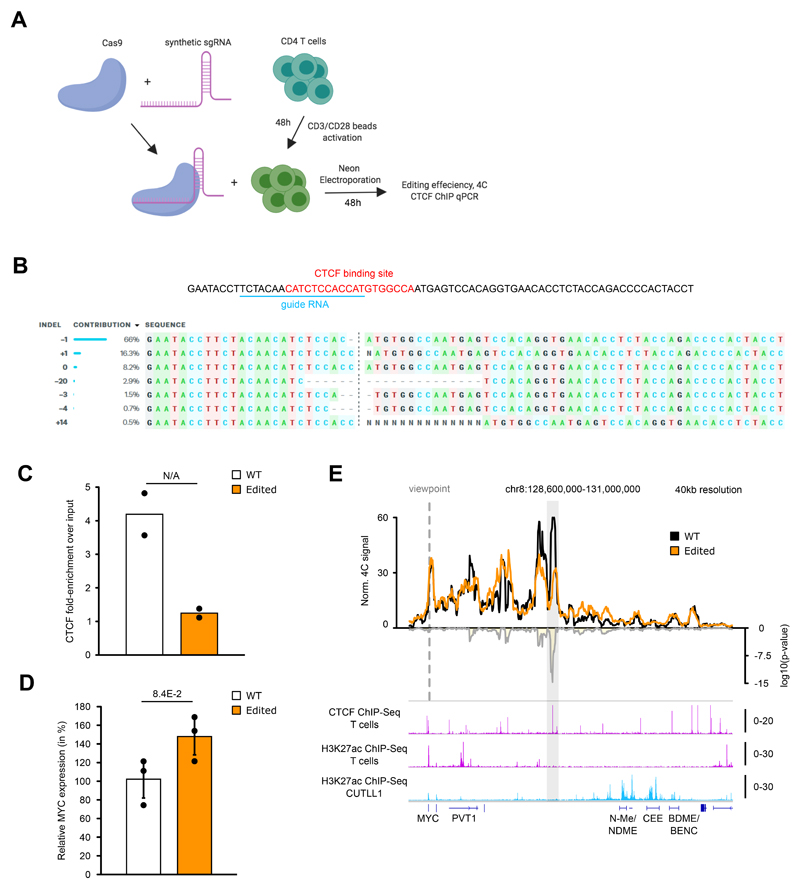
In T-ALL, MYC transcription is controlled by distant 3D interactions with a long stretch of enhancers, including the previously characterized NOTCH1-bound N-Me/NDME element 37,38 (Fig. 4B). As a result of the TAD fusion, the MYC promoter and the super-enhancer, separated by strong insulation in T cells, are now in spatial proximity within the same TAD in leukemic samples (Fig. 4A, B). 4C-seq analysis using the MYC promoter as viewpoint confirmed the interaction between the MYC promoter and the super-enhancer in primary T-ALL samples and CUTLL1, whereas in untransformed T cells, no such interaction was observed (Fig. 4C, Extended Data Fig. 6A). Interestingly, our analysis showed that the strongest and most significant interactions specifically overlap with H3K27ac ChIP-seq peaks throughout the entire super-enhancer, including an uncharacterized putative center enhancer element (from here on termed MYC-CEE) and the recently identified BDME/BENC enhancer (Fig. 4C, Extended Data Fig. 6A) 39,40. In agreement with our 3D chromosomal interaction data, MYC was overexpressed in our T-ALL patient sample cohort compared to normal T cells (Fig. 4D). We independently validated the interaction using 3D fluorescence in situ hybridization (FISH) with probes targeting the MYC promoter and MYC-CEE. Inter-probe distance was significantly higher in T cells compared to T-ALL (CUTLL1 cell line) consistent with the 4C-seq results (Fig. 4E). Additionally, disruption of CTCF binding by CRISPR-induced mutation in normal T cells significantly reduced interactions between the MYC promoter and the CTCF-bound TAD boundary region in edited T cells compared to WT T cells (Extended Data Fig. 7A-E, Supplementary Note).
Pharmacologic NOTCH1 inhibition leads to a decrease of 3D interactions in a subset of NOTCH1-regulated loci
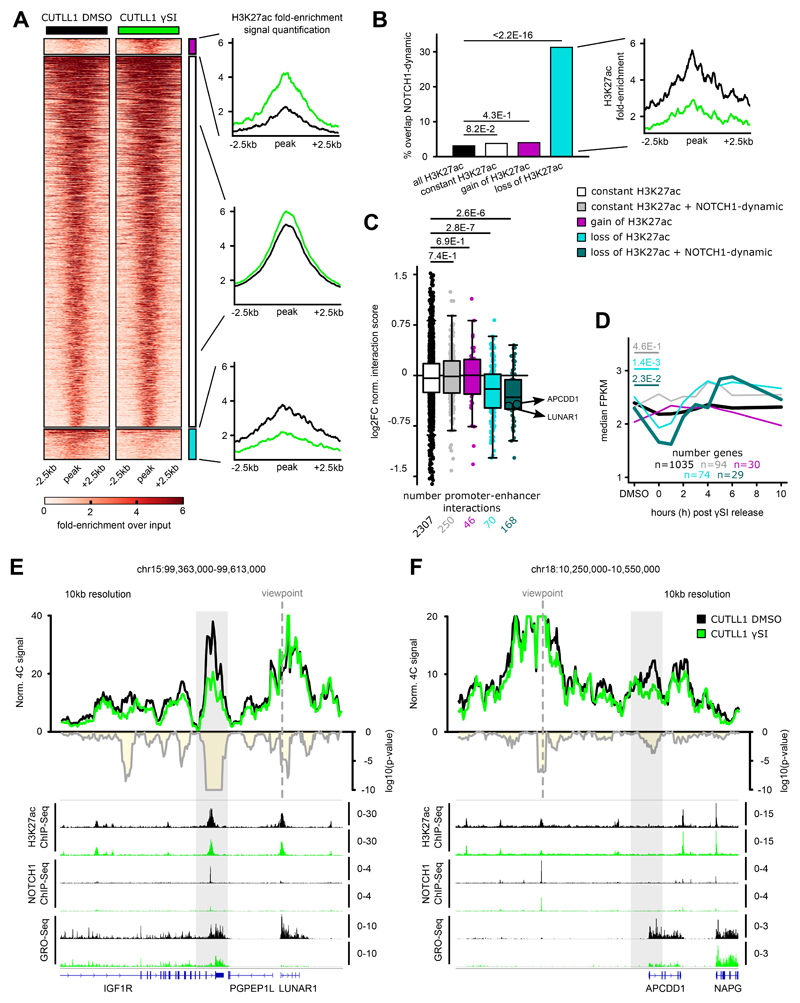
Our analysis revealed widespread changes in global TAD structure and intra-TAD activity affecting important genes in T-ALL. However, whether oncogenic drivers, such as NOTCH1, play a direct role in these changes and whether their inhibition can reverse these changes remains open. To address this, we performed in situ Hi-C in CUTLL1 cells treated with γSI for 72 h 21,35. γSI selectively inhibits NOTCH1 signaling and has strong anti-leukemic effects 36,41. Hi-C analysis following γSI treatment did not reveal any significant changes either in intra-TAD activity (Extended Data Fig. 8A) or reversal of TAD boundary insulation (Extended Data Fig. 8B). Moreover, it was previously shown that about 90% of NOTCH1 binding sites that are sensitive to γSI treatment (dynamic NOTCH1 sites) are localized in putative enhancers. These dynamic NOTCH1-occupied enhancers also showed significant changes in H3K27ac signal following NOTCH1 inhibition 21. We investigated whether chromatin interactions between such enhancers and target promoters were altered following γSI treatment. We first profiled H3K27ac following γSI treatment and categorized all non-promoter H3K27ac peaks as either stable peaks or those that display significant reduction / increase in H3K27ac signal (Fig. 5A). As previously observed, the H3K27ac peaks with reduced signal following γSI treatment were significantly enriched for dynamic NOTCH1 binding compared to stable / increased H3K27ac signals 21 (Fig. 5B). Next, to connect NOTCH1 inhibition, changes in H3K27ac and 3D looping, we used Hi-C data following γSI treatment to quantify changes in chromatin interactions of H3K27ac-enriched chromatin loops identified by H3K27ac HiChIP in CUTLL1 cells 42. Our HiChIP data showed enrichment of promoter-enhancer interactions as demonstrated by virtual 4C analysis using the MYC promoter as virtual viewpoint (Extended Data Fig. 8C). Dynamic NOTCH1-bound enhancers with reduced H3K27ac levels following γSI treatment showed strongest loss of chromatin interactions with connected genes (Fig. 5C). Interestingly, dynamic NOTCH1-bound enhancers with stable H3K27ac signal remained in stable contact with nearby promoters. To correlate changes in chromatin interactions with the dynamics of NOTCH1-dependent transcription, we performed global run of sequencing (GRO-seq)43 to measure nascent transcription following γSI treatment and after inhibitor “wash off”. Interestingly, the enhancer-promoter contacts most sensitive to γSI treatment included genes that showed significant response in transcription to NOTCH1 inhibition and after γSI wash off (Fig. 5D).
Fig. 5. NOTCH1 inhibition affects promoter-enhancer looping specifically of NOTCH1-dependent enhancers.
A) H3K27ac occupancy in CUTLL1 with and without NOTCH1-inhibitor γSI. Groups consist of stable (middle, black, n = 2,949), increased (upper, pink, n = 125) and reduced non-promoter H3K27ac signal (lower, light-blue, n = 243). Heatmap shows the H3K27ac signal as fold-enrichment over input and line plots depict quantification of H3K27ac signal, both created with DeepTools 62. Differential analysis was performed with the R package DiffBind with edgeR-method and differential peaks were selected using FDR < 0.05, log2 fold-change > 1.0 or < -1.0 (number replicates: CUTLL1 DMSO n = 4; CUTLL1 γSI n = 2).
B) Overlap of constant, increased and reduced H3K27ac peaks with previously defined NOTCH1-dynamic sites 21. Quantification of H3K27ac signal shown as fold-enrichment over input (right panel) for peaks with reduced H3K27ac signal and dynamic NOTCH1 binding (n = 76). Statistical evaluation was performed using two-sided Fisher test against all non-coding H3K27ac peaks overlapping dynamic NOTCH1 binding.
C) Changes in chromatin interactions upon γSI between non-promoter H3K27ac peaks defined in A) and B) and connected gene promoters are shown as log2 fold-change of averaged normalized interaction scores (average of n = 2 biological replicates). Each dot represents a promoter-enhancer interaction defined by H3K27ac HiChIP in CUTLL1. Significance of shifts of gene expression compared to enhancer-promoter loops of stable enhancers is calculated using an unpaired one-sided t test, following the hypothesis of a positive correlation between enhancer activity and promoter-looping.
D) Gene expression upon γSI for all genes defined in C) are shown as log2 fold-change of FPKM calculated from GRO-seq data. Significance of differences compared to genes associated with stable H3K27ac signal is calculated using an unpaired one-sided t test, following the hypothesis of a positive correlation between promoter-enhancer looping and gene expression.
E+F) 4C-seq using LUNAR1 promoter (E) or APCDD1 enhancer (F) as viewpoints. Positive y-axis shows interactions with the viewpoint as normalized read counts, negative y-axis shows significance of differential interactions between untreated and γSI treated CUTLL1 as log10(P value) calculated using edgeR function glmQLFTest. Tracks below show H3K27ac and NOTCH1 ChIP-seq and GRO-seq (positive strand only) as fold-enrichment over input where applicable, counts-per-million otherwise. Number replicates: CUTLL1 DMSO 4C LUNAR1 n = 2; CUTLL1 γSI 4C LUNAR1 n = 2; CUTLL1 DMSO 4C APCDD1 n = 2; CUTLL1 γSI 4C APCDD1 n = 2; CUTLL1 DMSO H3K27ac n = 2; CUTLL1 γSI H3K7ac n = 2; CUTLL1 DMSO NOTCH1 n = 1; CUTLL1 γSI NOTCH1 n = 1; CUTLL1 DMSO GRO-seq n = 2; CUTLL1 γSI GRO-seq n = 2.
To further validate changes among NOTCH1-sensitive enhancer-promoter interactions, we performed 4C-seq on two previously characterized NOTCH1 T-ALL targets, LUNAR1 and APCDD1. LUNAR1 is a long non-coding RNA that we have previously identified as a cis regulator of the expression of the neighboring IGF1R gene achieved by looping of LUNAR1 promoter with an IGF1R intronic enhancer 44,45. 4C-seq using LUNAR1 promoter as viewpoint identified strong interactions with the IGF1R enhancer. However, the interaction decreased significantly following NOTCH1 inhibition (Fig. 5E, Extended Data Fig. 8D), which correlated with reduced H3K27ac signal at the enhancer and decreased expression of LUNAR1 (Fig. 5E, Extended Data Fig. 8D). Similarly, 4C-seq using an APCDD1 enhancer with dynamic NOTCH1 and reduced H3K27ac signal as viewpoint, we identified decreased interaction between the enhancer and the promoter of APCDD1. These changes correlated with reduced expression of APCDD1 (Fig. 5F, Extended Data Fig. 8E). These results suggest that pharmacologic NOTCH1 inhibition can affect activity (as defined by H3K27ac levels) of dynamic NOTCH1-bound enhancers and that 3D interactions with such enhancers are significantly diminished. However, a subset of NOTCH1-regulated loci had neither significant H3K27ac loss nor reduced chromatin interactions following γSI treatment including the previously described MYC enhancer-promoter interaction and a dynamic NOTCH1-bound enhancer looping to the IKZF2 promoter (Extended Data Figs. 8F,G, 9; Supplementary Note). This suggests that NOTCH1 binding is critical for maintaining enhancer-promoter contacts only in a subset of loops and additional chromatin regulators may play a role in maintaining chromatin interactions of the γSI-insensitive loops.
CDK7 inhibition targets γSI-insensitive enhancer-promoter loops
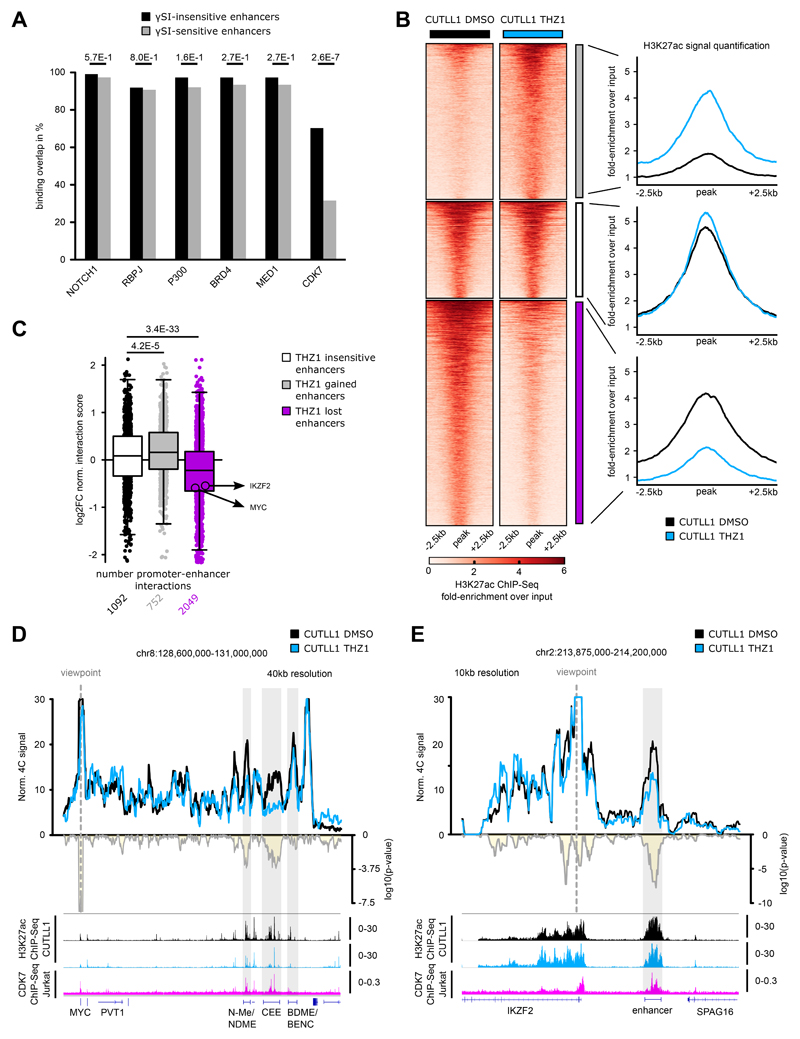
To further understand the differential sensitivity of dynamic NOTCH1-bound enhancers, we performed a differential binding analysis using LOLA and its LOLA database 46 between the γSI-sensitive and insensitive enhancers. Among the chromatin regulators and transcription factors available for T-ALL, we found cyclin-dependent kinase 7 (CDK7) binding to be significantly enriched in γSI-insensitive enhancers compared to the sensitive enhancers (Fig. 6A). To globally assess the role of CDK7 binding in the maintenance of γSI-insensitive enhancer-promoter loops, we performed Hi-C in CUTLL1 cells treated with the CDK7 inhibitor THZ1, which was previously demonstrated to have strong anti-leukemic activity 47. As before, we profiled H3K27ac levels following THZ1 treatment by ChIP-seq and categorized all non-promoter H3K27ac peaks as either peaks with stable, significantly reduced (THZ1 lost enhancer) or significantly increased (THZ1 gained enhancer) H3K27ac signal (Fig. 6B). Globally, as previously observed in the γSI treatment, enhancers with significant reduction in H3K27ac signal had a correlative reduction in long-range chromatin interactions to target promoters, whereas insensitive enhancers neither gained nor lost chromatin interactions on average (Fig. 6C).
Fig. 6. CDK7 inhibition concomitantly reduces H3K27ac levels and associated promoter-enhancer looping.
A) LOLA analysis for public ChIP-seq data in CUTLL1/Jurkat from the LOLA database with γSI-insensitive and γSI-sensitive enhancers. Statistical differences in overlap between γSI-insensitive and sensitive enhancers with ChIP-seq peaks were calculated using a two-sided Fisher exact test.
B) H3K27ac occupancy in CUTLL1. Groups consist of stable (middle, white, n = 1,396), increased (upper, grey, n = 2,246) and reduced non-promoter H3K27ac signal (lower, pink, n = 3248). Heatmap shows the H3K27ac signal as fold-enrichment over input and line plots depict quantification of H3K27ac signal. Differential analysis was performed with the R package DiffBind with edgeR-method and differential peaks were selected using FDR < 0.05, log2 fold-change > 1.0 or < -1.0 (Number replicates: CUTLL1 DMSO n = 4; CUTLL1 n = 2).
C) Changes in Hi-C interactions between non-promoter H3K27ac peaks defined in B) and connected gene promoters (defined using CUTLL1 H3K27ac HiChIP) are shown as log2 fold-change (average of n = 2 replicates). Each dot represents a promoter-enhancer interaction. Significance of shifts compared to enhancer-promoter interactions associated with stable enhancers is calculated by an unpaired one-sided t test.
D+E) 4C-seq using MYC (D) or IKZF2 promoter (E) as viewpoint. Positive y-axis shows interactions with the viewpoint as normalized read counts, negative y-axis shows significance of differential interactions as log10(P value) calculated using edgeR function glmQLFTest. Tracks below show H3K27ac and CDK7 ChIP-seq track, and represent fold-enrichment over input where applicable and counts-per-million reads otherwise. Number replicates: CUTLL1 DMSO 4C MYC n = 3; CUTLL1 THZ1 4C MYC n = 3; CUTLL1 DMSO 4C IKZF2 n = 3; CUTLL1 THZ1 4C IKZF2 n = 3; CUTLL1 DMSO H3K27ac n = 2; CUTLL1 THZ1 H3K27ac n = 2; Jurkat CDK7 n = 1.
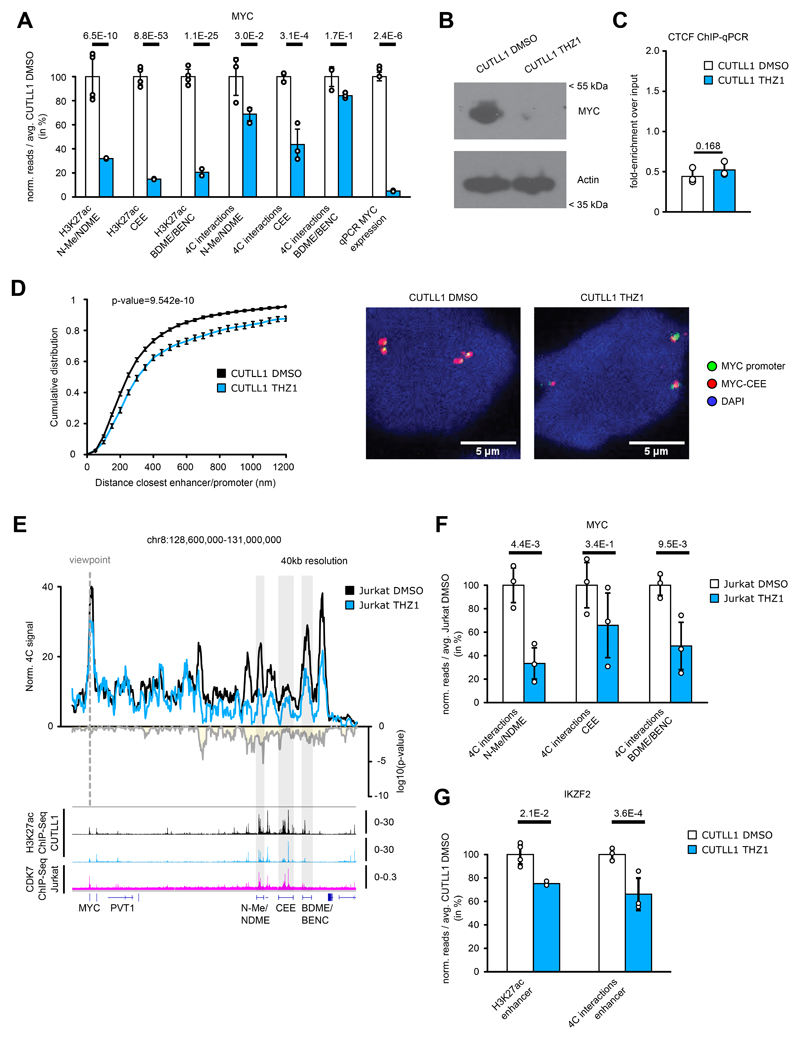
To further test the role of CDK7 in maintaining loops, we performed 4C-seq following THZ1 treatment in the previously identified γSI-insensitive MYC and IKZF2 loci. We observed a significant decrease in the interaction between both N-Me/NDME and MYC-CEE with the MYC promoter following the CDK7 treatment (Fig. 6D, Extended Data Fig. 10A). These changes were accompanied by a significant decrease in H3K27ac signal and MYC expression (Fig. 6D, Extended Data Fig. 10A, B). Finally, no significant gain in the binding of CTCF to the TAD boundary was observed, suggesting that the described loss of the promoter-enhancer interaction occurs independently of CTCF binding (Extended Data Fig. 10C). Additionally, DNA FISH analysis confirmed a significant increase in 3D distance between the MYC promoter and MYC-CEE probes following THZ1 treatment (Extended Data Fig. 10D). The effect of CDK7 on DNA looping was further confirmed in another T-ALL cell line and locus (Supplementary Note, Fig. 6E, Extended Data Fig. 10E, F, G). Overall, we demonstrate that targeting a transcription factor (NOTCH1) affects only a subset of 3D promoter-enhancer interactions associated with dynamic NOTCH1. Additional factors such as CDK7 can maintain contacts in a subset of γSI-insensitive enhancers in T-ALL. Furthermore, changes in H3K27ac levels emerge as a reliable indicator of chromatin interaction dynamics following drug treatments.
Discussion
Despite the intense focus on the regulatory role of TADs in human disease, it remains largely unexplored whether TAD boundary or intra-TAD activity changes are important for tumor initiation or maintenance. Indeed, aberrant activation of cancer drivers by enhancer hijacking remains the primary known mechanism linking 3D structural changes to oncogenic transformation 2,3,48,49. Our studies further these findings using human T-ALL as a model. They highlight the underlying complexity of factors regulating the 3D landscape in human leukemia with notable variations among different leukemia sub-types and suggest that drugs with reported anti-leukemic activity partially reverse 3D interactions in specific loci, potentially accounting for the anti-leukemogenic effects of these drugs.
Frequent loss of TAD boundary insulation has been previously observed in human cancer, including T-ALL 49. Consistent with these findings, we identify here a TAD boundary change within the MYC locus that is associated with increased enhancer-promoter interactions. MYC is an important downstream target of NOTCH1 that activates anabolic pathways to sustain proliferation induced by constitutive NOTCH1 activation 35,36. Our observations suggest that MYC upregulation in T-ALL relative to mature T cells is associated with differences in local chromatin architecture. At this point, it is not clear what regulates CTCF binding within the TAD boundary in T-ALL and T cells, although our preliminary studies have excluded a role for DNA methylation and somatic mutations within the CTCF motif. Interestingly, using ATAC-seq data, we found that the CTCF site is accessible in T cells but displayed greatly reduced accessibility in T-ALL cells suggesting differential chromatin accessibility as a potential mechanism of regulating CTCF binding. In support of this hypothesis, a recent report identified chromatin accessibility to correlate with CTCF binding during the interphase to pro-metaphase transition 50. In addition to the lost CTCF boundary in T-ALL, we also observed an increase in CTCF binding with the same orientation (facing into the TAD and towards MYC) downstream of the super-enhancer. Such clusters of CTCF surrounding super-enhancers have recently been described as super-anchors to ensure super-enhancer mediated regulation of nearby genes 51. Further studies of the regulatory mechanism underlying CTCF binding and chromatin accessibility in the MYC locus could provide alternate strategies to decrease MYC expression in T-ALL 52.
In addition to TAD boundary changes, we also found prevalent intra-TAD activity differences between T-ALL and T cells as well as between the two subtypes of T-ALL. The changes in intra-TAD activity correlated with expression changes, super-enhancer activity, NOTCH1 binding and insulation mediated by CTCF binding at those TAD boundaries, which appeared to be independent of compartment shifts. Supporting a prominent role for intra-TAD activity changes in modulating gene expression, recent studies tracking 3D chromatin modifications during developmental processes such as embryonic stem cell differentiation and neural development identified significant changes in interactions within (sub-)TADs that correlated with transcriptional levels and epigenetic states 53,54. Furthermore, in line with our findings, negative correlations of intra-TAD interactions with repressive histone marks have been reported in EZH2 mutant lymphomas 55. Herein, our observations suggest that gene expression changes in cancer cells are frequently associated with correlative changes in intra-TAD activity, CTCF insulation and enhancer activity. On a cautionary note, precise identification of 3D chromatin architectural changes in cancer cells depends on the comparison with its respective cell of origin population. Though the cell of origin of each our T-ALL samples is unknown, pilot experiments comparing 3D chromatin architecture of T-ALL cells to human thymic (CD4+CD8+) progenitors from healthy donors identified similar intra-TAD activity differences specific to T-ALL (data not shown). Further studies are required to understand a possible correlation between cell of origin and leukemia and even address potential 3D landscape differences between individual leukemia samples.
Finally, we also addressed the role of oncogenic NOTCH1 in organizing the 3D chromosomal landscape associated with T-ALL transformation and to what extent changes can be reversed by inhibiting NOTCH-signaling. NOTCH signaling inhibition is a powerful means to inhibit growth of NOTCH1-induced T-ALL 41,56. The effects of gamma secretase inhibitors (γSI) were reported to be selective to dynamic NOTCH1 sites, which are predominantly located within enhancers 21,38. Dynamic NOTCH1 sites are also associated with a decrease in enhancer activity following γSI treatment. These findings prompted us to further investigate the impact of NOTCH1 inhibition on the remodeling of the 3D landscape in leukemia. Our studies showed that NOTCH1 inhibition using γSI had no effect on global 3D chromatin structure but targeted enhancer-promoter interactions in selected NOTCH1-regulated loci. More specifically, we identified enhancer-promoter loops of dynamic NOTCH1-bound enhancers that were also associated with a decrease in H3K27ac following γSI treatment were particularly sensitive to NOTCH1 inhibition. These results concur with a recent report that demonstrated a role for NOTCH1 in facilitating specific long-range interactions in triple-negative breast cancer and mantle cell lymphoma 18.
In an attempt to further understand the importance for NOTCH1 binding in maintaining certain enhancer-promoter loops but not others, we initially found that enhancers most sensitive to NOTCH1 inhibition tend to be shorter in length. The longer stretch of such “insensitive” enhancers might enable other factors to bind and/or keep the chromatin in an open and accessible state for long-range chromatin interactions 57, thus offering a potential explanation for the variances in promoter-enhancer looping changes we observed for the NOTCH1-targets, including MYC, IKZF2, APCDD1 and LUNAR1. In agreement with this hypothesis, we found enrichment for CDK7 binding in γSI-insensitive enhancers over γSI-sensitive enhancers. CDK7 is a kinase previously shown to control the function of RNA polymerase II-mediated transcription 58. CDK7 inhibition has shown significant effects in hematological malignancies and other cancer types 47,59,60. We here show that pharmacological inhibition of CDK7 in T-ALL by THZ1 resulted in widespread decrease of enhancer activity as quantified by H3K27ac levels. Enhancers with strong reduction of H3K27ac were also associated with a significant decrease in enhancer-promoter contacts, including the γSI-insensitive loci of MYC and IKZF2. This clearly highlights the complexity of super-enhancer activity and the factors that dictate their interactions with gene promoters. Overall, our study underscores the need for further investigation of factors that maintain or rewire 3D chromosomal interactions especially during cellular transformation, as they could be potential targets for small molecule drug development.
Online Methods
Cell culture
Human cell lines CUTLL1, Jurkat and were cultured in RPMI-1640 media supplemented with 10% fetal bovine serum, penicillin, streptomycin and glutamine. Naïve CD4 T cells were purchased from Lonza and cultured in X- vivo 15 culture medium (Lonza) substituted with 5% human serum (Gemini Bioproducts) and 10 ng/ml human IL2.
Primary T-ALL samples
Primary T-ALL patient samples were collected by Columbia Presbyterian Hospital or Weill Cornell Medical College with informed consent and approved and analyzed under the supervision of the Columbia University Medical Center Institutional Review Board or Weill Cornell Medical College Institutional Review Board. For expansion of these cells, 1 × 10⁶ patient cells were transplanted into immunodeficient NOD SCID gamma (NSG) mouse strains via retro-orbital injection as previously performed64. Cells collected from the spleen of these primary recipients were used for the in-situ Hi-C experiment. All the mouse experiments were performed as per ethical guidelines set by IACUC and NYU.
In-situ Hi-C
In-situ Hi-CHi-C was performed as described in Rao et al. 65. Primary samples have been processed as one replicate and all cell line experiments were processed in two biological replicates each. Briefly, 20 million cells were fixed in 1% formaldehyde for 10 min. Fixed cells were permeabilized in 1 ml lysis buffer (10 mM Tris–HCl pH 8, 10 mM NaCl, 0.2% NP-40, protease inhibitor cocktail (Sigma) for 15 min on ice, spun down (2,000 × g, 5 min, 4°C), and the cell pellets were resuspended in 345 μl of 1× NEBuffer2 (NEB) per 5 million cell aliquot. 38 μl of 1% SDS was added to each aliquot, followed by incubation at 65°C for 10 min. 43 μl of 10% Triton X-100 was then added to quench the SDS. To digest chromatin, 400 U of HindIII (NEB) was added per aliquot and incubated at 37°C overnight with continuous agitation (900 rpm). After digestion, restriction sites were filled in with Klenow (NEB) in the presence of biotin-14-dATP (Life Technologies), dCTP, dGTP and dTTP for 2 h at 37°C. Blunt-end ligation was performed by adding 700 μl ligation mix (containing 50 U of the T4 DNA ligase (Invitrogen), followed by overnight incubation at 16°C.
The cross-links were reversed by adding 50 μl of 10 mg/ml proteinase K (Invitrogen) per aliquot and incubated at 65°C for 2 h, followed by addition of another 50 μl 10 mg/ml proteinase K and incubated overnight. All the aliquots per replicate were pooled and DNA was extracted by phenol/chloroform extraction protocol. RNA was digested by adding 1 μl of 1 mg/ml RNase A (Sigma) and incubated at 37°C for 30 min. Biotin was removed from non-ligated restriction fragment ends by incubating 40 μg of DNA with T4 DNA polymerase (NEB) for 4 h at 20°C in the presence of dATP and dGTP. After DNA purification (Amicon Ultra 30K) and sonication (Covaris E220), the sonicated DNA was double-size selected using Ampure XP beads (Beckman Coulter, 0.8 X - 1.1 X). End-repair was performed using T4 DNA polymerase (NEB), T4 DNA polynucleotide kinase (NEB), Klenow (NEB) and dNTPs in 1× T4 DNA ligase reaction buffer (NEB), followed by dATP-addition with Klenow. Biotin-marked ligation products were isolated with MyOne Streptavidin C1 Dynabeads (Life Technologies). Paired-end (PE) adapters (Illumina) were ligated to DNA fragments using 15 U of the T4 DNA ligase (Invitrogen) for 2 h at room temperature. Bead-bound DNA was amplified with 6 PCR amplification cycles using PE PCR 1.0 and PE PCR 2.0 primers (Illumina). Primary samples T-ALL 2-5, T cell donor 2 and ETP-ALL samples along with CUTLL1 DMSO and THZ1 treated samples were processed with the commercial Arima genomics HiC Kit (https://arimagenomics.com/) and processed according to manufactures guidelines. The Hi-C libraries were sequenced on Illumina Hi-Seq 2500 or Illumina Hi-seq 4000 at 50 cycles.
4C-seq
For LUNAR1 and APCDD1 viewpoints, we have created biological duplicates for all experiments. For MYC viewpoint, we have created five biological replicates for CUTLL1 DMSO, three replicates for CUTLL1 γSI and two replicates for CUTLL1 JQ1 and two replicates for T cells. Edited T cells 2 replicates (5 million each); CUTLL1 DMSO and THZ1 treatment, biological triplicates.
For each replicate, 10 million cells were fixed in 2% formaldehyde and 10% FBS in PBS for 10 min at room temperature. For edited and WT T cells, 5 million cells were used. Crosslinking was quenched with glycine and the 4C-seq was performed as described previously 16. Cells were lysed on ice with 1ml lysis buffer (50 mM Tris pH 7.3, 150 mM NaCl, 5 mM EDTA, 0.5% NP-40, 1% Triton X-100) for 15 min. Nuclei were spun down and resuspended in 360 μl H2O (or frozen). 60 μl of 10× DpnII restriction buffer was added along with 15 μl 10% SDS, and left shaking for 1 h at 37°C followed by addition of 150 μl of 10% Triton X-100 and an additional shaking for 1 h at 37°C. 5 μl of undigested control was stored, and nuclei were incubated overnight with 200 U of DpnII (NEB, R0543M) restriction enzyme. A fresh 200 U of DpnII was added the following morning for 6 h. Following this, the digestion was checked for completion by running 5 μl of sample in a 1% agarose gel. DpnII was inactivated with 80 μl 10% SDS, and a proximity ligation reaction was performed in a 7 ml volume using 4,000 U T4 DNA Ligase (NEB M0202M). Crosslinks were reversed at 65°C overnight after adding 300 μg Proteinase K. Samples were then treated with 300 μg RNase A for 45 min at 37°C, and DNA was ethanol precipitated. A 2nd restriction digest was performed overnight in a 500 μl reaction with 50 U Csp6l (Fermentas, ER0211). The enzyme was inactivated at 65°C for 25 min, and a proximity ligation reaction was performed in a 14 ml volume with 6,000 U T4 DNA Ligase. Sample DNA was ethanol precipitated, and purified using the QIAquick PCR purification kit (Qiagen). To generate 4C-seq library, 1 μg of prepared 4C template was amplified 30 PCR cycles per bait per condition (see Supplementary Table 6 for viewpoint sequences) and the amplified fragments were sequenced in Illumina HiSeq 2500 to generate single end reads at 50 cycles.
HiChIP
HiChIP was performed as previously described42 with some modifications. In brief, up to 10 million crosslinked cells were resuspended in 500 μl of ice-cold HiC lysis buffer (10 mM Tris-HCl pH 7.5, 10 mM NaCl, 0.2% NP-40, 1× protease inhibitors) and rotated at 4°C for 30 min. Nuclei were pelleted and washed once with 500 μl of ice-cold HiC lysis buffer. The pellet was then resuspended in 100 μl of 0.5% SDS and incubated at 62°C for 10 min. 285 μl of water and 50 μl of 10% Triton X-100 were added, and samples were rotated at 37°C for 15 min. 50 μl of NEB Buffer 2 and 15 μl of 25 U/μl. MboI restriction enzyme (NEB, R0147) was then added, and sample was rotated at 37°C for 2 h. MboI was then heat inactivated at 62°C for 20 min. We added 52 μl of incorporation master mix: 37.5 μl of 0.4 mM biotin–dATP (Jena Biosciences, NU-835-BIO14-S); 1.5 μl of a dCTP, dGTP, and dTTP mix at 10 mM each; and 10 μl of 5 U/μl DNA Polymerase I, Large (Klenow) Fragment (NEB, M0210). The reactions were then rotated at 37°C for 1 h. 948 μl of ligation master mix was then added: 150 μl of 10× NEB T4 DNA ligase buffer with 10 mM ATP (NEB, B0202), 125 μl of 10% Triton X-100, 3 μl of 50 mg/ml BSA (Thermo Fisher, AM2616), 10 μl of 400 U/μl T4 DNA Ligase (NEB, M0202), and 660 μl of water. The reactions were then rotated at room temperature for 4 h. After proximity ligation, the nuclei were pelleted and the supernatant was removed. The nuclear pellet was resuspended in 880 μl in Nuclear Lysis Buffer (50 mM Tris-HCl pH 7.5, 10 mM EDTA, 0.5% SDS, 1× Roche protease inhibitor, 11697498001), and sonicated with a Bioruptor 300 (Diagenode) for 8 cycles of 30 seconds each, on high setting. Clarified samples were transferred to Eppendorf tubes and diluted five times with ChIP Dilution Buffer (0.01% SDS, 1.1% Triton X-100, 1.2 mM EDTA, 16.7 mM Tris-HCl pH 7.5, 167 mM NaCl). Cells were precleared with 30 μl of Protein G dynabeads (Life technology #10004D) in rotation at 4°C for 1 h. Supernatants were transferred into fresh tubes and antibody was added (7.5ug H3K27Ac antibody for 10 million cells) and incubated overnight at 4°C. The next day 30 μl of Protein G dynabeads were added and samples rotated at 4°C for 2 h. After bead capture, beads were washed with low-salt wash buffer (0.1% SDS, 1% Triton X-100, 2 mM EDTA, 20 mM Tris-HCl pH 7.5, 150 mM NaCl), high-salt wash buffer (0.1% SDS, 1% Triton X-100, 2 mM EDTA, 20 mM Tris-HCl pH 7.5, 500 mM NaCl), and LiCl wash buffer (10 mM Tris-HCl pH 7.5, 250 mM LiCl, 1% NP-40, 1% sodium deoxycholate, 1 mM EDTA). Samples were eluted with 150 μl of DNA elution buffer (50 mM sodium bicarbonate pH 8.0, 1% SDS, freshly made) and incubated at 37°C for 30 min with rotation. Supernatant was transferred to a fresh tube and elution repeated with another 150 μl elution buffer. 5 μl of Proteinase K (20 mg/ml) (Thermo Fisher) were added to the 300 μl reaction and samples were incubated overnight at 65°C. Samples were purified with DNA Clean and Concentrator columns (Zymo Research) and eluted in 10 μl of water. Post-ChIP DNA was quantified by Qubit (Thermo Fisher). 5 μl of Streptavidin C-1 beads (Thermo Fisher) were washed with Tween Wash Buffer (5 mM Tris-HCl pH 7.5, 0.5 mM EDTA, 1 M NaCl, 0.05% Tween-20) then resuspended in 10 μl of 2× biotin binding buffer (10 mM Tris-HCl pH 7.5, 1 mM EDTA, 2 M NaCl). Beads were added to the samples and incubated at room temperature for 15 min with shaking. After capture, beads were washed twice by adding 150μl of Tween Wash Buffer and incubated at 55°C for 2 min with shaking. Samples were then washed in 100 μl of 1× TD Buffer (2× TD Buffer is 20 mM Tris-HCl pH 7.5, 10 mM magnesium chloride, 20% dimethylformamide). After washes, beads were resuspended in 22 μl of Arima Elution Buffer, and the library was generated on Streptavidin C-1 beads with a modified Kapa Library Preparation Kit. End repair and adapter ligation was carried out on 20 μl of bead-bound DNA. 1 μl of 15 μM Illumina TruSeq sequencing adapters were then added to sample, along with 49 μl of master mix containing DNA Ligase, Ligase Buffer and PCR-grade water and incubated at 20°C for 15 mins. After adaptor ligation, the samples were washed twice with Arima Wash Buffer and incubated at 55°C for 2 min with shaking. The samples were washed once more with 100 μl of Elution Buffer, and finally resuspended in 22 μl of Elution Buffer. 25 μl of HiFi HotStart Ready Mix and 10× primer mix (Kapa Library Amplification Kit) was added per sample. The following PCR program was performed: 98°C for 45 sec, then 10 cycles at 98°C for 15 s, 60°C for 30 s, and 72°C for 30 s, and the final extension was completed at 72°C for 1 min (cycle number was estimated based on the amount of material from the post-ChIP Qubit (approximately 50 ng was run in six cycles, while 25 ng was run in seven, 12.5 ng was run in eight, etc.). Libraries were sequenced on an IlluminaHiSeq4000 platform on PE50 mode.
In vitro drug treatment
CUTLL1 cells were treated with gamma secretase inhibitor (Compound E) purchased from Alexis Bioscience at a 1 μM final concentration. Treatment was performed every 12 hours for 72 hours. THZ1 was purchased from Cayman Chemical (Catalog no: 9002215) and the cells were treated at 100 nM final concentration every 12 h for 24 h. For 5-azacytidine, the cells were treated with 100 nM every day for 3 days (72 h).
GRO-seq and library preparation
GRO-seq sequencing were performed in CUTLL1 cells treated with either DMSO or γSI at 1 μM for 72 h. All experiments were performed in biological duplicates. Gro-seq sample preparation was performed as described previously 66. Briefly, nuclei were isolated in swelling buffer (10 mM Tris-HCl pH 7.5, 2 mM MgCl2, 3 mM CaCl2), lysed twice in lysis buffer (10 mM Tris-HCl pH 7.5, 2 mM MgCl2, 3 mM CaCl2, 10% glycerol, 0.5% NP-40) and snap-frozen in freezing buffer (50 mM Tris pH 8.0, 40% glycerol, 5 mM MgCl2, 0.1 mM EDTA), For run-on reaction, an equal volume of reaction buffer was added to thawed nuclei (10 mM Tris pH 8.0, 5 mM MgCl2, 300 mM KCl, 500 μM ATP, 500 μM GTP, 5 μM CTP, 500 μM BrUTP, 1 mM dithiothreitol, 100 U/ ml SuperaseIN, 1% Sarkosyl), mixed and incubated at 30 °C for 5 min. The reaction was stopped with Trizol reagent and RNA was phenol/chloroform extracted and ethanol precipitated. RNA was heated in fragmentation buffer (40 mM Tris pH 8.0, 100 mM KCl, 6.25 mM MgCl2, 1 mM dithiothreitol), DNase treated and purified using Zymo RNA Clean & Concentrator (Zymo Research) using the > 17 nt protocol. Run-on RNA was immunoprecipitated using BSA-blocked BrDU beads (Santa Cruz) in binding buffer (SSPE 0.5×, 1 mM EDTA, 0.05% Tween-20) for 1 h at 4 °C, washed and eluted in elution buffer (5 mM Tris pH 7.5, 300 mM NaCl, 20 mM dithiothreitol, 1 mM EDTA, 1% SDS) at 65 °C for 20 min. Nascent RNA was further phenol/chloroform extracted and sequencing libraries were prepared.
Sanger sequencing of CTCF binding site in MYC locus
Genomic DNA from CUTLL1, Jurkat and T-ALL1 were isolated using Qiagen DNeasy kit as per manufacturer’s guidelines. Target locus was PCR amplified using Phusion High Fidelity PCR Master Mix (Thermo Fisher; Catolog no. F531S) using 100 ng genomic DNA as template. Primer sequences are listed in Supplementary Table 6. PCR product was purified using Qiagen PCR purification column and submitted for Sanger sequencing to Genewiz.
CTCF-targeting gRNA sequence
The guide RNA target sequence is UCUACAACAUCUCCACCAUG. The guide RNA along with the tracer RNA was purchased as a synthetic guide RNA from Synthego with 2′-O-methyl 3′ phosphorothioate modifications of the first and last three nucleotides.
Editing of T cells
Naïve T cells were activated with CD3/CD28 beads from Thermo Fisher Scientific (Catalog no: 11161D) for 48 h. Following activation, the CD3/CD28 beads were magnetically removed and 2 million activated T cells were transfected by electrotransfer with either Cas9 (1.5 μg) protein and 1 μg guide RNA ribonucleoprotein complex or Cas9 (1.5 μg) protein alone for every 200,000 cells using a Neon Transfection system at 1,200 V, Width 40 and 1 pulse. Following electroporation, the cells were diluted into culture medium at 106 cells per ml. The electroporation step was repeated after 24 h. 48 h post second transfection, genomic DNA was isolated. Target CTCF region was PCR-amplified and subjected to Sanger sequencing. Editing efficiency was computed using the ICE computational program from Synthego.
High-throughput 3D DNA-FISH
Generation of FISH probes
Custom FISH probes targeting MYC promoter and enhancer were designed using the SureDesign custom oligo design tool from Agilent with homology to the regions of interest mined from the hg19 genome build using the default parameters of the SureDesign tool. The MYC promoter probe library targeted a 60-kb region centered around the promoter whereas the enhancer probe library targeted a 100-kb region targeting the center enhancer element of the MYC super-enhancer cluster.
3D-FISH experimental protocol
3D-FISH was performed using the Dako FISH Histology accessory kit from Agilent (Catlog no: K579911-5) as per manufacturer guidelines. Briefly, 200,000 cells were cytospun to poly-L-lysine-treated glass slides at 1,200 rpm for 5 min. Cells were subsequently fixed for 10 minutes with 4% formaldehyde in PBS at room temperature (RT), followed by membrane permeabilization with 0.5% Triton X-100 in PBS for 20 minutes at RT. The slides were washed once in 1× PBS followed by RNase treatment (100 μg/ml RNase A in 2× SSC buffer). The cells were then wash with 2× SSC and dehydrated through alcohol series: 2× 100% ethanol and 2× 70% ethanol, 2 minutes each at RT. The slides were washed with 1× Dako Wash buffer for 5 minutes at RT and treated with 1× Dako pre-treatment solution at 98 °C for 2 minutes and allowed to cool down for 15 minutes at RT. Following pre-treatment, the slides were washed twice with 1× Dako Wash buffer for 3 minutes each at RT. Then the slides were treated with cold pepsin at 37°C for 2 minutes followed by two washes with 1× Dako Wash buffer for 3 minutes each at RT. Then the slides were dehydrated through a series of ethanol washes 70% ethanol, 80% ethanol and 100% ethanol, 2 minutes each at RT. Following the ethanol washes, the slides were air dried and set up for probe hybridization. For each slide 1 μl of each probe mixed with 9 μl of IQFISH Fast Hybridization buffer were added, covered with a coverslip and sealed with rubber cement. The slides were incubated at 80°C in a heat block for 10 minutes followed by 90-minute incubation in a hot air oven set at 45°C in dark. Following hybridization, the rubber cement was removed and the slides were washed with 1× Dako stringent wash buffer for 5 minutes at RT immediately followed by a second wash with 1× Dako stringent wash buffer for 10 minutes at 56°C. The stringent washes were followed with two washes of 1× Dako Wash buffer for 3 minutes each at RT. The slides were then dehydrated through a series of ethanol washes 70% ethanol, 80% ethanol and 100% ethanol, 2 minutes each at RT, air dried and mounted with coverslips using immune-mount with DAPI stain.
Computational analysis
Raw sequencing data were mostly processed with the hic-bench platform 29. Detailed descriptions about individual analysis can be found in Supplementary Methods.
Further detailed information on experimental design and reagents can be found in the Life Sciences Reporting Summary document.
Statistics and reproducibility
All sequencing experiments and functional analyses involved at least two replicates being either independently prepared, cultured, treated and isolated cell lines (CUTLL1, Jurkat and activated T cells) or xenografts of different primary patient samples, using independent recipient mice for each replicate.
Statistical analyses for differential gene expression, differential ChIP-seq peaks and differential 4C-seq peaks was conducted with the R Bioconductor package edgeR using two or more independent replicates as described above (after intra-sample sequencing depth normalization with ‘cpm’ function, inter-sample dispersion correction using ‘estimateCommonDisp’ and ‘estimateTagwiseDisp’ functions followed by ‘glmQLFit’ and ‘glmQLFTest’ for differential analysis). Differential Hi-C analysis, either based on compartment scores or TAD activity scores, was performed with two-sided t test.
Statistical significance of differences in odds ratios between two groups (Figs. 2F, 5B, 6A) was calculated using a two-sided Fisher’s exact test.
When we expected changes towards one direction we used one-tailed t test under the following null hypotheses for Figures 2D,E,G:
H0: The mean expression/CTCF binding strength changes of genes/peaks associated with differential intra-TAD activity (e.g. expression fold-change T-ALL/T-cells in T-ALL specific TADs) is unchanged or follows a negative correlation with intra-TAD activity changes.
E.g. μT-ALL specific TADs < μconstant TADs
HA: The mean expression/CTCF binding strength changes of genes/peaks associated with differential intra-TAD activity (e.g. expression fold-change T-ALL/T-cells in T-ALL specific TADs) is unchanged or follows a positive correlation with intra-TAD activity changes.
E.g. μT-ALL specific TADs ≥ μconstant TADs
Similarly, for comparisons of enhancer-promoter loops or associated expression of genes connected with enhancers of reduced activity (Figs. 5C, 5D, 6C) we used one-tailed t test under the following hypothesis:
H0: The mean looping strength / expression of enhancer-promoter pairs / associated genes in treated CUTLL1 cells is greater or equals than the looping strength / expression of enhancer-promoter pairs / associated genes in untreated CUTLL1 cells.
μtreated CUTLL1 ≥ μuntreated CUTLL1
HA: The mean looping strength / expression of enhancer-promoter pairs / associated genes in treated CUTLL1 cells is smaller than the looping strength / expression of enhancer-promoter pairs / associated genes in untreated CUTLL1 cells.
μtreated CUTLL1 < μuntreated CUTLL1
Lastly, for comparisons of 3D-FISH probe distances used for validations of genome-wide comparisons (Fig. 4E, Extended Data Fig. 10D) we used one-tailed Kolmogorov-Smirnov test under the following hypothesis:
H0: The mean distance of probes in T-ALL/treated T-ALL is greater or equals than the distance of probes in T-cells/untreated T-ALL cells.
E.g. μT-ALL ≥ μT-cells
HA: The mean distance of probes in T-ALL/treated T-ALL is smaller than the distance of probes in T-cells/untreated T-ALL cells.
E.g. μT-ALL < μT-cells
The number (n) independent replicates tested and the statistical test used in each case is described in the respective figure legends; the exact P value is indicated in the respective figure in all cases.
Extended Data
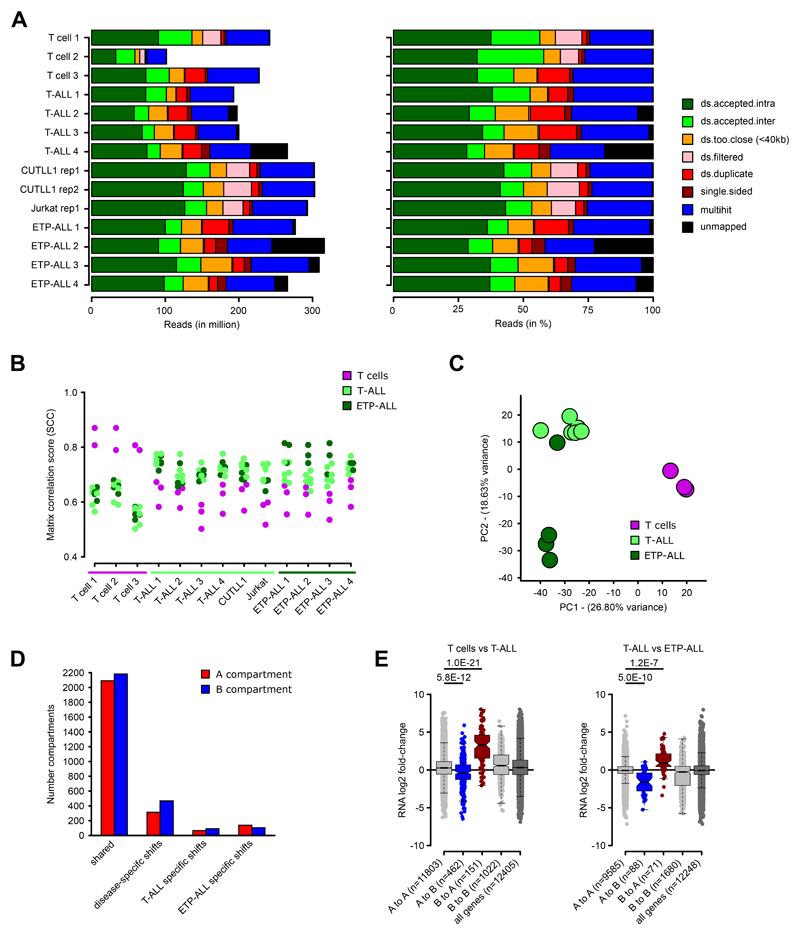
Extended Data Fig. 1. Hi-C quality control and unsupervised analyses.
A) Read alignment statistics for Hi-C datasets, as absolute reads (left) and relative reads (in %, right). “ds.accepted.intra” are all intra-chromosomal reads used for all downstream analyses.
B) Genome-wide stratum-adjusted correlation coefficient (SCC) scores for all pair-wise comparisons of the Hi-C datasets. HiCRep was used to calculate chromosome-wide correlation scores, which were averaged across all chromosomes for each pair-wise comparison. The HiCRep smoothing parameter X was set to 1.0.
C) Principal Component Analysis (PCA) of the genome-wide compartment scores for each Hi-C dataset. Number samples: T cells n = 3; T-ALL n = 6, ETP-ALL n = 4.
D) Compartment shifts between T cells, T-ALL and ETP-ALL. Assignment of A compartment was done using an average c-score > 0.1 in either all T cell, T-ALL or ETP-ALL samples and B compartment with average c-score < -0.1. Significance for differences between pairwise comparisons of T cells, T-ALL and ETP-ALL was determined using a two-sided t test between c-scores, and compartment shifts were determined using P value < 0.1.
E) Integration of gene expression associated with compartment shifts for comparisons of T cell vs T-ALL (left) or T-ALL vs ETP-ALL (right) using RNA-seq (FPKM > 1). For each gene within the respective compartment bin, log2 fold-change between T cells and T-ALL (left) or between T-ALL and ETP-ALL (right) is shown. Significant differences are calculated using an unpaired one-sided t test comparing genes from A to A compartments (i.e. active compartment) with genes from A to B or B to A compartment shifts, following the hypothesis of a positive correlation between expression and compartment association.
Extended Data Fig. 2. Genomic loci displaying differential intra-TAD activity in T-ALL.
A) Hi-C interaction heatmaps (first row) showing the IKZF2 locus (black circle). Second row shows heatmaps of log2 fold-change interactions compared to T cell 1.
B) H3K27ac ChIP-seq tracks for IKZF2 locus in T cells and CUTLL1, NOTCH1 ChIP-seq tracks for CUTLL1. Tracks represent fold-enrichment over input where applicable and counts-per-million reads otherwise. Number replicates: T cells H3K27ac n = 2; CUTLL1 H3K27ac n = 2; CUTLL1 NOTCH1 n = 1.
C) Quantifications for intra-TAD activity (left; as highlighted in A)) and expression of IKZF2 (right). Statistical evaluation for intra-TAD activity was performed using paired two-sided t test of average per interaction-bin for IKZF2 TAD between T cells (n = 3) and T-ALL (n = 6), followed by multiple testing correction. Log2 FPKM of IKZF2 expression for T cells (n = 13) and T-ALL (n = 6) samples; statistical evaluation was performed using edgeR followed by multiple testing correction.
D) Hi-C interaction heatmaps (first row) showing the CYLD locus (black circle). Second row shows heatmaps of log2 fold-change interactions when compared to T-cell 1.
E) H3K27ac ChIP-seq tracks for CYLD locus in T cells and CUTLL1, NOTCH1 ChIP-seq tracks for CUTLL1. Tracks represent fold-enrichment over input where applicable and counts-per-million reads otherwise. Number replicates: T cells H3K27ac n = 2; CUTLL1 H3K27ac n = 2; CUTLL1 NOTCH1 n = 1.
F) Quantifications for intra-TAD activity (left; as highlighted in D)) and expression of CYLD (right). Statistical evaluation for intra-TAD activity was performed using paired two-sided t test of average per interaction-bin for CYLD TAD between T cells (n = 3) and T-ALL (n = 6), followed by multiple testing correction (see methods). Log2 FPKM of CYLD expression for T cells (n = 13) and T-ALL (n = 6); statistical evaluation was performed using edgeR followed by multiple testing correction.
Extended Data Fig. 3. Intra-TAD activity cross-comparison of T-ALL sub-types.
A) Comparisons of intra-TAD activity between T cells, T-ALL and ETP-ALL samples.
B) Overlap of differentially active TADs between the two comparisons of T cells vs T-ALL and T cells vs ETP-ALL, visualized as venn diagram. Red and blue colors correspond to differences as highlighted in A).
C+D) Integration of RNA-seq (FPKM > 1) within TADs with decreased / increased intra-TAD activity for ETP-ALL vs T cells (C) and ETP-ALL vs T-ALL (D). For each such gene, the log2 fold-change in expression between ETP-ALL and T cells (C) / T-ALL and ETP-ALL (D) taken from RNA-seq is shown. Significant differences are calculated by an unpaired one-sided t test comparing genes from TADs with decreased / increased intra-TAD activity with genes from stable TADs, following the hypothesis of a positive correlation between expression and intra-TAD activity changes.
Extended Data Fig. 4. WGS integration with TAD boundaries altered in T-ALL.
A+B) Overlap of altered TAD boundaries as in Figure 3C and 3D with genomic inversions (A) or insertions/deletions (indels) (B) from WGS of T-ALL 1 (top) and T-ALL 2 (bottom). Overlap was determined by bedtools intersect, using a 1bp overlap for indels and 100kb for individual inversion breakpoints (instead of the entire genomic range affected by the inversion).
C) Overlap of individual translocation breakpoints (calculated from T-ALL Hi-C samples as in Supplementary Fig. 1B) with TAD boundaries displaying changes in TAD insulation between T cells and T-ALL. Overlap was determined by bedtools intersect, using a 1bp overlap.
Extended Data Fig. 5. Difference in CTCF insulation in MYC locus is not due to genomic mutation but potentially regulated by open chromatin.
A) CTCF ChIP-qPCR of the CTCF binding site in the lost MYC TAD boundary, shown as fold-enrichment over input. Significant differences compared to T cells were calculated with an unpaired one-sided t test, following the hypothesis of loss of CTCF binding in T-ALL samples as determined from the genome-wide analysis (n = 3 replicates for T cells, T-ALL 1, T-ALL 2, CUTLL1 and Jurkat; n = 2 replicates for T-ALL 3 and T-ALL 4). Error bars indicate s.d.; center value indicates mean.
B) Targeted sanger sequencing indicates no mutation in T-ALL in the CTCF binding site at the MYC TAD boundary. Tracks show chromatogram of individual base calls (left). Whole genome sequencing indicates no mutation in T-ALL in the motif of CTCF binding site. Tracks show (mis-)matches compared to reference sequence in all reads covering the respective genomic position (right).
C) CTCF ChIP-qPCR before and after treatment with global DNA-demethylation agent 5-azacytidine (n = 2 replicates).
D) ATAC-seq quantification for T cells and Jurkat for the genomic area covering loss of CTCF binding in the downstream TAD boundary of MYC. Data was normalized to the average T cell signal, shown in percent (n = 3 replicates). Statistical evaluation was performed using DiffBind with edgeR-method, following multiple testing correction. Error bars indicate s.d.; center value indicates mean.
Extended Data Fig. 6. 4C-Seq validation of MYC super-enhancer interaction in primary T-ALL.
A) 4C-seq analysis using MYC promoter as viewpoint. Positive y-axis shows interactions with the MYC promoter viewpoint as normalized read counts, negative y-axis shows significance of differential interactions between T cells and primary T-ALL samples as log10(P value) derived using edgeR function glmQLFTest. H3K27ac ChIP-seq tracks for T cells and CUTLL1 are represented below as fold-enrichment over input. Number replicates: T cells 4C n = 2; T-ALL 1 4C n = 1; T-ALL 2 4C n = 2; T cells H3K27ac n = 2; CUTLL1 H3K27ac n = 2.
Extended Data Fig. 7. CRISPR-Cas9 deletion of CTCF binding site shows loss of insulation around MYC locus.
A) Schematic of Cas9+Synthetic guide transfection of activated T cells.
B) Sequence showing CTCF motif in the insulator region in T cells targeted for CRISPR-based deletion. sgRNA targeting sequence within the CTCF motif is highlighted. Sequencing of sgRNA target site indicates various indels along with frequencies observed for each indel.
C) CTCF ChIP-qPCR validation of reduced CTCF binding in edited T cells compared to unedited T cells (n = 2 replicates).
D) qPCR comparing MYC expression in edited T cells compared to unedited T cells (n = 3 replicates). Statistical significance was determined using unpaired two-sided t test. Error bars indicate s.d.; center value indicates mean.
E) 4C-seq analysis using MYC promoter as viewpoint in edited and unedited T cells. Positive y-axis shows interactions with the viewpoint as normalized read counts, negative y-axis shows significance of differential interactions between the two samples as log10(P value) calculated with edgeR function glmQLFTest. Tracks below show CTCF ChIP-seq in CUTLL1 and H3K27ac ChIP-seq in naïve T cells and CUTLL1 as fold-enrichment over input. Number replicates: T cells WT 4C n = 2; T cells Edited 4C n = 2; T cells CTCF n = 2; T cells H3K27ac n = 2; CUTLL1 H3K27ac n = 2.
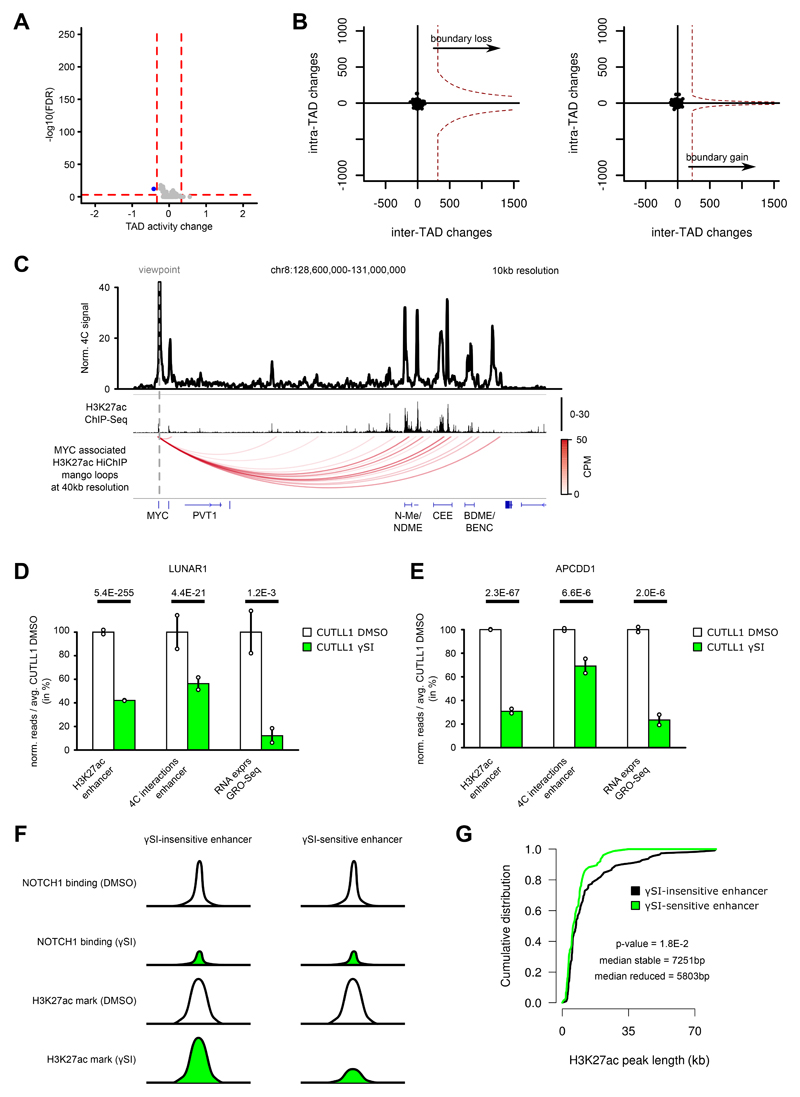
Extended Data Fig. 8. Genome-wide Hi-C analysis in T-ALL following γSI shows no intra-TAD activity differences, but individual promoter-enhancer loops are disrupted.
A) Volcano plot showing differential intra-TAD activity between CUTLL1 DMSO vs CUTLL1 γSI (average activity > 0.58 / < -0.58 and with FDR < 0.05). Statistical evaluation was performed using paired two-sided t test between all per bin-interactions between DMSO and γSI (n = 2 replicates).
B) Representation of TAD boundary alteration events (red dots; none identified). Plots depict pair-wise comparisons for TAD boundary losses of adjacent CUTLL1 (untreated, left) TADs and for TAD boundary gains of adjacent CUTLL1 (γSI treated, right) TADs. Dotted line represents outlier threshold as in Figure 3 C) and D).
C) Virtual 4C of H3K27ac HiChIP in CUTLL1, using MYC promoter as viewpoint (chr8: 128,747,680), showing edgeR-normalized CPM. H3K27ac ChIP-seq track for MYC locus shown as fold-enrichment over input. Detected significant loops as arc-representation (below) from mango pipeline utilizing two-sided binomial test per matrix-diagonal followed by multiple testing correction 63 (FDR<0.1; CPM>5). Number replicates: CUTLL1 H3K27ac HiChIP n = 1; CUTLL1 H3K27ac ChIP-seq n = 2.
D) H3K27ac signal (enrichment over input) (left), chromatin interaction of the highest peak by 4C-seq (center) for the interaction of LUNAR1 promoter with its upstream enhancer and LUNAR1 expression (right). All quantifications are normalized to the respective average T cell signal, shown in percent. Significance of differences was calculated using diffBind with edgeR-method (for H3K27ac ChIP-seq, FDR) and edgeR (for 4C-seq interactions and GRO-seq as P value and FDR respectively). Error bars indicate s.d.; center value indicates mean. Number replicates: CUTLL1 DMSO H3K27ac n = 2; CUTLL1 γSI H3K27ac n = 2; CUTLL1 DMSO 4C n = 2; CUTLL1 γSI 4C n = 2; CUTLL1 DMSO GRO-seq n = 2; CUTLL1 γSI GRO-seq n = 2.
E) H3K27ac signal (left), chromatin interaction of the highest peak by 4C-seq (center) for the interaction of APCDD1 enhancer with the downstream APCDD1 promoter and APCDD1 expression (right). All quantifications are normalized to the respective average T cell signal, shown in percent. Significance of differences was calculated using diffBind with edgeR-method (for H3K27ac ChIP-seq, FDR) and edgeR (for 4C-seq interactions and GRO-seq as P value and FDR respectively). Error bars indicate s.d.; center value indicates mean. Number replicates: CUTLL1 DMSO H3K27ac n = 2; CUTLL1 γSI H3K27ac n = 2; CUTLL1 DMSO 4C n = 2; CUTLL1 γSI 4C n = 2; CUTLL1 DMSO GRO-seq n = 2; CUTLL1 γSI GRO-seq n = 2.
F) Schematic of γSI sensitive and insensitive enhancer.
G) Peak width of stable (black; n = 111) or decreased H3K27ac signal (green, n = 76) as defined in Figure 5A. Significant difference between the distributions is estimated by a two-sided Wilcoxon test. Number replicates: CUTLL1 DMSO H3K27ac n = 2; CUTLL1 γSI H3K27ac n = 2.
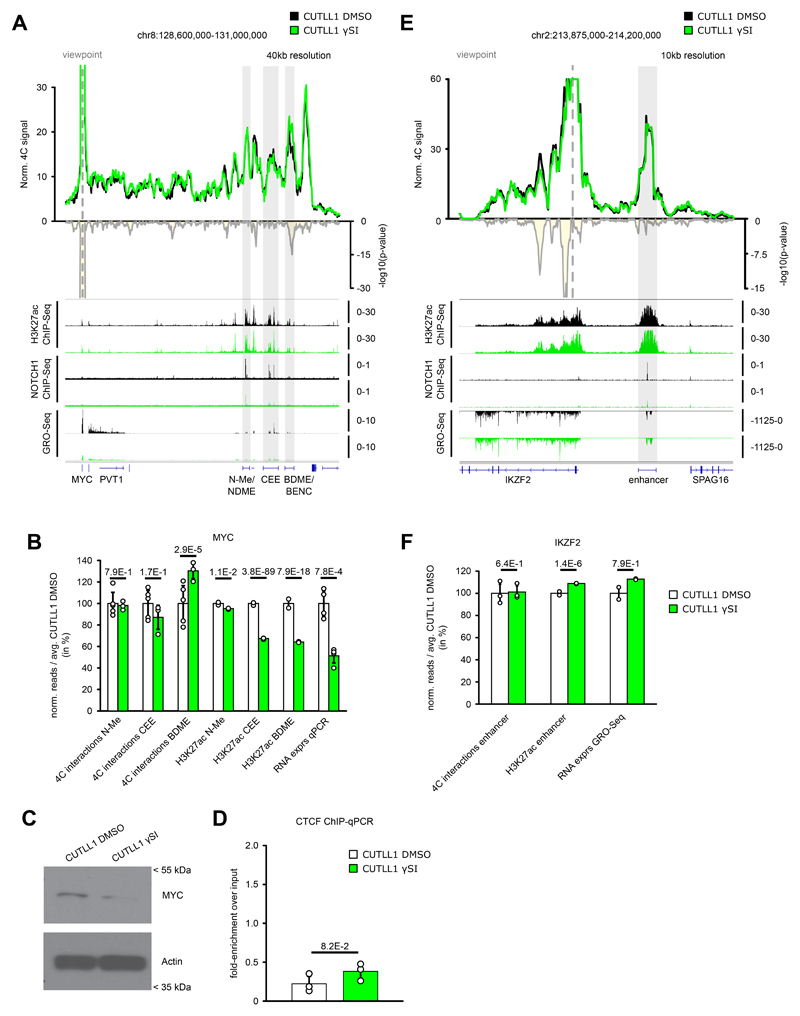
Extended Data Fig. 9. Treatment with γSI does not alter all NOTCH1 dynamic enhancers.
A) 4C-seq using MYC promoter as viewpoint. Positive y-axis shows interactions with viewpoint as normalized read counts, negative y-axis shows significance of differential interactions as log10(P value) calculated using edgeR function glmQLFTest (CUTLL1 DMSO n = 5; CUTLL1 γSI n = 3). Tracks below show H3K27ac, NOTCH1 ChIP-seq and GRO-seq (positive strand only) as fold-enrichment where applicable, and counts-per-million reads otherwise.
B) Quantification of H3K27ac signal (enrichment over input), chromatin interactions by 4C-seq for the interactions of MYC promoter and MYC expression Interaction changes are measured by centering the 40kb bin on highest peaks within N-Me/NDME, CEE or BDME/BENC elements. MYC expression was measured by qPCR. All quantifications are normalized to CUTLL1 DMSO, shown in percent. Error bars indicate s.d.; center value indicates mean. Significance is shown as false-discovery rate (FDR) for H3K72ac signal change (R package DiffBind with edgeR-method), P value for chromatin interaction change (edgeR function glmQLFTest) or one-tailored t test for qPCR changes.
C) Cropped western blot images immunoblotted with MYC antibody. Unprocessed western blots can be found as Source Data. Experiment was repeated twice with similar results.
D) CTCF ChIP-qPCR of lost MYC boundary upon γSI in CUTLL1 (n = 3). Error bars indicate s.d.; center value indicates mean. Significance was calculated using unpaired two-sided t test.
E) 4C-seq analysis using IKZF2 promoter as viewpoint after γSI treatment. Positive y-axis shows normalized read counts, negative y-axis shows significance of differential interactions as log10(P value) calculated using edgeR function glmQLFTest (CUTLL1 DMSO n = 3 ; CUTLL1 γSI n = 3). Tracks below show H3K27ac, NOTCH1 ChIP-seq and GRO-seq (negative strand only) as fold-enrichment over input where applicable, and counts-per-million reads otherwise.
F) H3K27ac signal is specific for enhancer highlighted in D). Interaction changes are measured by centering the 40kb bin on the highest enhancer peak. IKZF2 expression after γSI treatment was measured by GRO-seq. All quantifications are normalized to the average T cell signal, shown in percent. Error bars indicate s.d.; center value indicates mean. Significance is shown as false-discovery rate (FDR) for H3K72ac signal (R package DiffBind with edgeR-method), P value for chromatin interaction (edgeR function glmQLFTest) or one-tailored t test for qPCR expression.
Extended Data Fig. 10. Treatment of T-ALL with THZ1 reduces also γSI insensitive promoter-enhancer interactions.
A) H3K27ac signal is specific for N-Me/NDME, CEE and BDME/BENC. Interaction changes are measured by centering the 40kb bin on highest peaks within N-Me/NDME, CEE or BDME/BENC elements. MYC expression after THZ1 treatment was measured by qPCR. All quantifications are normalized to the average CUTLL1 DMSO signal, shown in percent. Error bars indicate s.d.; center value indicates mean. Significance is shown as false-discovery rate (FDR) for H3K72ac signal (R package DiffBind with edgeR-method), P value for chromatin interaction (edgeR function glmQLFTest) or two-sided t test for qPCR expression.
B) Cropped western blot images immunoblotted with MYC antibody. Unprocessed western blots can be found as Source Data. Experiment was repeated twice with similar results.
C) CTCF ChIP-qPCR, shown as enrichment over input, of CTCF site in lost boundary in MYC locus (n = 3). Error bars indicate s.d.; center value indicates mean. Significance was calculated using unpaired two-sided t test.
D) Inter-probe distance between MYC promoter and MYC-CCE measured by DNA-FISH analysis. Statistical difference between distributions of probe distances was calculated using two-sample one-sided Kolmogorov Smirnov test. Error bars indicate s.d.; center value indicates median. Probe-pairs CUTLL1 DMSO = 2001. Probe-pairs CUTLL1 THZ1 = 1308. Median distance CUTLL1 DMSO = 264.28μm. Median distance CUTLL1 THZ1 = 321.69μm.
E) 4C-seq using MYC promoter as viewpoint in Jurkat cells. Positive y-axis shows normalized interaction strength with the viewpoint, negative y-axis shows significance of differential interactions as log10(P value) calculated using edgeR function glmQLFTest (n = 3).
F) Interaction changes are measured by centering the 40kb bin on N-Me/NDME, CEE or the BDME/BENC. Error bars indicate s.d.; center value indicates mean. Significance is shown as P value for chromatin interaction changes (edgeR function glmQLFTest).
G) Quantification of changes in H3K27ac signal (enrichment over input) and chromatin interactions of IKZF2 enhancer in CUTLL1. All quantifications are normalized to the average CUTLL1 DMSO signal, shown in percent. Error bars indicate s.d.; center value indicates mean. Significance is shown as false-discovery rate (FDR) for H3K72ac signal change (R package DiffBind with edgeR-method), P value for chromatin interaction change (edgeR function glmQLFTest).
Supplementary Material
Acknowledgements
We thank all members of the Aifantis/Tsirigos laboratories for discussions throughout this project. A. Heguy and the NYU Genome Technology Center (supported in part by National Institutes of Health (NIH)/National Cancer Institute (NCI) grant P30CA016087-30) for expertise with sequencing experiments; the NYU Flow Cytometry facility for expert cell sorting; the Applied Bioinformatics Laboratory for computational assistance; Genewiz for expertise with sequencing experiments. This work has used computing resources at the High-Performance Computing Facility at the NYU Medical Center. We would also like to acknowledge Bing Ren and Anthony Schmitt for the support on the Hi-C experiments. I.A. is supported by the NCI/NIH (1P01CA229086, 1R01CA228135, R01CA216421, R01CA202025, R01CA133379, R01CA149655, 1R01CA194923), the Alex’s Lemonade Stand Cancer Research Foundation, the Chemotherapy Foundation, The Leukemia and Lymphoma Society and the NYSTEM program of the New York State Health Department (NYSTEM). A.T. is supported by the American Cancer Society (RSG-15-189-01-RMC), the NCI/NIH (1P01CA229086) the Leukemia and Lymphoma Society and the St. Baldrick’s Foundation. P.T. was previously supported by an AACR Incyte Corporation Leukemia Research Fellowship and is currently supported by a Young Investigator Grant from Alex’s Lemonade Stand Cancer Research Foundation. P.N. was supported by the NCI (R00CA188293), the American Society of Hematology, the Zell Foundation, the H Foundation and an U54CA193419 grant (NCI and the Chicago Region Physical Sciences-Oncology Center (CR-PSOC)). P.V.V. was supported by an ERC Starting Grant (639784). T.L. is supported by the NIGMS/NIH (R01GM127538). F.B. is supported by a Young Investigator Grant from Alex’s Lemonade Stand Cancer Research Foundation. S.N. was supported by the Onassis Foundation - Scholarship ID: F ZP 036-1/2019-2020.
Footnotes
Data Availability
All sequencing data created within this study were uploaded to NCBI GEO (https://www.ncbi.nlm.nih.gov/geo/) and are available under the accession GSE115896. All code for Hi-C analysis is available within the previously published Hi-C bench platform (https://github.com/NYU-BFX). Biological material used within this study can be obtained from the authors upon request.
Author Contributions
A.T. and I.A. conceived, designed and supervised the study with input from A.K., P.T. and P.N. A.K. designed and performed most of the computational analyses with help from A.T., S.N. and C.L. P.T. and P.N. designed and performed most of the experiments with help from Y.G. X.C., H.H., S.B., J.W., T.T., Y.F., F.B., Y.Z., E.P., P.V.V., G.G.I. and T.L.. P.T., P.N. and Y.G. performed Hi-C, HiChIP and 4C experiments with help from X.C., S.B., J.W. and Y.Z.. P.T. performed DNA FISH with help from Y.F. and T.L. P.T. performed ChIP-seq with help from P.N., S.B. and J.W.. P.T. and H.H. performed RNA-seq. T.T. performed GRO-seq. A.T., I.A. A.K. and P.T. wrote the manuscript with input from all authors.
Competing Financial Interests
A.T. is a Scientific Advisor to Intelligencia.AI. All other authors declare that they have no competing financial interests.
References
- 1.Lupiáñez Darío G, et al. Disruptions of Topological Chromatin Domains Cause Pathogenic Rewiring of Gene-Enhancer Interactions. Cell. 161:1012–1025. doi: 10.1016/j.cell.2015.04.004. [DOI] [PMC free article] [PubMed] [Google Scholar]
- 2.Flavahan WA, et al. Insulator dysfunction and oncogene activation in IDH mutant gliomas. Nature. 2016;529:110–4. doi: 10.1038/nature16490. [DOI] [PMC free article] [PubMed] [Google Scholar]
- 3.Spielmann M, Lupianez DG, Mundlos S. Structural variation in the 3D genome. Nat Rev Genet. 2018 doi: 10.1038/s41576-018-0007-0. [DOI] [PubMed] [Google Scholar]
- 4.Dekker J, Mirny L. The 3D Genome as Moderator of Chromosomal Communication. Cell. 2016;164:1110–1121. doi: 10.1016/j.cell.2016.02.007. [DOI] [PMC free article] [PubMed] [Google Scholar]
- 5.Lieberman-Aiden E, et al. Comprehensive mapping of long-range interactions reveals folding principles of the human genome. Science. 2009;326 doi: 10.1126/science.1181369. [DOI] [PMC free article] [PubMed] [Google Scholar]
- 6.Dixon JR, et al. Topological domains in mammalian genomes identified by analysis of chromatin interactions. Nature. 2012;485 doi: 10.1038/nature11082. [DOI] [PMC free article] [PubMed] [Google Scholar]
- 7.Nora EP, et al. Spatial partitioning of the regulatory landscape of the X-inactivation centre. 2012;485:381. doi: 10.1038/nature11049. [DOI] [PMC free article] [PubMed] [Google Scholar]
- 8.Hnisz D, et al. Super-enhancers in the control of cell identity and disease. Cell. 2013;155:934–47. doi: 10.1016/j.cell.2013.09.053. [DOI] [PMC free article] [PubMed] [Google Scholar]
- 9.Whyte WA, et al. Master transcription factors and mediator establish super-enhancers at key cell identity genes. Cell. 2013;153:307–19. doi: 10.1016/j.cell.2013.03.035. [DOI] [PMC free article] [PubMed] [Google Scholar]
- 10.Gong Y, et al. Stratification of TAD boundaries reveals preferential insulation of super-enhancers by strong boundaries. Nature Communications. 2018;9 doi: 10.1038/s41467-018-03017-1. 542. [DOI] [PMC free article] [PubMed] [Google Scholar]
- 11.Ong CT, Corces VG. CTCF: an architectural protein bridging genome topology and function. Nat Rev Genet. 2014;15:234–46. doi: 10.1038/nrg3663. [DOI] [PMC free article] [PubMed] [Google Scholar]
- 12.Hnisz D, Day DS, Young RA. Insulated Neighborhoods: Structural and Functional Units of Mammalian Gene Control. Cell. 2016;167:1188–1200. doi: 10.1016/j.cell.2016.10.024. [DOI] [PMC free article] [PubMed] [Google Scholar]
- 13.Nora EP, et al. Targeted Degradation of CTCF Decouples Local Insulation of Chromosome Domains from Genomic Compartmentalization. Cell. 169:930–944.e22. doi: 10.1016/j.cell.2017.05.004. [DOI] [PMC free article] [PubMed] [Google Scholar]
- 14.Rao SSP, et al. Cohesin Loss Eliminates All Loop Domains. Cell. 2017;171:305–320.e24. doi: 10.1016/j.cell.2017.09.026. [DOI] [PMC free article] [PubMed] [Google Scholar]
- 15.Guo Y, et al. CRISPR Inversion of CTCF Sites Alters Genome Topology and Enhancer/Promoter Function. Cell. 2015;162:900–10. doi: 10.1016/j.cell.2015.07.038. [DOI] [PMC free article] [PubMed] [Google Scholar]
- 16.Narendra V, et al. CTCF establishes discrete functional chromatin domains at the Hox clusters during differentiation. Science. 2015;347:1017–21. doi: 10.1126/science.1262088. [DOI] [PMC free article] [PubMed] [Google Scholar]
- 17.Weischenfeldt J, et al. Pan-cancer analysis of somatic copy-number alterations implicates IRS4 and IGF2 in enhancer hijacking. Nat Genet. 2017;49:65–74. doi: 10.1038/ng.3722. [DOI] [PMC free article] [PubMed] [Google Scholar]
- 18.Petrovic J, et al. Oncogenic Notch Promotes Long-Range Regulatory Interactions within Hyperconnected 3D Cliques. Mol Cell. 2019;73:1174–1190.e12. doi: 10.1016/j.molcel.2019.01.006. [DOI] [PMC free article] [PubMed] [Google Scholar]
- 19.Grabher C, von Boehmer H, Look AT. Notch 1 activation in the molecular pathogenesis of T-cell acute lymphoblastic leukaemia. Nat Rev Cancer. 2006;6:347–59. doi: 10.1038/nrc1880. [DOI] [PubMed] [Google Scholar]
- 20.Belver L, Ferrando A. The genetics and mechanisms of T cell acute lymphoblastic leukaemia. Nat Rev Cancer. 2016;16:494–507. doi: 10.1038/nrc.2016.63. [DOI] [PubMed] [Google Scholar]
- 21.Wang H, et al. NOTCH1–RBPJ complexes drive target gene expression through dynamic interactions with superenhancers. Proceedings of the National Academy of Sciences. 2014;111:705–710. doi: 10.1073/pnas.1315023111. [DOI] [PMC free article] [PubMed] [Google Scholar]
- 22.Hunger SP, Mullighan CG. Acute Lymphoblastic Leukemia in Children. New England Journal of Medicine. 2015;373:1541–1552. doi: 10.1056/NEJMra1400972. [DOI] [PubMed] [Google Scholar]
- 23.Weng AP, et al. Activating mutations of NOTCH1 in human T cell acute lymphoblastic leukemia. Science. 2004;306:269–71. doi: 10.1126/science.1102160. [DOI] [PubMed] [Google Scholar]
- 24.Liu Y, et al. The genomic landscape of pediatric and young adult T-lineage acute lymphoblastic leukemia. 2017;49:1211. doi: 10.1038/ng.3909. [DOI] [PMC free article] [PubMed] [Google Scholar]
- 25.Coustan-Smith E, et al. Early T-cell precursor leukaemia: a subtype of very high-risk acute lymphoblastic leukaemia. Lancet Oncol. 2009;10:147–56. doi: 10.1016/S1470-2045(08)70314-0. [DOI] [PMC free article] [PubMed] [Google Scholar]
- 26.Zhang J, et al. The genetic basis of early T-cell precursor acute lymphoblastic leukaemia. 2012;481:157. doi: 10.1038/nature10725. [DOI] [PMC free article] [PubMed] [Google Scholar]
- 27.Palomero T, et al. CUTLL1, a novel human T-cell lymphoma cell line with t(7;9) rearrangement, aberrant NOTCH1 activation and high sensitivity to gamma-secretase inhibitors. Leukemia. 2006;20:1279–87. doi: 10.1038/sj.leu.2404258. [DOI] [PubMed] [Google Scholar]
- 28.Sulis ML, et al. NOTCH1 extracellular juxtamembrane expansion mutations in T-ALL. Blood. 2008;112:733–40. doi: 10.1182/blood-2007-12-130096. [DOI] [PMC free article] [PubMed] [Google Scholar]
- 29.Lazaris C, Kelly S, Ntziachristos P, Aifantis I, Tsirigos A. HiC-bench: comprehensive and reproducible Hi-C data analysis designed for parameter exploration and benchmarking. BMC genomics. 2017;18:22. doi: 10.1186/s12864-016-3387-6. [DOI] [PMC free article] [PubMed] [Google Scholar]
- 30.Kourtis N, et al. Oncogenic hijacking of the stress response machinery in T cell acute lymphoblastic leukemia. Nat Med. 2018;24:1157–1166. doi: 10.1038/s41591-018-0105-8. [DOI] [PMC free article] [PubMed] [Google Scholar]
- 31.Yang T, et al. HiCRep: assessing the reproducibility of Hi-C data using a stratum-adjusted correlation coefficient. Genome Research. 2017;27:1939–1949. doi: 10.1101/gr.220640.117. [DOI] [PMC free article] [PubMed] [Google Scholar]
- 32.Zhang Z, et al. Expression of a non-DNA-binding isoform of Helios induces T-cell lymphoma in mice. Blood. 2007;109:2190–7. doi: 10.1182/blood-2005-01-031930. [DOI] [PMC free article] [PubMed] [Google Scholar]
- 33.Vilimas T, et al. Targeting the NF-kappaB signaling pathway in Notch1-induced T-cell leukemia. Nat Med. 2007;13:70–7. doi: 10.1038/nm1524. [DOI] [PubMed] [Google Scholar]
- 34.Espinosa L, et al. The Notch/Hes1 pathway sustains NF-kappaB activation through CYLD repression in T cell leukemia. Cancer Cell. 2010;18:268–81. doi: 10.1016/j.ccr.2010.08.006. [DOI] [PMC free article] [PubMed] [Google Scholar]
- 35.Weng AP, et al. c-Myc is an important direct target of Notch1 in T-cell acute lymphoblastic leukemia/lymphoma. Genes Dev. 2006;20:2096–109. doi: 10.1101/gad.1450406. [DOI] [PMC free article] [PubMed] [Google Scholar]
- 36.Palomero T, et al. NOTCH1 directly regulates c-MYC and activates a feed-forward-loop transcriptional network promoting leukemic cell growth. Proc Natl Acad Sci U S A. 2006;103:18261–6. doi: 10.1073/pnas.0606108103. [DOI] [PMC free article] [PubMed] [Google Scholar]
- 37.Herranz D, et al. A NOTCH1-driven MYC enhancer promotes T cell development, transformation and acute lymphoblastic leukemia. Nat Med. 2014;20:1130–1137. doi: 10.1038/nm.3665. [DOI] [PMC free article] [PubMed] [Google Scholar]
- 38.Yashiro-Ohtani Y, et al. Long-range enhancer activity determines Myc sensitivity to Notch inhibitors in T cell leukemia. Proc Natl Acad Sci U S A. 2014;111:E4946–53. doi: 10.1073/pnas.1407079111. [DOI] [PMC free article] [PubMed] [Google Scholar]
- 39.Shi J, et al. Role of SWI/SNF in acute leukemia maintenance and enhancer-mediated Myc regulation. Genes & Development. 2013;27:2648–2662. doi: 10.1101/gad.232710.113. [DOI] [PMC free article] [PubMed] [Google Scholar]
- 40.Bahr C, et al. A Myc enhancer cluster regulates normal and leukaemic haematopoietic stem cell hierarchies. Nature. 2018;553:515–520. doi: 10.1038/nature25193. [DOI] [PubMed] [Google Scholar]
- 41.Deangelo DJ, et al. A phase I clinical trial of the notch inhibitor MK-0752 in patients with T-cell acute lymphoblastic leukemia/lymphoma (T-ALL) and other leukemias. Journal of Clinical Oncology. 2006;24 6585-6585. [Google Scholar]
- 42.Mumbach MR, et al. HiChIP: efficient and sensitive analysis of protein-directed genome architecture. Nature Methods. 2016;13:919. doi: 10.1038/nmeth.3999. [DOI] [PMC free article] [PubMed] [Google Scholar]
- 43.Delmore Jake E, et al. BET Bromodomain Inhibition as a Therapeutic Strategy to Target c-Myc. Cell. 2011;146:904–917. doi: 10.1016/j.cell.2011.08.017. [DOI] [PMC free article] [PubMed] [Google Scholar]
- 44.Trimarchi T, et al. Genome-wide Mapping and Characterization of Notch-Regulated Long Noncoding RNAs in Acute Leukemia. Cell. 158:593–606. doi: 10.1016/j.cell.2014.05.049. [DOI] [PMC free article] [PubMed] [Google Scholar]
- 45.Medyouf H, et al. High-level IGF1R expression is required for leukemia-initiating cell activity in T-ALL and is supported by Notch signaling. J Exp Med. 2011;208:1809–22. doi: 10.1084/jem.20110121. [DOI] [PMC free article] [PubMed] [Google Scholar]
- 46.Sheffield NC, Bock C. LOLA: enrichment analysis for genomic region sets and regulatory elements in R and Bioconductor. Bioinformatics. 2015;32:587–589. doi: 10.1093/bioinformatics/btv612. [DOI] [PMC free article] [PubMed] [Google Scholar]
- 47.Kwiatkowski N, et al. Targeting transcription regulation in cancer with a covalent CDK7 inhibitor. Nature. 2014;511:616–620. doi: 10.1038/nature13393. [DOI] [PMC free article] [PubMed] [Google Scholar]
- 48.Northcott PA, et al. Enhancer hijacking activates GFI1 family oncogenes in medulloblastoma. Nature. 2014;511:428–34. doi: 10.1038/nature13379. [DOI] [PMC free article] [PubMed] [Google Scholar]
- 49.Hnisz D, et al. Activation of proto-oncogenes by disruption of chromosome neighborhoods. Science. 2016;351:1454–1458. doi: 10.1126/science.aad9024. [DOI] [PMC free article] [PubMed] [Google Scholar]
- 50.Oomen ME, Hansen AS, Liu Y, Darzacq X, Dekker J. CTCF sites display cell cycle-dependent dynamics in factor binding and nucleosome positioning. Genome Res. 2019;29:236–249. doi: 10.1101/gr.241547.118. [DOI] [PMC free article] [PubMed] [Google Scholar]
- 51.Vian L, et al. The Energetics and Physiological Impact of Cohesin Extrusion. Cell. 2018;173:1165–1178.e20. doi: 10.1016/j.cell.2018.03.072. [DOI] [PMC free article] [PubMed] [Google Scholar]
- 52.King B, et al. The Ubiquitin Ligase FBXW7 Modulates Leukemia-Initiating Cell Activity by Regulating MYC Stability. Cell. 2013;153:1552–1566. doi: 10.1016/j.cell.2013.05.041. [DOI] [PMC free article] [PubMed] [Google Scholar]
- 53.Bonev B, et al. Multiscale 3D Genome Rewiring during Mouse Neural Development. Cell. 2017;171:557–572.e24. doi: 10.1016/j.cell.2017.09.043. [DOI] [PMC free article] [PubMed] [Google Scholar]
- 54.Dixon JR, et al. Chromatin architecture reorganization during stem cell differentiation. Nature. 2015;518:331–6. doi: 10.1038/nature14222. [DOI] [PMC free article] [PubMed] [Google Scholar]
- 55.Donaldson-Collier MC, et al. EZH2 oncogenic mutations drive epigenetic, transcriptional, and structural changes within chromatin domains. Nature Genetics. 2019;51:517–528. doi: 10.1038/s41588-018-0338-y. [DOI] [PubMed] [Google Scholar]
- 56.Bellavia D, Palermo R, Felli MP, Screpanti I, Checquolo S. Notch signaling as a therapeutic target for acute lymphoblastic leukemia. Expert Opinion on Therapeutic Targets. 2018;22:331–342. doi: 10.1080/14728222.2018.1451840. [DOI] [PubMed] [Google Scholar]
- 57.Siersbaek R, et al. Transcription factor cooperativity in early adipogenic hotspots and super-enhancers. Cell Rep. 2014;7:1443–1455. doi: 10.1016/j.celrep.2014.04.042. [DOI] [PubMed] [Google Scholar]
- 58.Larochelle S, et al. Cyclin-dependent kinase control of the initiation-to-elongation switch of RNA polymerase II. 2012;19:1108. doi: 10.1038/nsmb.2399. [DOI] [PMC free article] [PubMed] [Google Scholar]
- 59.Chipumuro E, et al. CDK7 Inhibition Suppresses Super-Enhancer-Linked Oncogenic Transcription in MYCN-Driven Cancer. Cell. 2014;159:1126–1139. doi: 10.1016/j.cell.2014.10.024. [DOI] [PMC free article] [PubMed] [Google Scholar]
- 60.Christensen CL, et al. Targeting transcriptional addictions in small cell lung cancer with a covalent CDK7 inhibitor. Cancer cell. 2014;26:909–922. doi: 10.1016/j.ccell.2014.10.019. [DOI] [PMC free article] [PubMed] [Google Scholar]
- 61.Ambrosini G, Groux R, Bucher P. PWMScan: a fast tool for scanning entire genomes with a position-specific weight matrix. Bioinformatics. 2018;34:2483–2484. doi: 10.1093/bioinformatics/bty127. [DOI] [PMC free article] [PubMed] [Google Scholar]
- 62.Ramirez F, et al. deepTools2: a next generation web server for deep-sequencing data analysis. Nucleic Acids Res. 2016;44:W160–5. doi: 10.1093/nar/gkw257. [DOI] [PMC free article] [PubMed] [Google Scholar]
- 63.Phanstiel DH, Boyle AP, Heidari N, Snyder MP. Mango: a bias-correcting ChIA-PET analysis pipeline. Bioinformatics. 2015;31:3092–8. doi: 10.1093/bioinformatics/btv336. [DOI] [PMC free article] [PubMed] [Google Scholar]
- 64.Pitt LA, et al. CXCL12-Producing Vascular Endothelial Niches Control Acute T Cell Leukemia Maintenance. Cancer Cell. 2015;27:755–68. doi: 10.1016/j.ccell.2015.05.002. [DOI] [PMC free article] [PubMed] [Google Scholar]
- 65.Rao SSP, et al. A 3D Map of the human genome at kilobase resolution reveals principles of chromatin looping. Cell. 2014;159 doi: 10.1016/j.cell.2014.11.021. [DOI] [PMC free article] [PubMed] [Google Scholar]
- 66.Strikoudis A, et al. Regulation of transcriptional elongation in pluripotency and cell differentiation by the PHD-finger protein Phf5a. Nat Cell Biol. 2016;18:1127–1138. doi: 10.1038/ncb3424. [DOI] [PMC free article] [PubMed] [Google Scholar]
Associated Data
This section collects any data citations, data availability statements, or supplementary materials included in this article.


