

ABSTRACT
Background
Accurate and reliable methods to assess prevalence of use of and nutrient intakes from dietary supplements (DSs) are critical for research, clinical practice, and public health monitoring. NHANES has been the primary source of DS usage patterns using an in-home inventory with a frequency-based DS and Prescription Medicine Questionnaire (DSMQ), but little is known regarding DS information obtained from 24-h dietary recalls (24HRs).
Methods
The objectives of this analysis were to compare results from 4 different methods for measuring DS use constructed from two data collection instruments (i.e., DSMQ and 24HR) and to determine the most comprehensive method for measuring the prevalence of use and estimating nutrient intakes from DS for selected nutrients. NHANES 2011–2014 data from US adults (aged ≥19 y; n = 11,451) were used to examine the 4 combinations of methods constructed for measuring the prevalence of use of and amount of selected nutrients from DSs (i.e., riboflavin, vitamin D, folate, magnesium, calcium): 1) DSMQ, 2) 24HR day 1, 3) two 24HRs (i.e., mean), and 4) DSMQ or at least one 24HR.
Results
Half of US adults reported DS use on the DSMQ (52%) and on two 24HRs (mean of 49%), as compared with a lower prevalence of DS use when using a single 24HR (43%) and a higher (57%) prevalence when combining the DSMQ with at least one 24HR. Mean nutrient intake estimates were highest using 24HR day 1. Mean supplemental calcium from the DSMQ or at least one 24HR was 372 mg/d, but 464 mg/d on the 24HR only. For vitamin D, the estimated intakes per consumption day were higher on the DSMQ (46 μg) and the DSMQ or at least one 24HR (44 μg) than those on the 24HR day 1 (32 μg) or the mean 24HR (31 μg). Fewer products were also classed as a default or reasonable match on the DSMQ than on the 24HR.
Conclusions
A higher prevalence of use of DSs is obtained using frequency-based methods, whereas higher amounts of nutrients are reported from a 24HR. The home inventory results in greater accuracy for products reported. Collectively, these findings suggest that combining the DSMQ with at least one 24HR (i.e., DSMQ or at least one 24HR) is the most comprehensive method for assessing the prevalence of and estimating usual intake from DSs in US adults.
This trial was registered at clinicaltrials.gov as NCT03400436.
Keywords: NHANES, dietary supplement, measurement error, dietary recall, methodology
Introduction
Dietary supplement (DS) use in the United States is pervasive, with approximately half of US adults reporting routine DS consumption (1, 2). Although the NHANES has monitored DS use in the United States since the early 1970s (3), the best practices for measuring nutrient intakes from supplemental sources in that survey remain largely unknown (4). Little is known about the accuracy, reliability, and measurement error structure of DS assessment methods, which are likely to differ from those of food intake assessment methods (4). Dietary assessment instruments vary in their ability to estimate true intake with high precision and low bias (5–8). However, owing to the differences in consumption quantities and patterns between DSs and foods, this may not be the case when assessing nutrient intakes from supplements. Because some DSs contain nutrients in very high doses, estimating dietary exposures without inclusion of nutrients from DSs tends to severely underestimate total nutrient exposures (9–11).
The NHANES 2011–2014 includes data from multiple DS assessment methods to inform research and public health monitoring, allowing for the assessment of DS use and the comparison of nutrient intake estimates between these various assessments. Currently, the NHANES protocol includes both an in-home DS product inventory using a 30-d Dietary Supplement and Prescription Medicine Questionnaire (DSMQ) and two 24-h dietary recalls (24HRs) inclusive of DS use. Using data from the 2007–2010 NHANES, Nicastro et al. (12) concluded that the estimated prevalence of multivitamin-mineral (MVM) DS use in US adults is higher with the DSMQ than with the 24HR day 1, and that only 67% of MVM users reported intake on both instruments. Although MVMs are the most common DS product used in the United States (13), to our knowledge no other studies have compared different instruments for the prevalence of use of DS product types other than an MVM or for the amounts of nutrients reported from DSs. Therefore, the objectives of this analysis were to compare results from 4 different methods for measuring DS use constructed from 2 data collection instruments (i.e., DSMQ and 24HR) and to determine the most comprehensive method for measuring the prevalence of use of, and estimating nutrient intakes from, DSs for selected nutrients.
Methods
NHANES is a nationally representative, continuous cross-sectional survey of the noninstitutionalized civilian residents of the United States conducted by the CDC, National Center for Health Statistics (NCHS) that utilizes a complex, stratified, multistage probability cluster sampling design (14). The NHANES protocol includes an in-person household interview on self-reported health information and demographics as well as a follow-up health examination in a mobile examination center (MEC) for each participant. NHANES data are released as publicly available, 2-y data sets. Written informed consent is obtained for all participants or proxies, and the NHANES protocol is approved by the Research Ethics Review Board at NCHS. For this analysis, the most recent NHANES cycles available that collected DS intake data on both the 30-d DS frequency questionnaire and the 24HRs were combined (2011–2012 and 2013–2014) to form a sample of 19,151 participants. Participants who were <19 y of age, had incomplete or unreliable DSMQ data, or who were pregnant and/or lactating were excluded from this analysis, yielding a final nationally representative sample of 11,451 US adults for analytic sample 1. A subsample of NHANES participants who reported complete and reliable intakes on the 24HR day 1 were included in analytic sample 2, yielding an analytic sample size of 9954 US adults. Lastly, analytic sample 3 reflects a subsample of NHANES participants who reported complete and reliable intakes on the DSMQ and the day 1 and day 2 24HRs, resulting in an analytic sample of 8881 US adults. The exclusion criteria and analytic samples used in this analysis are outlined further in Figure 1.
FIGURE 1.
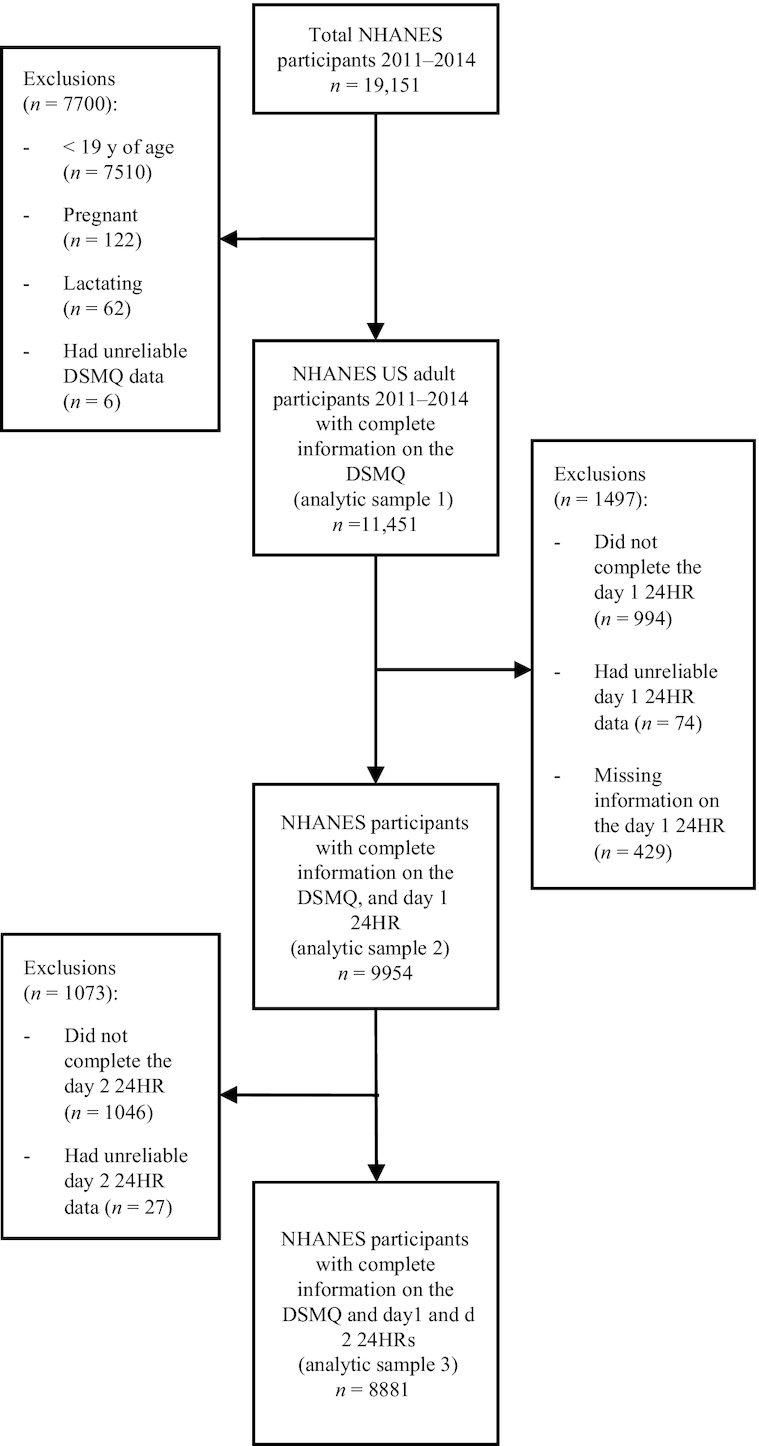
Flowchart of the exclusion criteria used to obtain the analytic samples used in this analysis of US adult participants in NHANES 2011–2014. DSMQ, Dietary Supplement and Prescription Medication Questionnaire; 24HR, 24-h dietary recall.
Detailed information on the NHANES DS component protocol can be found elsewhere (15, 16). DS use in the previous 30 d was collected via the DSMQ during the household interview using the Computer-Assisted Personal Interview system. Trained NHANES interviewers asked the participants about their use of vitamins, minerals, and other DSs. Participants were asked to show interviewers the containers for all products consumed in the past 30 d. For each DS reported, interviewers recorded from the label the name, manufacturer, form of the products, and amount per serving for selected nutrient products. Detailed information on the consumption frequency, dose, and duration of use was also collected for all products reported. Interviewers examined the containers for 83% of products reported (1). If containers were not available, participants were asked to recall in detail the product that they had consumed. NHANES nutritionists at the NCHS then matched products reported by participants to product labels obtained from several sources.
Approximately 3 wk after the in-home interview, during the visit to the MEC, an in-person 24HR was administered. A second 24HR was conducted via telephone ∼3–10 d later. Per NHANES protocol, one must complete the in-person 24HR day 1 in order to participate in the second follow-up 24HR via telephone. Both 24HRs were collected using the USDA's automated multiple-pass method (17, 18).
For the purposes of our analyses, a dichotomous match variable was created based on the certainty of the NHANES nutritionist matching a supplement recorded during the in-home product inventory to the actual product label, which classified matches as either an “exact/probable/generic match” or a “reasonable/default match.” Generic matches were combined with “exact” or “probable” matches because a generic match indicates that information on both the nutrient and dose of the DS is present, but the product name may be incomplete. However, it should be noted that NHANES protocol requires an automatic declaration of a generic match for any DS product sold in <25 states, regardless of whether an exact match was present or not, to ensure confidentiality.
We compared and evaluated estimates of prevalence of DS use and mean nutrient intakes from DSs among US adults using 4 different methods. For each method, the estimated mean intake per consumption day from DSs, the estimated mean nutrient intake, and the distribution of intake from DSs over all available days were calculated for participants who reported consumption of the nutrient (intake >0) on each respective method (i.e., DSMQ only, 24HR day 1 only, 24HR day 1 and day 2 mean, or DSMQ or at least one 24HR). The estimated mean intake per consumption day from DSs reflects the amount the participant reported taking on a consumption day, whereas the estimated mean nutrient intake from DSs incorporates the amount reported consumed per day by the participant, multiplied by the reported frequency of DS use.
Estimated mean nutrient intake from DSs for each of the 4 methods was calculated as follows (Box 1): 1) DSMQ only—DS intakes reported on the DSMQ/in-home inventory only, where the mean nutrient intake among users was calculated using the total number of reported days of DS use over the past 30 d, multiplied by the amount the participant reported taking per day; 2) 24HR day 1 only—DS intakes reported on the 24HR day 1 only, where the mean nutrient intake among users was calculated using the amount the participant reported taking on that day; 3) 24HR day 1 and day 2 mean—the mean of DS intakes reported on the day 1 and day 2 24HRs, where the mean nutrient intake among users was calculated by taking the mean of the amounts reported by the participant on all available 24HRs; 4) DSMQ or at least one 24HR—if DS intakes were reported on the DSMQ in-home inventory, then the mean nutrient intake among users was calculated using the total number of reported days of DS use over the past 30 d, multiplied by the amount the participant reported taking per day. However, if DS intakes were not reported on the DSMQ in-home inventory, but were reported on at least one 24HR, then the mean of DS intakes reported on the day 1 and day 2 24HRs was used, where the mean nutrient intake among users was calculated by taking the mean of the amounts reported by the participant on all available 24HRs as in method 3.
Box 1.
Description of methods used for the calculation of prevalence estimates of DS use and mean nutrient intakes from DSs, NHANES 2011–20141
| Method | Calculation of prevalence of DS use | Calculation of mean nutrient intake from DSs |
|---|---|---|
| Method #1: DSMQ only | If the participant responded to the question “Have you used or taken any vitamins, minerals or other dietary supplements in the past 30 days?” on the DSMQ/in-home inventory only. | Mean nutrient intake from DSs among users was calculated using the total number of reported days of DS use over the past 30 d, multiplied by the amount the participant reported consuming per day. |
| Method #2: 24HR day 1 only | If the participant responded to the question “Any Dietary Supplements taken in the past 24 hours?” on the 24HR day 1 only. | Mean nutrient intake from DSs among users was calculated using the amount the participant reported consuming on that day. |
| Method #3: 24HR day 1 and day 2 mean | If the participant responded to the question “Any Dietary Supplements taken in the past 24 hours?” on at least one 24HR. | Mean nutrient intake from DSs among users was calculated by taking the mean of the amounts reported by the participant on all available 24HRs. |
| Method #4: DSMQ or at least one 24HR | If the participant responded to the question “Have you used or taken any vitamins, minerals or other dietary supplements in the past 30 days?” on the DSMQ/in-home inventory, only then were the DSMQ/in-home inventory intakes used. | If DS intakes were reported on the DSMQ in-home inventory, then mean nutrient intake from DSs among users was calculated using the total number of reported days of DS use over the past 30 d, multiplied by the amount the participant reported consuming per day as in method 1. |
| If DS intakes were not reported on the DSMQ in-home inventory, but the participant responded to the question “Any Dietary Supplements taken in the past 24 hours?” on at least one 24HR, then the intakes reported on at least one 24HR were used. | If DS intakes were not reported on the DSMQ in-home inventory, but were reported on at least one 24HR, then the mean nutrient intake from DS among users was calculated by taking the mean of the amounts reported by the participant on all available 24HRs as in method 3. |
DS, dietary supplement; DSMQ, Dietary Supplement and Prescription Medication Questionnaire; 24HR, 24-h dietary recall.
Exclusive DS product type categories were constructed for each nutrient in question to examine DS use among users, including MVMs, multivitamins (MVs), multiminerals (MMs), calcium and vitamin D products, single-vitamin DSs (i.e., riboflavin, vitamin D, folate), and single-mineral (i.e., magnesium, calcium) DSs. Prevalence estimates of these broad, mutually exclusive supplement categories were adapted from Bailey et al. (19) and Gahche et al. (20), and were constructed based on nutrient content and/or descriptive characteristics commonly used in marketing (Box 2). MVMs were defined as products containing ≥3 vitamins and ≥1 mineral per supplement (10). MVs were defined as vitamin combinations containing ≥2 vitamins without minerals (21), and MMs were defined as mineral combinations containing ≥2 minerals without vitamins. Calcium and vitamin D DSs were defined as any product containing both calcium and vitamin D as the primary ingredients. Lastly, single-vitamin or -mineral DSs were constructed based on whether the DS contained 1 single vitamin or mineral count, respectively (i.e., riboflavin, vitamin D, folate, magnesium, calcium), without the inclusion of any other nutrients. Certain product categories included in these definitions are not based on the NHANES ingredient count, but rather the NHANES variable “DSDSUPP,” nutrient content, and/or descriptive characteristics. However, it is important to note that although antacids were included in our analyses reflected in Table 1, legally these products are classified as over-the-counter medications rather than DSs, and they do not commonly follow the same usage patterns as DSs. Consequently, we excluded antacids from all subsequent analyses. Specific nutrient-level analyses were conducted for riboflavin, vitamin D, folate, magnesium, and calcium to provide examples of both water- and fat-soluble vitamins and minerals.
Box 2.
Classification system used to create dietary supplement categories, NHANES 2011–20141
| Mutually exclusive product category | Definition | Examples |
|---|---|---|
| MVM | Any product containing ≥3 vitamins and ≥1 mineral; may or may not contain herbals or botanicals. | Centrum Silver® |
| Multivitamin (MV) | Any product containing ≥2 vitamins without minerals; may or may not contain herbals or botanicals. | B-complex |
| Multimineral (MM) | Any product containing ≥2 minerals without vitamins; may or may not contain herbals or botanicals. | Magnesium and zinc |
| Calcium and vitamin D | Any product that contains both calcium and vitamin D as the primary ingredients, with or without other vitamins or minerals; not part of an MVM. | Caltrate Bone Health® |
| Riboflavin2 | Any product that contains a single vitamin count of riboflavin without other nutrients. | Riboflavin single-nutrient DS |
| Vitamin D2 | Any product that contains a single vitamin count of vitamin D without other nutrients. | Vitamin D single-nutrient DS |
| Folate2 | Any product that contains a single vitamin count of folate without other nutrients. | Folate single-nutrient DS |
| Magnesium2 | Any product that contains a single mineral count of magnesium without other nutrients. | Magnesium single-nutrient DS |
| Calcium2 | Any product that contains a single mineral count of calcium without other nutrients. | Calcium single-nutrient DS |
| Antacid3 | Any product containing an antacid with or without other minerals or vitamins; not an MVM. This category also includes antacid products with calcium as the primary ingredient and is identified by the NHANES variable “DSDSUPP” containing the terms: “ANTACID, MYLANTA, TUMS, or MAALOX.” | Mylanta®, Tums®, Maalox® |
Vitamin counts are identified by the NHANES variable “DSDCNTV.” Mineral counts are identified by the NHANES variable “DSDCNTM.” DS, dietary supplement; MVM, multivitamin-mineral.
Certain product categories included in this definition are not based on the NHANES ingredient count, but rather the NHANES variable “DSDSUPP,” nutrient content, and/or descriptive characteristics commonly used in marketing.
An antacid is classified as over-the-counter medication, rather than a DS, by US law.
TABLE 1.
Estimated prevalence (%) of use of specified types of DSs and antacids among US adult (aged ≥19 y) supplement users, by method, NHANES 2011–20141
| DSMQ2 (n = 11,451) | 24HR day 13 (n = 9954) | 24HR mean3 (n = 9954) | DSMQ or at least one 24HR2 (n = 11,451) | |||||
|---|---|---|---|---|---|---|---|---|
| n | % | n | % | n | % | n | % | |
| Type of supplement | 5589 | 38094 | 44634,5 | 6150 | ||||
| MVM4 | 60.0 ± 0.9 | 57.8 ± 1.2 | 59.9 ± 1.2 | 61.0 ± 1.0 | ||||
| Multivitamin6 | 9.3 ± 0.7 | 9.0 ± 0.8 | 9.9 ± 0.8 | 10.1 ± 0.6 | ||||
| Multimineral6 | 3.7 ± 0.4 | 3.7 ± 0.5 | 4.1 ± 0.5 | 4.1 ± 0.4 | ||||
| Calcium and vitamin D7 | 12.2 ± 0.7 | 14.3 ± 1.0 | 14.9 ± 0.9 | 13.4 ± 0.7 | ||||
| Single vitamin | ||||||||
| Riboflavin | 0.03 ± 0.0 | 0.05 ± 0.0 | 0.04 ± 0.0 | 0.04 ± 0.0 | ||||
| Vitamin D | 23.2 ± 0.9 | 22.1 ± 1.2 | 23.3 ± 1.2 | 24.2 ± 1.0 | ||||
| Folate | 1.7 ± 0.2 | 1.8 ± 0.3 | 2.0 ± 0.3 | 1.9 ± 0.2 | ||||
| Single mineral | ||||||||
| Magnesium | 3.8 ± 0.4 | 3.3 ± 0.5 | 3.5 ± 0.5 | 3.9 ± 0.5 | ||||
| Calcium | 8.5 ± 0.5 | 8.2 ± 0.6 | 8.2 ± 0.5 | 9.2 ± 0.5 | ||||
| Antacid8 | 6041 | 22.3 ± 0.8 | 4000 | 1.3 ± 0.3 | 4671 | 1.5 ± 0.3 | 6635 | 20.7 ± 0.8 |
Unless otherwise indicated, values are n or means ± SEs. Estimated prevalence of DS use among DS users only. Estimated prevalence of DS use on the DSMQ, 24HR day 1, or 24HR day 2 was constructed based on whether the participant responded “yes” to the question “Have you used or taken any vitamins, minerals or other dietary supplements in the past 30 days?” or “All day yesterday, [day], between midnight and midnight, did [you/SP] take any vitamins, minerals, herbals or other dietary supplements?” respectively. DS, dietary supplement; DSMQ, Dietary Supplement and Prescription Medication Questionnaire; MVM, multivitamin-mineral; 24HR, 24-h dietary recall.
Analytic sample 1 as used in column 1 (i.e., DSMQ) and column 4 (i.e., DSMQ or at least one 24HR) includes individuals aged ≥19 y that were not pregnant or lactating with complete information for the DSMQ. NHANES interview weights were used for these analyses, yielding an overall analytic sample of 11,451 US adults.
Analytic sample 2 as used in column 2 (i.e., 24HR day 1) and column 3 (i.e., 24HR day 1 and day 2 mean) includes individuals aged ≥19 y that were not pregnant or lactating with complete information for the 24HR day 1. NHANES day 1 dietary weights were used for these analyses, yielding an overall analytic sample of 9954 US adults.
MVMs are categorized as DSs containing ≥3 vitamins and ≥1 mineral.
This sample population makes up 73.6% of the weighted sample population reflected in column 1 (i.e., DSMQ) and column 4 (i.e., DSMQ or at least one 24HR).
Multivitamins and multiminerals are categorized as non-MVM DS products containing ≥2 vitamins or minerals, respectively.
Calcium and vitamin D are categorized as non-MVM DS products containing calcium and vitamin D, which may contain other vitamins/minerals.
Antacids are classified as over-the-counter medications rather than DSs, by US law. Estimated prevalence of antacid use on the DSMQ, 24HR day 1, or 24HR day 2 was constructed based on whether the participant responded “yes” to the question “[Were] any antacids taken [in the past 30 days]?” or “All day yesterday, [day], between midnight and midnight did [you/SP] take any antacids?” respectively. Estimated prevalence of antacid use among DS and antacid users only.
Prevalence estimates and estimated mean intake distributions from DSs for each of the 4 methods were calculated using SAS software version 9.4 (SAS Institute Inc.). Analyses using analytic sample 1 were conducted using NHANES interview weights to account for differential nonresponse and noncoverage and to adjust for oversampling and poststratification, including analyses for intakes reported on the DSMQ, or the DSMQ or at least one 24HR. For analytic sample 2, NHANES day 1 dietary sample weights were used for intakes reported on the 24HR day 1, or 24HR day 1 and day 2 mean methods. However, analyses using analytic sample 3 (n = 8881) were conducted using the NHANES day 2 dietary recall sample weights across all 4 methods. Because our analytic sample 3 was limited to individuals who reported intakes on the DSMQ and the day 1 and day 2 24HRs, our estimates were reflective neither of the best method for analyzing all nationally available data nor of that for obtaining the best population-level estimate. However, use of the NHANES day 2 dietary recall sample weights still allowed for unbiased nationally representative estimates.
SEs for all statistics of interest were approximated using Taylor series linearization. Multiple comparisons were conducted using a pairwise t statistic to assess differences in prevalence estimates (Figure 2, Table 2) and mean nutrient intake across each of the 4 methods for the 5 nutrients examined (Table 3) (22). A Bonferroni-corrected P value of 0.0167 was considered statistically significant, unless otherwise noted.
FIGURE 2.
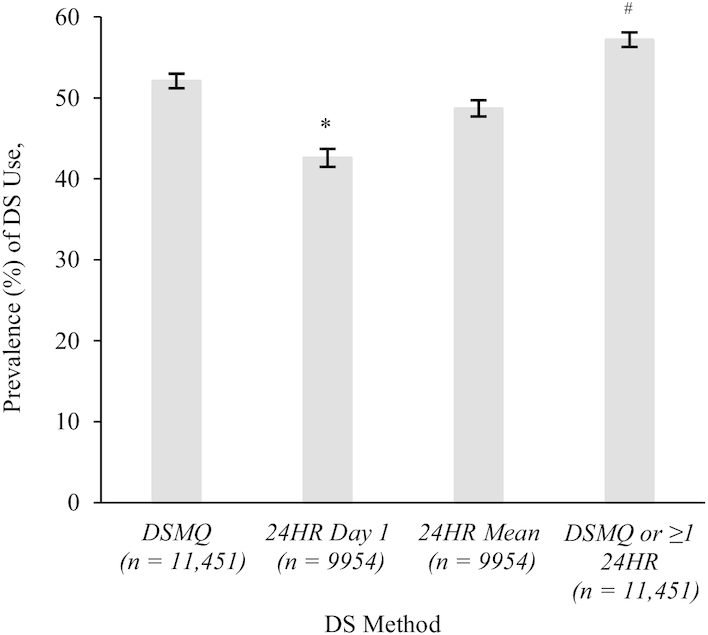
Estimated prevalence (%) of DS use among US adults (aged ≥19 y) by method, NHANES 2011–2014. Values are means. The error bars above each bar are indicative of the estimate ± SE. This sample population makes up 73.6% of the weighted sample population reflected in column 1 (i.e., DSMQ) and column 4 (i.e., DSMQ or at least one 24HR). Estimated prevalence of DS use on the DSMQ, 24HR day 1, or 24HR day 2 was constructed based on whether the participant responded “yes” to the question “Have you used or taken any vitamins, minerals or other dietary supplements in the past 30 days?” or “All day yesterday, [day], between midnight and midnight, did [you/SP] take any vitamins, minerals, herbals or other dietary supplements?” respectively. Analytic sample 1 as used in bar 1 (i.e., DSMQ) and bar 4 (i.e., DSMQ or at least one 24HR) includes individuals aged ≥19 y who were not pregnant or lactating with complete information for the DSMQ. NHANES interview weights were used for these analyses, yielding an overall analytic sample of 11,451 US adults. Analytic sample 2 as used in bar 2 (i.e., 24HR day 1) and bar 3 (i.e., 24HR day 1 and day 2 mean) includes individuals aged ≥19 y who were not pregnant or lactating with complete information for the 24HR day 1. NHANES day 1 dietary weights were used for these analyses, yielding an overall analytic sample of 9954 US adults. *Significant difference in estimated prevalence of DS use when compared with the estimated prevalence of use of the referent group (i.e., 24HR mean). #Significant difference in estimated prevalence of DS use when compared with the estimated prevalence of use of the referent group (i.e., DSMQ only). A P value < 0.05 was considered statistically significant. DS, dietary supplement; DSMQ, Dietary Supplement and Prescription Medication Questionnaire; 24HR, 24-h dietary recall.
TABLE 2.
Estimated percentages of US adult (aged ≥19 y) DS users in analytic sample 3 taking selected nutrients from any DS or an MVM, by method, NHANES 2011–20141
| Riboflavin, mg/d | Vitamin D, μg/d | Folate (DFE), μg/d | Magnesium, mg/d | Calcium, mg/d | ||||||
|---|---|---|---|---|---|---|---|---|---|---|
| n | % ± SE | n | % ± SE | n | % ± SE | n | % ± SE | n | % ± SE | |
| Any DS | ||||||||||
| DSMQ only | 2437 | 30.8 ± 0.9 | 3314 | 41.4 ± 1.1 | 2637 | 33.6 ± 1.0 | 2351 | 29.6 ± 0.9 | 2849 | 36.2 ± 1.1 |
| 24HR day 1 only | 1875 | 24.3 ± 0.9* | 2587 | 32.5 ± 1.1* | 2024 | 26.5 ± 1.0* | 1805 | 23.1 ± 0.9* | 2226 | 28.6 ± 1.1* |
| 24HR day 1 and day 2 mean | 2322 | 28.9 ± 0.8 | 3133 | 38.6 ± 1.0 | 2503 | 31.5 ± 0.9 | 2233 | 27.6 ± 0.9 | 2715 | 33.9 ± 1.0 |
| DSMQ or at least one 24HR | 2813 | 35.1 ± 0.9* | 3755 | 46.2 ± 1.1* | 3032 | 38.1 ± 1.0* | 2700 | 33.6 ± 1.0* | 3256 | 40.9 ± 1.1* |
| MVM2 | ||||||||||
| DSMQ only | 2291 | 28.8 ± 0.8 | 2414 | 30.7 ± 0.9 | 2451 | 31.1 ± 0.9 | 2161 | 27.1 ± 0.9 | 2290 | 28.7 ± 0.9 |
| 24HR day 1 only | 1755 | 22.6 ± 0.8* | 1836 | 23.9 ± 0.8* | 1864 | 24.3 ± 0.8* | 1659 | 21.4 ± 0.8* | 1756 | 22.6 ± 0.8* |
| 24HR day 1 and day 2 mean | 2175 | 26.9 ± 0.8 | 2271 | 28.6 ± 0.8 | 2311 | 29.1 ± 0.8 | 2056 | 25.5 ± 0.8 | 2170 | 27.0 ± 0.9 |
| DSMQ or at least one 24HR | 2628 | 32.6 ± 0.9* | 2698 | 33.9 ± 0.9 | 2796 | 35.1 ± 0.9* | 2477 | 30.7 ± 0.9* | 2590 | 32.3 ± 0.9* |
n = 8881. Unless otherwise indicated, values are means ± SEs. The estimates presented were obtained using analytic sample 3, and include individuals aged ≥19 y that were not pregnant or lactating with complete information for the DSMQ and at least one 24HR. DFE, dietary folate equivalents.
Significant difference in estimated prevalence of any DS or MVM use when compared with the estimated prevalence of any DS or MVM use, respectively, of the referent group (i.e., DSMQ only). A Bonferroni-corrected P value < 0.0167 was considered statistically significant. DFE, dietary folate equivalents; DS, dietary supplement; DSMQ, Dietary Supplement and Prescription Medication Questionnaire; MVM, multivitamin-mineral; 24HR, 24-h dietary recall.
MVMs are categorized as DSs containing ≥3 vitamins and ≥1 mineral.
TABLE 3.
Estimated distributions of mean nutrient intake and consumption day intake from DSs by nutrient of interest and by method, among US adult supplement users (aged ≥19 y) in analytic sample 3, NHANES 2011–20141
| Mean nutrient intake from DSs2 | Intake from DS percentiles | Mean intake per consumption day from DSs3 | ||||||
|---|---|---|---|---|---|---|---|---|
| n | 5th | 25th | 50th | 75th | 95th | |||
| Riboflavin, mg/d | ||||||||
| DSMQ only | 2437 | 7.3 ± 0.5 | 0.3 ± 0.0 | 1.3 ± 0.1 | 1.7 ± 0.1 | 5.0 ± 0.6 | 41.7 ± 3.1 | 9.2 ± 0.6 |
| 24HR day 1 only | 1875 | 8.9 ± 0.6 | 1.3 ± 0.2 | 1.7 ± 0.1 | 1.7 ± 0.1 | 5.1 ± 1.2 | 49.1 ± 5.9 | 8.9 ± 0.6 |
| 24HR day 1 and day 2 mean | 2322 | 7.8 ± 0.5 | 0.8 ± 0.1 | 1.7 ± 0.1 | 1.7 ± 0.1 | 5.1 ± 1.2 | 48.3 ± 4.8 | 9.1 ± 0.5 |
| DSMQ or at least one 24HR | 2813 | 7.3 ± 0.5 | 0.3 ± 0.0 | 1.1 ± 0.0 | 1.7 ± 0.1 | 4.3 ± 0.4 | 41.7 ± 3.0 | 9.2 ± 0.5 |
| Vitamin D, μg/d | ||||||||
| DSMQ only | 3314 | 27.9 ± 1.4 | 1.7 ± 0.2 | 10.0 ± 0.4 | 16.4 ± 0.8 | 30.0 ± 2.0 | 100.0 ± 13.3 | 46.3 ± 4.4 |
| 24HR day 1 only | 2587 | 32.1 ± 1.3 | 9.8 ± 0.9 | 10.0 ± 0.9 | 19.6 ± 0.4 | 34.8 ± 1.6 | 115.5 ± 10.6 | 32.1 ± 1.3 |
| 24HR day 1 and day 2 mean | 3133 | 27.3 ± 1.0 | 5.0 ± 0.4 | 10.0 ± 0.4 | 17.1 ± 1.2 | 29.5 ± 2.0 | 85.5 ± 13.1 | 31.1 ± 1.1 |
| DSMQ or at least one 24HR | 3755 | 26.9 ± 1.2 | 1.9 ± 0.2 | 10.0 ± 0.4 | 15.0 ± 1.0 | 25.0 ± 1.0 | 93.5 ± 13.2 | 44.0 ± 4.0 |
| Folate (DFE), μg/d | ||||||||
| DSMQ only | 2637 | 621.6 ± 16.0 | 67.7 ± 6.4 | 339.9 ± 22.2 | 678.3 ± 27.4 | 679.6 ± 27.4 | 1346.0 ± 77.4 | 773.3 ± 14.3 |
| 24HR day 1 only | 2024 | 766.7 ± 11.5* | 338.0 ± 27.9 | 678.4 ± 49.0 | 679.1 ± 49.0 | 679.9 ± 49.0 | 1357.0 ± 119.6 | 766.7 ± 11.5 |
| 24HR day 1 and day 2 mean | 2503 | 669.7 ± 11.2 | 224.6 ± 37.7 | 339.6 ± 27.9 | 678.7 ± 45.6 | 679.7 ± 45.6 | 1349.8 ± 80.3 | 768.4 ± 13.5 |
| DSMQ or at least one 24HR | 3032 | 614.6 ± 13.5 | 77.8 ± 13.8 | 339.9 ± 22.3 | 678.3 ± 27.4 | 679.6 ± 27.4 | 1345.1 ± 77.2 | 768.7 ± 12.5 |
| Magnesium, mg/d | ||||||||
| DSMQ only | 2351 | 89.7 ± 3.9 | 6.7 ± 0.8 | 33.3 ± 2.1 | 49.2 ± 1.7 | 99.2 ± 7.9 | 300.0 ± 19.4 | 112.3 ± 4.5 |
| 24HR day 1 only | 1805 | 104.2 ± 4.8 | 33.6 ± 3.7 | 49.7 ± 2.8 | 49.9 ± 2.8 | 119.8 ± 5.1 | 345.9 ± 36.9 | 104.2 ± 4.8 |
| 24HR day 1 and day 2 mean | 2233 | 92.1 ± 4.3 | 24.8 ± 1.4 | 48.1 ± 3.2 | 49.4 ± 3.2 | 98.6 ± 7.4 | 296.2 ± 29.8 | 104.6 ± 4.7 |
| DSMQ or at least one 24HR | 2700 | 87.3 ± 3.4 | 6.9 ± 0.8 | 33.3 ± 1.9 | 49.2 ± 1.7 | 99.0 ± 7.2 | 300.0 ± 28.4 | 109.9 ± 4.2 |
| Calcium, mg/d | ||||||||
| DSMQ only | 2849 | 378.6 ± 10.4 | 20.9 ± 3.1 | 125.7 ± 7.4 | 217.3 ± 1.9 | 528.4 ± 24.0 | 1189.5 ± 38.9 | 455.9 ± 11.2 |
| 24HR day 1 only | 2226 | 464.2 ± 11.7* | 82.7 ± 11.7 | 199.3 ± 9.4 | 249.5 ± 7.5 | 604.5 ± 13.2 | 1215.4 ± 60.9 | 464.2 ± 11.7 |
| 24HR day 1 and day 2 mean | 2715 | 409.5 ± 10.1 | 49.0 ± 4.6 | 161.9 ± 10.2 | 247.6 ± 7.3 | 592.0 ± 23.3 | 1191.9 ± 37.8 | 456.8 ± 10.9 |
| DSMQ or at least one 24HR | 3256 | 371.7 ± 8.5 | 20.9 ± 2.4 | 119.1 ± 7.3 | 216.8 ± 1.8 | 525.9 ± 20.6 | 1187.5 ± 37.7 | 447.4 ± 9.5 |
Unless otherwise indicated, values are means ± SEs. Analytic sample 3 (n = 8881) was used to produce the estimates, and is reflective of only nonpregnant, nonlactating US adults who reported DS intakes on the DSMQ and day 1 and day 2 24HRs. Estimates in this table reflect a winsorized distribution, where intakes above the 98th percentile or below the second percentile were winsorized to the next highest (98th percentile) or lowest (second percentile) value, respectively. *Significant difference in estimated mean nutrient intake when compared with the estimated mean nutrient intake of the referent group (i.e., DSMQ only). A Bonferroni-corrected P value < 0.0167 was considered statistically significant. DFE, dietary folate equivalents; DS, dietary supplement; DSMQ, Dietary Supplement and Prescription Medication Questionnaire; 24HR, 24-h dietary recall.
Estimated mean nutrient intake from DSs represents the reported amount consumed per day, when taking into account frequency of DS use.
Estimated mean intake per consumption day from DSs represents the reported amount consumed per day.
Owing to extreme values in the tails of some of the distributions of estimated mean nutrient intakes from DSs, the estimates presented reflect a winsorized distribution, where intakes above the 98th percentile or below the second percentile were winsorized to the next highest (98th percentile) or lowest (second percentile) value, respectively, to reduce their influence on the mean estimate.
Results
About half of US adults (52%) were estimated to take a DS during a given 30-d period as assessed by the DSMQ, whereas only 43% took a DS on a given day as assessed by the 24HR day 1, and 49% took a DS during a 2-d period as assessed by the mean of the day 1 and day 2 24HRs (Figure 2). When data from both the DSMQ and a 24HR were used, ∼57% of the US adult population took a DS. The prevalence of DS use, estimated only from those participants who did not report taking any DSs on the DSMQ, yet reported DSs on the 24HRs, was ∼9% (Supplemental Table 1).
Overall, patterns of DS use were consistent across all 4 methods. Among users, the most frequently used DSs were MVMs and single vitamin D products across all 4 methods, followed by calcium and vitamin D, MVs, and single calcium DSs (Table 1). These findings were similar even among those whose intakes were estimated only from 24HRs and not from the DSMQ. On a given day MM, calcium and vitamin D, and MV DSs were most commonly introduced as new products (Supplemental Table 1). In general, the prevalence of use for the majority of product types was lowest when estimated from the 24HR day 1 only, yet varied slightly by product class (Table 1). When estimated from the DSMQ only, most DS users mentioned taking an MVM (62%), MV (64%), MM (61%), calcium and vitamin D product (74%), single vitamin (68%), or single mineral (71%) every day (Supplemental Table 2).
The prevalence of use of antacids was significantly higher when estimated from the DSMQ only (22.3%) and the DSMQ or at least one 24HR (20.7%) than when estimated from the 24HR day 1 only (1.3%) or the 24HR day 1 and day 2 mean (1.5%) (Table 1). Unlike most DSs reported on the DSMQ, the majority of antacid products (77%) were mentioned on only 1–9 d during a 30-d period (data not shown).
Using analytic sample 3, when examining the prevalence of DS use for selected nutrients, US adults were significantly more likely to take a DS during a 30-d period, as assessed by the DSMQ, than on a given day, as assessed by the 24HR day 1 method (Table 2). Overall, the estimated prevalence was lowest when estimated from one 24HR only, the shortest reference period, and highest when estimated from DSMQ or at least one 24HR, the longest reference period (Table 2). These patterns were also observed when estimating the prevalence of MVM use (Table 2).
Similar patterns existed across all 5 nutrients when examining the 4 methods for measuring nutrient intake from DSs (Table 3). Few significant differences in mean nutrient intake were observed when comparing intakes estimated from the DSMQ with corresponding intakes from any other method. The exceptions were that mean nutrient intakes of folate and calcium, estimated from the 24HR day 1 only, were significantly higher than those estimated from the DSMQ only. In general, the highest mean nutrient intakes from DSs among users were reported on the 24HR day 1 only (Table 3). In the lower percentiles of intake, mean nutrient intakes from DSs estimated from the 24HR day 1 only and the 24HR day 1 and day 2 mean for the majority of select nutrients were higher than those estimated from the DSMQ, and the DSMQ or at least one 24HR. For example, the mean nutrient intake of calcium from DSs estimated from the DSMQ or at least one 24HR was ∼372 mg/d, whereas 464 mg/d of calcium was the mean nutrient intake estimated from the 24HR day 1 only. This pattern continued throughout the other percentiles and nutrients, especially for calcium. At the median, nearly identical estimates of intake were produced for riboflavin, folate, and magnesium, regardless of the 4 methods. Yet, this was not the case for calcium and vitamin D, where mean nutrient intake estimates varied considerably at the median. Mean intakes from DSs differed the most between methods in the upper quantiles of intake, in varying magnitude by nutrient. For calcium, folate, and riboflavin, the largest variation in the upper percentiles of intake was observed between the DSMQ or at least one 24HR and the 24HR day 1 only, although this was not the case for the remaining nutrients. For magnesium and vitamin D, the largest differences in mean nutrient intake estimates were between the 24HR day 1 only and the 24HR day 1 and day 2 mean.
As shown in Table 4, comparable patterns were also observed for most examined nutrients when stratifying by product classes (i.e., MVM, MV, MM, calcium and vitamin D, single vitamin, and single mineral). However, when failing to take into account the frequency of product use, that is, by looking at intakes on consumption days only, a different pattern of intake was observed for each of the examined nutrients (Table 3). Patterns of calcium intake were unlike those of any other nutrient examined; the largest differences in mean intake per consumption day estimates were observed between the 24HR day 1 only and the DSMQ or at least one 24HR. For riboflavin and folate, the estimated mean intakes per consumption day from DSs remained relatively consistent across methods, with the lowest mean intakes per consumption day from DSs reported on the 24HR day 1 only (Table 3). For vitamin D, the pattern of intake across the different dietary assessment methods was somewhat different. The estimated mean intakes per consumption day from DSs reported on the DSMQ only (46 μg) and the DSMQ or at least one 24HR (44 μg) for vitamin D were much higher than those reported on the 24HR day 1 only (32 μg) or the 24HR day 1 and day 2 mean (31 μg). Findings for magnesium were similar, where the lowest estimated intakes per consumption day from DSs were reported on the 24HR day 1 only and the highest reported on the DSMQ only.
TABLE 4.
Estimated intakes of specified nutrients from DSs by supplement type and by method among US adult supplement users (aged ≥19 y) in analytic sample 3, NHANES 2011–20141
| Riboflavin, mg/d | Vitamin D, μg/d | Folate (DFE), μg/d | Magnesium, mg/d | Calcium, mg/d | ||||||
|---|---|---|---|---|---|---|---|---|---|---|
| n | Mean ± SE | n | Mean ± SE | n | Mean ± SE | n | Mean ± SE | n | Mean ± SE | |
| DSMQ only | ||||||||||
| MVM2 | 2291 | 4.6 ± 0.2 | 2414 | 12.8 ± 0.2 | 2451 | 569.7 ± 11.5 | 2161 | 58.4 ± 1.9 | 2290 | 207.0 ± 4.9 |
| MV/MM3 | 248 | 24.7 ± 2.8 | 99 | 10.9 ± 1.7 | 244 | 622.1 ± 45.2 | 94 | 138.4 ± 17.6 | 104 | 230.3 ± 32.2 |
| Calcium and vitamin D4 | 0 | NA5 | 542 | 12.4 ± 0.6 | 0 | NA5 | 104 | 146.0 ± 18.8 | 542 | 584.6 ± 26.0 |
| Single vitamin/mineral3 | 1 | ES6 | 994 | 49.8 ± 3.8 | 85 | 961.7 ± 106.4 | 140 | 301.5 ± 20.6 | 362 | 680.7 ± 25.9 |
| 24HR day 1 only | ||||||||||
| MVM2 | 1755 | 5.7 ± 0.4 | 1836 | 16.0 ± 0.3 | 1864 | 707.6 ± 7.7 | 1659 | 71.2 ± 1.5 | 1756 | 254.8 ± 5.1 |
| MV/MM3 | 196 | 29.2 ± 2.8 | 63 | 13.2 ± 2.4 | 203 | 748.5 ± 30.4 | 74 | 186.7 ± 24.3 | 76 | 281.8 ± 50.1 |
| Calcium and vitamin D4 | 0 | NA5 | 507 | 14.3 ± 0.6 | 0 | NA5 | 85 | 179.3 ± 36.2 | 507 | 681.5 ± 23.5 |
| Single vitamin/mineral3 | 2 | ES6 | 759 | 55.2 ± 3.9 | 65 | 1088.1 ± 102.4 | 89 | 370.3 ± 33.5 | 259 | 768.7 ± 28.9 |
| 24HR day 1 and day 2 mean | ||||||||||
| MVM2 | 2175 | 5.1 ± 0.3 | 2271 | 13.8 ± 0.3 | 2311 | 612.1 ± 7.2 | 2056 | 61.5 ± 1.4 | 2170 | 220.5 ± 4.9 |
| MV/MM3 | 253 | 24.3 ± 2.2 | 82 | 10.6 ± 1.9 | 260 | 639.7 ± 27.6 | 95 | 167.8 ± 19.8 | 102 | 261.9 ± 39.7 |
| Calcium and vitamin D4 | 0 | NA5 | 617 | 12.5 ± 0.5 | 0 | NA5 | 107 | 157.0 ± 30.2 | 617 | 594.0 ± 21.5 |
| Single vitamin/mineral3 | 2 | ES6 | 927 | 45.3 ± 2.5 | 89 | 955.8 ± 87.5 | 115 | 311.1 ± 24.0 | 311 | 704.9 ± 26.3 |
| DSMQ or at least one 24HR | ||||||||||
| MVM2 | 2628 | 4.6 ± 0.2 | 2698 | 12.6 ± 0.2 | 2796 | 567.2 ± 10.3 | 2477 | 57.7 ± 1.7 | 2590 | 205.3 ± 4.4 |
| MV/MM3 | 294 | 24.7 ± 2.5 | 106 | 10.8 ± 1.6 | 289 | 608.9 ± 40.3 | 111 | 136.1 ± 14.5 | 119 | 234.6 ± 29.8 |
| Calcium and vitamin D4 | 0 | NA5 | 609 | 12.3 ± 0.6 | 0 | NA5 | 112 | 143.9 ± 18.2 | 608 | 583.2 ± 24.3 |
| Single vitamin/mineral3 | 1 | ES6 | 1121 | 47.9 ± 3.4 | 103 | 903.5 ± 98.0 | 155 | 302.2 ± 18.8 | 415 | 670.1 ± 23.3 |
Unless otherwise indicated, values are means ± SEs. The analytic sample includes individuals aged ≥19 y who were not pregnant or lactating and had complete information for the DSMQ and at least one 24HR, and reported DS intakes on the DSMQ and day 1 and day 2 24HRs (analytic sample 3). DFE, dietary folate equivalents; DS, dietary supplement; DSMQ, Dietary Supplement and Prescription Medication Questionnaire; ES, estimate suppressed; MM, multimineral; MV, multivitamin; MVM, multivitamin-mineral; NA, not applicable; 24HR, 24-h dietary recall.
MVMs are categorized as DSs containing ≥3 vitamins and ≥1 mineral.
Riboflavin, vitamin D, and folate estimates reflect intake from MV and single-vitamin DSs. Calcium and magnesium estimates reflect intake from MM and single-mineral DSs. MVs and MMs are categorized as non-MVM DS products containing ≥2 vitamins or minerals, respectively.
Calcium and vitamin D are categorized as non-MVM DS products containing calcium and vitamin D, which may contain other vitamins/minerals.
NA indicates that the estimate is not applicable.
ES indicates that the estimate is suppressed due to a small sample (n < 5).
Table 5 presents the estimated percentages of DSs by match code at the product level. In general, a higher proportion of exact, probable, or generic matches was mentioned on the DSMQ (when product labels were observed by interviewers) than on the 24HR day 1 or 24HR day 2 (when labels were not observed). This is particularly evident with MVMs, MVs, MMs, and calcium and vitamin D products, where ≥80% of these DS products are mentioned as an exact, probable, or generic match on the DSMQ during a 30-d period. The largest percentage of reasonable or default matches was assigned on the 24HR day 2 for most DS product types, specifically in regard to the calcium and vitamin D and single-mineral DS categories, where nearly 30% of calcium and vitamin D and single-mineral DSs were assigned a reasonable or default match code on a given day (i.e., 24HR day 2).
TABLE 5.
Percentage of DSs mentioned by participants via each method by match code and product type, among US adults (aged ≥19 y), NHANES 2011–20141
| DSMQ | 24HR day 1 | 24HR day 2 | ||||
|---|---|---|---|---|---|---|
| m | % | m | % | m | % | |
| Any DS | 14,119 | 9251 | 9476 | |||
| Exact/probable/generic2 | 10,464 | 74.1 | 6323 | 68.4 | 6447 | 68.0 |
| Reasonable/default | 3507 | 24.8 | 2778 | 30.0 | 2857 | 30.2 |
| No match | 148 | 1.1 | 150 | 1.6 | 172 | 1.8 |
| Type of supplement | ||||||
| MVM3 | 3425 | 2235 | 2316 | |||
| Exact/probable/generic2 | 2756 | 80.5 | 1679 | 75.1 | 1752 | 75.7 |
| Reasonable/default | 669 | 19.5 | 556 | 24.9 | 564 | 24.3 |
| MV4 | 523 | 337 | 351 | |||
| Exact/probable/generic2 | 436 | 83.4 | 261 | 77.5 | 264 | 75.2 |
| Reasonable/default | 87 | 16.6 | 76 | 22.5 | 87 | 24.8 |
| MM4 | 176 | 128 | 137 | |||
| Exact/probable/generic2 | 159 | 90.3 | 109 | 85.2 | 112 | 81.8 |
| Reasonable/default | 17 | 9.7 | 19 | 14.8 | 25 | 18.2 |
| Calcium and vitamin D5 | 672 | 540 | 577 | |||
| Exact/probable/generic2 | 536 | 79.8 | 380 | 70.4 | 414 | 71.8 |
| Reasonable/default | 136 | 20.2 | 160 | 29.6 | 163 | 28.2 |
| Single vitamin | 3426 | 2032 | 2161 | |||
| Exact/probable/generic2 | 2507 | 73.2 | 1502 | 73.9 | 1566 | 72.5 |
| Reasonable/default | 919 | 26.8 | 530 | 26.1 | 595 | 27.5 |
| Single mineral | 1044 | 653 | 646 | |||
| Exact/probable/generic2 | 749 | 71.7 | 462 | 70.8 | 460 | 71.2 |
| Reasonable/default | 295 | 28.3 | 191 | 29.2 | 186 | 28.8 |
Unless otherwise indicated, values are means. The unweighted estimates are reported at the product level for select product types, and represent the percentage of all products reported at the population level obtained from analytic sample 1 that have complete information for the NHANES matching code variables. DS, dietary supplement; DSMQ, Dietary Supplement and Prescription Medication Questionnaire; m, number (unweighted) of “mentions” of each product; MM, multimineral; MV, multivitamin; MVM, multivitamin-mineral; 24HR, 24-h dietary recall.
A generic match indicates that information on both the nutrient and dose of the DS are present, but the product name may be incomplete. NHANES protocol requires an automatic declaration of a generic match for any DS product sold in <25 states, regardless of whether or not an exact match was available.
MVMs are categorized as DSs containing ≥3 vitamins and ≥1 mineral.
MVs and MMs are categorized as non-MVM DS products containing ≥2 vitamins or minerals, respectively.
Calcium and vitamin D are categorized as non-MVM DS products containing calcium and vitamin D, which may contain other vitamins/minerals.
Discussion
The findings from the present study suggest that combining the DSMQ with the 24HR (i.e., DSMQ or at least one 24HR) is the most comprehensive method for assessing the prevalence of use of and estimating nutrient intakes from DSs by US adults, when compared with the use of either instrument alone. Although both the DSMQ and the 24HR pose some advantages in isolation (in relation to, e.g., time, cost, or participants), the combined method allows for the most comprehensive approach to estimate mean nutrient intakes from DSs, and leverages the strengths of both assessment methods. Combining multiple methods enhances our ability to capture nutrient exposures from DSs that are reflective of both habitual and episodic DS use. Indeed, although our data show much overlap, some insertions and deletions do exist between methods, similar to food and beverage intake (23). Taken together, our findings suggest that the use of the DSMQ in combination with at least one 24HR (i.e., DSMQ or at least one 24HR) contributes important information for capturing nutrient exposures, particularly with regard to episodically consumed DSs, similar to episodically consumed foods and nutrients (23).
The in-home inventory method in which participants show trained NHANES interviewers the DS containers and information is recorded directly from the product label is currently considered the “gold-standard” method of assessment (4). Indeed, when using the DSMQ, fewer products were assigned a default or reasonable match (25%) than on the 24HR day 1 (30%) or day 2 (30%). In addition, the DSMQ queries the frequency of DS use over the previous 30 d, and thus is likely to capture more episodically consumed DSs than a single 24HR or two 24HRs. Mean nutrient intake estimates produced on the DSMQ and the DSMQ or at least one 24HR were lower than estimates from the 24HR day 1 only, or the 24HR day 1 and day 2 mean. Because the DSMQ multiplies by a much more granular set of probabilities when incorporating frequency than the 24HR, infrequent consumers may dilute estimates of intake on the DSMQ when compared with either 24HR method. These findings further support the concept that without information on frequency, mean daily intake from DSs may be overestimated, and the complexity of mean nutrient intake may not be fully captured. On the other hand, incorporating information from the 24HR helps to reduce any inherent bias that may be associated with the DSMQ [i.e., such as a digit preference in multiples of 5 reported by Nicastro et al. (12)] and also captures DS products that were not recorded on the DSMQ. For instance, our findings in Supplemental Table 1 indicate that >500 adult respondents reported additional, new products consumed between the DSMQ and the 24HRs, suggesting that the use of both methods potentially captures a larger fraction of DS products, as well as more DS users. Similarly, when assessing the prevalence of infrequently reported products (i.e., based on the number of days a product is used), antacid use on a given day was very low using the 24HR only, but much higher during a 30-d period when queried on the DSMQ. These findings suggest that antacid use does not typically follow DS usage patterns, and these products are not commonly used as DSs, but rather as products for acute medicinal purposes. However, the home inventory represents a cost and labor burden that may not be feasible for all settings and may not be necessary for addressing basic questions about the prevalence of use (i.e., with the exception of antacids), for which the mean of two 24HRs approximates the prevalence from the DSMQ. When resources permit the use of only 1 dietary assessment tool, the researcher must assess the strengths and weaknesses of each method and, in turn, choose the most appropriate tool for the research question of interest. However, when DS data are collected as they are in NHANES, incorporating both assessment tools is recommended.
Currently, no standardized methods are available to assess the prevalence of use of, and nutrient exposures from, DSs owing to the lack of sufficient data on the measurement error structure of DS reporting. Therefore, no consensus exists on how to incorporate DSs into total usual intake models. Some researchers support the use of the 24HR to assess usual intake from DSs because the 24HR is the least biased estimator of energy, protein, sodium, and potassium intakes when compared with FFQs (5–8). However, because some DSs are episodically consumed, other researchers prefer methods that incorporate both the amount of nutrient intake and the frequency of consumption when estimating usual intake from DSs, information typically garnered from frequency-based questionnaires. Our findings support the latter: that, although the 24HR may be the least biased estimator for foods and beverages, this may not be true with DSs; DSs were more likely to be consumed episodically. In addition, higher amounts of nutrients were estimated from a single 24HR than with any other method examined in our analysis, suggesting that assuming the amount of nutrient intake reported is the amount consumed daily, as with a single 24HR, overestimates nutrient exposures from DSs. A single 24HR may not be able to distinguish episodic DS consumers from habitual DS consumers, whereas multiple 24HRs, the DSMQ, or both are able to take into consideration the frequency of DS use. For example, when comparing differences in folate intake estimated from the DSMQ, intake of folate decreased by >151 μg when incorporating frequency of DS use, suggesting substantial overestimations in intake when frequency is not taken into account.
This work describes a primary challenge that researchers face when attempting to assess DSs, but many other issues also deserve consideration. First, some individuals use multiple products, which can create very large and extreme values that can exert undue influence on estimates of mean intakes of nutrients from DSs. In this analysis, those extreme values were winsorized as a precautionary measure in order to minimize the effect of skewness on the distribution. Although addressing outliers to help mitigate potential measurement error is critical, the method used to do so is equally as important. As recommended, the cutoffs used in our analysis were statistically driven by the distribution of the data (24). Second, several challenges are also faced when classifying supplements into different product categories. For example, some products could potentially fall into multiple categories, and subjective decisions must be made to create mutually exclusive product categories for analysis at the product level because no standardized definitions for categories exist. Although some DS product types predominantly contain a single nutrient (i.e., magnesium), they may also contain trace amounts of other nutrients that serve a technical function (e.g., binders, colors, excipients, fillers). In these cases, NHANES declares these DSs as products containing >1 vitamin and/or mineral, and thus, decisions regarding the classification of these DS products must be made. For the purpose of our analysis, these products were classified corresponding to the NHANES protocol as an “other nutrient DS,” regardless of the amount of each vitamin and/or mineral in the DS product, and thus excluded from our analysis. These decisions may affect several DS products, and if products are categorized by the number of ingredients alone, prevalence estimates may be misleading. Similarly, many single-vitamin or -mineral DSs also contain small traces of herbals or botanicals, or other ingredients that influence their ability to be classed as a single vitamin or mineral, such as DSs that contain both vitamin C and echinacea. In these cases, DSs were also categorized as “other nutrient DSs” rather than a single vitamin or mineral, because they no longer fell under the mutually exclusive single vitamin or mineral product class. Collectively, these considerations suggest that decisions must be made on a product-by-product basis, specifically tailored to the research question of interest; and all point toward a need for clear standardized methods for the categorization of DS product types. Likewise, for potassium, special considerations when assessing DSs containing this nutrient must be made. Regulatory guidelines set by the FDA in accordance with a ruling by the US Congress require that DS manufacturers and distributors limit the amount of potassium in their products to 99 mg/d, because DSs containing amounts of potassium >99 mg/d have been associated with small bowel lesions (25, 26). As a result, these products are commonly physician-prescribed medications or DSs and, in turn, are not classified as mineral-containing DS products, according to NHANES protocol. Future research is needed to describe best practices for categorizing DSs because many methods currently exist (27). Finally, it would be useful to verify these estimates of DS use from participant report with a more objective measure of use obtained from biomarkers of intake.
The strengths and limitations of the present study should be noted. Self-reported data are prone to measurement error, and NHANES relies on label declarations when evaluating DS use. Analytically derived values for most micronutrients tend to be higher than labelled amounts for MVMs, but little is known about other product types and single-nutrient DSs (28, 29). Another limitation of our analysis is that participants are probed during the 24HR to recall DSs previously reported on the in-home interview, which is not commonly conducted on other 24HRs outside of NHANES. We assume that the DS intake reported on the in-home interview reflects long-term DS intake, but little is known about the measurement error structure of DS reporting (4). NHANES is a nationally representative survey of the US noninstitutionalized population; however, NHANES response rates for the years 2011–2012 and 2013–2014 for adults were 66% and 65%, respectively (30, 31). Finally, a note of caution: we looked at prevalence estimates and estimated nutrient intakes from DSs among all US adults; however, differential patterns of DS use within specific adult population subgroups exist. Specifically, DS use can be very high among older adult women, cancer survivors, or those recently diagnosed with cancer (20, 32–34).
In conclusion, for assessment purposes when precise estimates of exposure are needed for nutrients, the optimal method is the use of the DSMQ in combination with at least one 24HR (i.e., DSMQ or at least one 24HR). This work adds to a small but growing literature on assessment methods for DSs. Further research focused on determining whether the choice of the assessment tool of interest has an effect on total nutrient intake estimates is needed. Although our methods were designed to capture different DS usage patterns and a variety of nutrients, determining how these methods compare for other nutrients when assessing the prevalence of DS use and estimated mean intake from DSs is a future research opportunity. Finally, appropriate methods for incorporating nutrients from DSs into models that estimate usual intakes from foods are needed.
Supplementary Material
Acknowledgments
The authors’ responsibilities were as follows—AEC, RLB, KWD, JJG, and JAT: designed the research and concepts presented; AEC, SJ, RLB, and JAT: wrote sections of the paper; SJ, RLB, JAT, JJG, HAE-M, PMG, JTD, AJM, DGR, AB, and KWD: provided critical review and insights presented; and all authors: read and approved the final manuscript.
Notes
Supported by NIH/National Cancer Institute grant NIH/NCI U01CA215834 (to RLB).
Author disclosures: AEC, SJ, JAT, KWD, JJG, HAE-M, PMG, AJM, DGR, and AB have no conflicts of interest. RLB has served as a consultant in the past to the NIH Office of Dietary Supplements, Nestlé, the General Mills Bell Institute, Columbia University, RTI International, and Nutrition Impact; and is a trustee of the International Food Information Council and a board member of the International Life Sciences Institute-North America. RLB has recieved travel support to present her research on dietary supplements from the Council of Responsible Nutrition, American Society of Nutrition, RTI International, and the New York Academy of Sciences. JTD has served on an advisory board for McCormick Spice, The Mushroom Council, Bay State Milling, ConAgra Foods, and Nestlé, recieves editorial fees from Lippincott, Williams, and Wilkins/Wolters Kluwer Publishers, and holds stock in several food and drug companies.
The funders had no role in the design of the study; in the collection, analyses, or interpretation of data; in the writing of the manuscript; or in the decision to publish the results.
Supplemental Tables 1 and 2 are available from the “Supplementary data” link in the online posting of the article and from the same link in the online table of contents at https://academic.oup.com/jn.
Abbreviations used: DS, dietary supplement; DSMQ, Dietary Supplement and Prescription Medicine Questionnaire; MEC, mobile examination center; MM, multimineral; MV, multivitamin; MVM, multivitamin-mineral; NCHS, National Center for Health Statistics; 24HR, 24-h dietary recall.
References
- 1. Cowan AE, Jun S, Gahche JJ, Tooze JA, Dwyer JT, Eicher-Miller HA, Bhadra A, Guenther PM, Potischman N, Dodd KW et al.. Dietary supplement use differs by socioeconomic and health-related characteristics among U.S. adults, NHANES 2011–2014. Nutrients. 2018;10(8):1114. [DOI] [PMC free article] [PubMed] [Google Scholar]
- 2. Kantor ED, Rehm CD, Du M, White E, Giovannucci EL. Trends in dietary supplement use among US adults from 1999–2012. JAMA. 2016;316:1464–74. [DOI] [PMC free article] [PubMed] [Google Scholar]
- 3. Briefel RR, Johnson CL. Secular trends in dietary intake in the United States. Annu Rev Nutr. 2004;24:401–31. [DOI] [PubMed] [Google Scholar]
- 4. Bailey RL, Dodd KW, Gahche JJ, Dwyer JT, Cowan AE, Jun S, Eicher-Miller HA, Guenther PM, Bhadra A, Thomas PR et al.. Best practices for dietary supplement assessment and estimation of total usual nutrient intakes in population-level research and monitoring. J Nutr. 2019;149(2):181–97. [DOI] [PMC free article] [PubMed] [Google Scholar]
- 5. Schatzkin A, Kipnis V, Carroll RJ, Midthune D, Subar AF, Bingham S, Schoeller DA, Troiano RP, Freedman LS. A comparison of a food frequency questionnaire with a 24-hour recall for use in an epidemiological cohort study: results from the biomarker-based Observing Protein and Energy Nutrition (OPEN) study. Int J Epidemiol. 2003;32:1054–62. [DOI] [PubMed] [Google Scholar]
- 6. Kipnis V, Subar AF, Midthune D, Freedman LS, Ballard-Barbash R, Troiano RP, Bingham S, Schoeller DA, Schatzkin A, Carroll RJ. Structure of dietary measurement error: results of the OPEN Biomarker Study. Am J Epidemiol. 2003;158:14–21. [DOI] [PubMed] [Google Scholar]
- 7. Freedman LS, Commins JM, Moler JE, Willett W, Tinker LF, Subar AF, Spiegelman D, Rhodes D, Potischman N, Neuhouser ML et al.. Pooled results from 5 validation studies of dietary self-report instruments using recovery biomarkers for potassium and sodium intake. Am J Epidemiol. 2015;181:473–87. [DOI] [PMC free article] [PubMed] [Google Scholar]
- 8. Subar AF, Kipnis V, Troiano RP, Midthune D, Schoeller DA, Bingham S, Sharbaugh CO, Trabulsi J, Runswick S, Ballard-Barbash R et al.. Using intake biomarkers to evaluate the extent of dietary misreporting in a large sample of adults: the OPEN study. Am J Epidemiol. 2003;158:1–13. [DOI] [PubMed] [Google Scholar]
- 9. Bailey RL, Fulgoni VL 3rd, Keast DR, Dwyer JT. Examination of vitamin intakes among US adults by dietary supplement use. J Acad Nutr Diet. 2012;112:657–63..e4. [DOI] [PMC free article] [PubMed] [Google Scholar]
- 10. Bailey RL, Fulgoni VL 3rd, Keast DR, Dwyer JT. Dietary supplement use is associated with higher intakes of minerals from food sources. Am J Clin Nutr. 2011;94:1376–81. [DOI] [PMC free article] [PubMed] [Google Scholar]
- 11. Verkaik-Kloosterman J, Dodd KW, Dekkers AL, van't Veer P, Ocke MC. A three-part, mixed-effects model to estimate the habitual total vitamin D intake distribution from food and dietary supplements in Dutch young children. J Nutr. 2011;141:2055–63. [DOI] [PubMed] [Google Scholar]
- 12. Nicastro HL, Bailey RL, Dodd KW. Using 2 assessment methods may better describe dietary supplement intakes in the United States. J Nutr. 2015;145:1630–4. [DOI] [PMC free article] [PubMed] [Google Scholar]
- 13. Marra MV, Bailey RL. Position of the Academy of Nutrition and Dietetics: micronutrient supplementation. J Acad Nutr Diet. 2018;118:2162–73. [DOI] [PMC free article] [PubMed] [Google Scholar]
- 14. Zipf G, Chiappa M, Porter KS. National Health and Nutrition Examination Survey: plan and operations, 1999–2010. Vital Health Stat 1. 2013;(56):1–37. [PubMed] [Google Scholar]
- 15. National Center for Health Statistics. National Health and Nutrition Examination Survey: 2011–2012 data documentation, codebook, and frequencies: dietary supplement use 30-day—total dietary supplements. Hyattsville (MD): National Center for Health Statistics; 2014. [Google Scholar]
- 16. National Center for Health Statistics. National Health and Nutrition Examination Survey: 2013–2014 data documentation, codebook, and frequencies: dietary supplement use 30-day—total dietary supplements. Hyattsville (MD): National Center for Health Statistics; 2016. [Google Scholar]
- 17. Blanton CA, Moshfegh AJ, Baer DJ, Kretsch MJ. The USDA Automated Multiple-Pass Method accurately estimates group total energy and nutrient intake. J Nutr. 2006;136:2594–9. [DOI] [PubMed] [Google Scholar]
- 18. Moshfegh AJ, Rhodes DG, Baer DJ, Murayi T, Clemens JC, Rumpler WV, Paul DR, Sebastian RS, Kuczynski KJ, Ingwersen LA et al.. The US Department of Agriculture Automated Multiple-Pass Method reduces bias in the collection of energy intakes. Am J Clin Nutr. 2008;88:324–32. [DOI] [PubMed] [Google Scholar]
- 19. Bailey RL, Gahche JJ, Miller PE, Thomas PR, Dwyer JT. Why US adults use dietary supplements. JAMA Intern Med. 2013;173:355–61. [DOI] [PubMed] [Google Scholar]
- 20. Gahche JJ, Bailey RL, Potischman N, Dwyer JT. Dietary supplement use was very high among older adults in the United States in 2011–2014. J Nutr. 2017;147:1968–76. [DOI] [PMC free article] [PubMed] [Google Scholar]
- 21. Bailey RL, Fakhouri TH, Park Y, Dwyer JT, Thomas PR, Gahche JJ, Miller PE, Dodd KW, Sempos CT, Murray DM. Multivitamin-mineral use is associated with reduced risk of cardiovascular disease mortality among women in the United States. J Nutr. 2015;145:572–8. [DOI] [PMC free article] [PubMed] [Google Scholar]
- 22. Tooze JA, Schoeller DA, Subar AF, Kipnis V, Schatzkin A, Troiano RP. Total daily energy expenditure among middle-aged men and women: the OPEN Study. Am J Clin Nutr. 2007;86:382–7. [DOI] [PubMed] [Google Scholar]
- 23. Carroll RJ, Midthune D, Subar AF, Shumakovich M, Freedman LS, Thompson FE, Kipnis V. Taking advantage of the strengths of 2 different dietary assessment instruments to improve intake estimates for nutritional epidemiology. Am J Epidemiol. 2012;175:340–7. [DOI] [PMC free article] [PubMed] [Google Scholar]
- 24. Thompson FE, Kirkpatrick SI, Subar AF, Reedy J, Schap TE, Wilson MM, Krebs-Smith SM. The National Cancer Institute's Dietary Assessment Primer: a resource for diet research. J Acad Nutr Diet. 2015;115:1986–95. [DOI] [PMC free article] [PubMed] [Google Scholar]
- 25. US FDA. Potassium salt preparations intended for oral ingestion by man. Silver Spring (MD): FDA; 2017. [Google Scholar]
- 26. Allen AC, Boley SJ, Schultz L, Schwartz S. Potassium-induced lesions of the small bowel: II. Pathology and pathogenesis. JAMA. 1965;193:1001–6. [DOI] [PubMed] [Google Scholar]
- 27. Blumberg JB, Bailey RL, Sesso HD, Ulrich CM. The evolving role of multivitamin/multimineral supplement use among adults in the age of personalized nutrition. Nutrients. 2018;10(2):248. [DOI] [PMC free article] [PubMed] [Google Scholar]
- 28. Andrews KW, Roseland JM, Gusev PA, Palachuvattil J, Dang PT, Savarala S, Han F, Pehrsson PR, Douglass LW, Dwyer JT et al.. Analytical ingredient content and variability of adult multivitamin/mineral products: national estimates for the Dietary Supplement Ingredient Database. Am J Clin Nutr. 2017;105:526–39. [DOI] [PMC free article] [PubMed] [Google Scholar]
- 29. Betz JM, Rimmer CA, Saldanha LG, Phillips MM, Andrews KW, Wise SA, Wood LJ, Kuszak AJ, Gusev PA, Pehrsson PR. Challenges in developing analytically validated laboratory-derived dietary supplement databases. J Nutr. 2018;148:1406S–12S. [DOI] [PMC free article] [PubMed] [Google Scholar]
- 30. National Center for Heath Statistics. Unweighted response rates for NHANES 2011–2012 by age and gender. Hyattsville (MD): National Center for Health Statistics; 2014. [Google Scholar]
- 31. National Center for Health Statistics Unweighted response rates for NHANES 2013–2014 by age and gender. Hyattsville (MD): National Center for Health Statistics; 2016. [Google Scholar]
- 32. Ferrucci LM, McCorkle R, Smith T, Stein KD, Cartmel B. Factors related to the use of dietary supplements by cancer survivors. J Altern Complement Med. 2009;15:673–80. [DOI] [PMC free article] [PubMed] [Google Scholar]
- 33. Patterson RE, Neuhouser ML, Hedderson MM, Schwartz SM, Standish LJ, Bowen DJ. Changes in diet, physical activity, and supplement use among adults diagnosed with cancer. J Am Diet Assoc. 2003;103:323–8. [DOI] [PubMed] [Google Scholar]
- 34. Velicer CM, Ulrich CM. Vitamin and mineral supplement use among US adults after cancer diagnosis: a systematic review. J Clin Oncol. 2008;26:665–73. [DOI] [PubMed] [Google Scholar]
Associated Data
This section collects any data citations, data availability statements, or supplementary materials included in this article.