ABSTRACT
Background
Chronic alcohol use often leads to malnutrition. However, how the intestinal absorption of nutrients such as glucose may be affected during moderate ethanol use has not been investigated. Glucose is absorbed via sodium (Na)-dependent glucose co-transport (SGLT1; SLC5A1) along the brush border membrane (BBM) of intestinal absorptive villus cells.
Objective
The aim of this study was to investigate how moderate alcohol consumption affects the absorption of glucose via SGLT1.
Methods
Intestinal epithelial cells (IEC-18; rat) were exposed to 8.64 mM ethanol over 1, 3, 6, and 12 h. Rats (16-wk-old, male, Sprague-Dawley) were administered 2 g/kg ethanol over 1, 3, and 6 h. Na-dependent 3H-O-methyl-d-glucose uptake was measured to assess SGLT1 activity. Na-K-ATPase activity was measured as a function of inorganic phosphate release. Protein expression was analyzed by Western blot analysis and immunohistochemical staining.
Results
Ethanol significantly decreased Na-dependent glucose absorption in enterocytes in vitro (ethanol treatment: 48.4% of controls at 1 h; P < 0.01) and in vivo (ethanol treatment: 60.0% of controls at 1 h; P < 0.01). Na-K-ATPase activity was significantly inhibited in vitro (ethanol treatment: 36.9% of controls at 1 h; P < 0.01) and in vivo (ethanol treatment: 42.1% of controls at 1 h; P < 0.01). Kinetic studies showed that the mechanism of inhibition of Na-glucose co-transport was secondary to a decrease in the affinity (1/Km) of the co-transporter for glucose both in vitro and in vivo. Western blots and immunohistochemistry further demonstrated unaltered amounts of SGLT1 after ethanol treatment.
Conclusions
Moderate ethanol significantly decreases glucose absorption in IEC-18 cells and in villus cells of Sprague-Dawley rats. The inhibition of SGLT1 is secondary to an altered Na gradient at the cellular level and secondary to diminished affinity of the co-transporter for glucose at the protein level in the BBM. These observations may, at least in part, explain 1 possible mechanism of the onset of malnutrition associated with alcohol consumption.
Keywords: enterocyte nutrient absorption, ethanol, SGLT1, Na-nutrient co-transport, glucose absorption
Introduction
Chronic alcohol use has many well-documented negative consequences including an increased risk of liver disease, cirrhosis, cancer, high blood pressure, and stroke (1, 2). Perhaps the most well-known but least understood complication of chronic alcoholism is malnutrition. In fact, how even moderate alcohol consumption, a considerably more common occurrence, may affect nutrient absorption in the mammalian small intestine is not fully understood. According to the 2015 National Survey on Drug Use and Health, almost 90% of adults report alcohol consumption during their lifetime (3). Moderate alcohol use, defined as 1 standard alcoholic beverage per day for women and 2 for men, imparts surprising health benefits, including decreased risk for heart disease, ischemic stroke, diabetes, and obesity (4, 5). Nevertheless, beneficial or deleterious, how ethanol may affect intestinal nutrient absorption is poorly understood.
Chronic use of alcohol leads to malnutrition in chronic alcoholics, in part because of suboptimal nutrient intake (6). Alcohol use decreases absorption of essential vitamins along the small intestine, including vitamin B-12, vitamin B-6, vitamin C, and selenium (7). It also decreases the absorption of thiamine (8), riboflavin (9), and folate (10) at the level of the nutrient co-transporter in the brush border membrane (BBM) of enterocytes. Although the effect of ethanol on vitamin assimilation has been studied more often, its effect on nutrient absorption is less well understood. This study, for the first time, investigates alcohol's effect on nutrient absorption; specifically, the effect of moderate ethanol on the sodium (Na)-dependent glucose co-transporter, SGLT1, complementarily in vitro and in vivo.
Glucose is an essential nutrient used as the primary fuel source for the mammalian body. The primary means of glucose absorption in the small intestine is via the BBM-located Na-dependent glucose co-transporter SGLT1 (SLC5A1). SGLT1 is a 14-transmembrane domain protein, which is mainly expressed in the intestine. It facilitates the movement of 2 Na ions into the cell with 1 glucose molecule (2:1 ratio). The favorable Na gradient for SGLT1 in villus cells is provided by the basolateral membrane (BLM) Na-K-ATPase. In addition, there is emerging evidence that SGLT1 regulates the other primary Na-absorptive mechanism in intestinal enterocytes via the Na-proton exchanger NHE3 (11, 12).
Once glucose is absorbed into enterocytes, it can be transported and stored in the body to be used in a variety of metabolic processes including the pentose phosphate pathway and the Krebs cycle to produce energy in the form of ATP (12). Dysregulation of glucose absorption along the small intestine can lead to a variety of metabolic diseases, including malnutrition (6).
Previous studies have investigated the role of ethanol on glucose absorption. Overall, glucose absorption was significantly decreased by ethanol in hamsters (13–15), rats (16–18), chickens (19), and dogs (20). However, none of these studies investigated the effect of moderate ethanol on the Na-dependent glucose co-transporter, SGLT1.
In this study, we aim to investigate the effect of a moderate dose of ethanol on SGLT1 in vitro and in vivo to better understand the onset of alcohol-dependent malnutrition.
Methods
Cell culture
The immortalized nonmalignant rat intestinal epithelial cell (IEC) line IEC-18 (CRL-1589 American Type Culture Collection) was cultured in DMEM (4.5 g/L glucose, 3.7 g/L NaHCO3, 2 mM l-glutamine, 10% vol/vol bovine fetal serum, 0.02% insulin, and 0.25%-hydroxybutyric acid) in a humidified atmosphere of 10% CO2 at 37°C. The medium was changed every 2–3 d. Cells were grown to 4 d post confluence as monolayers, with use of only cells between passages 5 and 20. At 4 d post confluence, IEC-18 cells exhibit characteristics of mature enterocytes (21). Cells were treated with 8.64 mM ethanol (200 proof, Pharmco Apper), the equivalent of a 0.04% blood alcohol content (BAC) dosage, directly into fresh medium for 1, 3, 6, or 12 h. This dosage is considered equivalent to moderate alcohol consumption in humans (22). Control-treated cells were exposed to the same volume of sterile water in fresh medium.
Uptake studies in IEC-18 cells
Uptake studies were performed as previously described (23) in IEC-18 cells. In brief, Na-dependent uptakes were conducted with Na-HEPES buffer (47 mM KCl, 1 mM MgSO4, 1.2 mM KH2PO4, 20 mM HEPES, 125 mM CaCl2, and 130 mM NaCl; pH 7.4). Activity levels for SGLT1 and Na/H exchange were determined through use of specific reaction mixtures and inhibitors, phlorizin and 5-(N-ethyl-N-isopropyl) amiloride (EIPA), respectively. Subtraction of the inhibited uptakes from the uninhibited uptakes establish specific activity levels for SGLT1 and Na/H exchange. More specifically, glucose uptakes were performed with and without 1 mM phlorizin, an SGLT1 inhibitor, and 100 µM of cold d-glucose, as determined previously (24). The reaction buffers contained 10 µCi 3H-3-O-methyl-d-glucose (OMG) and 10 mM OMG. The reaction was stopped with ice-cold Na-HEPES buffer containing 25 mM d-glucose. All reactions were performed for exactly 2 min. The cells were then processed as previously described (25) and measured in a scintillation counter (LS 6500; Beckman Coulter).
Protein quantification
Total protein was measured via the Bradford method, with use of the DC protein assay kit (Bio-Rad) with BSA as a standard.
Animal studies
Thirteen to 15-wk-old male Sprague-Dawley rats (CD®) were purchased from Charles River and allowed to acclimate to their environment for at least 1 wk. All rats had equal access to water and a nonpurified rodent diet consisting of approximately 28.5% protein, 13.4% fat, and 58.0% carbohydrates (LabDiet 5001) described in depth by Khan-Merchant and colleagues (26). All rats were kept in a 12-h light and dark cycle. All oral gavage procedures started between 07:00 and 10:00 when the rats had aged to 16 wk with no prior fasting. An oral intragastric gavage was used with manual restraint, and 2 g/kg ethanol or tap water was administered to ethanol-treated rats or control-treated rats, respectively (27). This dosage is considered equivalent to moderate alcohol consumption in humans (22). Rats in the 6-h treatment group were administered a second dose of ethanol 3 h after the first dosage to maintain the correct BAC. Animals were euthanized with excess CO2, and a final blood sample for plasma separation was collected via cardiac puncture. All animal handling, treatment, and euthanasia were carried out according to a protocol approved by the Marshall University IACUC.
Villus cell isolation
Villus cells were isolated from control and ethanol-treated rats immediately after treatments from the terminal small intestine by a Ca+2 chelation technique as previously described (28). Briefly, a 12-inch section of the distal small intestine was filled with a buffer containing 0.15 mM EDTA, 112 mM NaCl, 25 mM NaHCO3, 2.4 mM K2PO4, 0.4 mM KH2PO4, 2.5 mM L-glutamine, 0.5 mM β-hydroxybutyrate, and 0.5 mM dithiothreitol, and gassed with 95% O2 and 5% CO2, pH 7.4 at 37°C. The intestine was incubated for 3 min and palpitated for 3 min to aid in cell dispersion. The resulting cell suspension was then used for whole cell uptakes, or phenyl-methyl sulfonyl fluoride was added and centrifuged at 100 × g for 3 min at room temperature, and the cellular pellet was frozen immediately in liquid nitrogen and stored at −80°C. The isolated cells were then used for the Na-K-ATPase, brush border membrane vesicle (BBMV), kinetic, and Western blot experiments.
Uptake studies in villus cells from rats
Intact whole cell uptakes were conducted (100 mg wet weight) immediately after the villus cell isolation as previously described (25). In brief, 100 µL of the previously described reaction mixtures were added to 100 µL of the cellular suspension. The uptake was halted at exactly 2 min with ice-cold stop solution, filtered on 0.65 µm mixed cellulose esters membrane filters (DAWP; Millipore) and washed twice with ice-cold stop solution with use of vacuum filtration. Each filter was dissolved in 4 mL scintillation solution, and radioactivity was measured as above.
Na-K-ATPase measurement
Isolated villus cells from rats were homogenized and centrifuged at 8000 × g for 5 min at 4°C. The Na-K-ATPase activity was measured as inorganic phosphate formation in cellular homogenates as previously described (29) and activity was expressed as nanomoles of inorganic phosphate released per milligram protein per minute.
BBMV preparation and uptake
BBMVs from rat intestinal villus cells were prepared by CaCl2 precipitation and differential centrifugation as previously described (25, 30). The final BBMV preparation was incubated for 1 h in a Na-free buffer at room temperature, and 5 µL of BBMVs were incubated in 95 µL reaction buffer as described above. The reaction was arrested at 90 s and filtered on 0.45 µm mixed cellulose esters membrane filters (HAWP; Millipore). The radioactivity was measured from the dissolved filters as described above.
Kinetics
Na-dependent glucose uptakes were performed at 30 s with varying concentrations of glucose (0.1, 0.5, 1, 5, 10, 25, 75, and 100 mM) as described above. Uptake values were evaluated by Michaelis-Menten kinetics with nonlinear regression data analysis from Prism 7 software (GraphPad). Isolated rat villus cells were used to create BBMVs and kinetics were performed as above.
Western blot studies
Whole cell homogenates were prepared by first centrifuging cells at 8000 × g at 4°C for 5 min and solubilizing the resulting pellet in radioimmunoprecipitation (RIPA) buffer containing protease inhibitors (Santa Cruz). Cellular extracts in RIPA were then centrifuged at 8000 × g at 4°C for 5 min, and the supernatant was measured for protein content with a NanoDrop Spectrophotometer (Thermo Scientific). Proteins from BBM preparations were solubilized and extracted in RIPA buffer as above. Proteins were separated on a 12% polyacrylamide gel, transferred onto a polyvinylidene difluoride membrane, blocked in 5% BSA for IEC-18 samples or 5% milk for Sprague-Dawley rat samples for 1 h as previously described (31, 32). Rabbit polyclonal primary antibodies against SGLT1 (Abcam 14686) were used at a 1:500 dilution at 4°C overnight. Horseradish peroxidase-conjugated anti-rabbit secondary antibodies at 1:1000 dilution at room temperature for 1 h were also used. Enhanced chemiluminescence Western Blotting Detecting Reagent detected the immobilized proteins. Luminescence was detected and analyzed by densitometry with a FluorChem M imager (ProteinSimple). All blots were stripped, and re-probed with a mouse monoclonal primary antibody against ezrin (MilliporeSigma MAB3822-C) at a 1:1000 dilution as above, and proteins were normalized against the ezrin values.
Immunocytochemistry
Control and ethanol-treated cells grown on glass coverslips were fixed with ice-cold methanol for 4 min. Nonspecific binding of primary antibodies was blocked with 5% BSA and 0.1% Triton-X for 1 h at room temperature. Cells were then washed in room temperature PBS, 3 times for 5 min each and incubated with SGLT1 primary antibody (Abcam 14686) at a 1:250 dilution for 1 h. Cells were washed as before, then incubated with goat anti-rabbit Alexa Fluor 594 secondary antibody (Invitrogen) for 1 h at a 1:500 dilution. The cells were washed again, mounted with Fluoroshield Mounting Medium with 4',6-diamidino-2-phenylindole (DAPI) (Abcam) and imaged with a 20× objective on an EVOS FL Auto 2 microscope (Invitrogen) and quantified with AlphaView software version 3.4.0.0.
Immunohistochemistry
Approximately 1.25 cm of terminal small intestine was separated for immunohistochemistry. The intestine was gently washed with room temperature PBS, then flash frozen with liquid nitrogen and stored at −80°C until processing. Upon use, samples were quickly placed in Tissue Plus O.C.T. Compound (Fisher HealthCare) and frozen with dry ice in isopentane to avoid thawing the sample. Samples were sectioned 3 µm thick at −20°C with use of a cryostat (Leica CM1806). Sections were fixed in −20°C methanol for 30 s and processed with the same blocking, primary and secondary antibodies used above. Tissue sections were mounted, imaged, and analyzed as above. Negative controls were conducted (Supplemental Figure 1).
Statistical analysis
Data were computed in triplicate and means ± SEM were evaluated. P values were derived by unpaired t test. In cases of multiple time points, multiple hypothesis testing was addressed with a Bonferroni correction with Prism 7 software (GraphPad). A P value <0.05 was considered to be statistically significant. To check for the robustness of the data sets, nonparametric methodology was used. Each number (n) for any set of experiments refers to independent cell preparations from different passages.
Results
Cell viability in response to a moderate dosage of ethanol in IEC-18 cells
To ensure that our dosage of moderate ethanol (8.64 mM or the equivalent of a 0.04% BAC), was not cytotoxic, lactate dehydrogenase (LDH) and trypan blue exclusion experiments were performed (Supplemental Figure 2). In the LDH assay, ethanol-treated cells did not significantly differ from controls (P ≥ 0.05). In trypan blue assays, ethanol-treated cells did not significantly differ from controls (P ≥ 0.05). Cell survival of between 95% and 100% is considered to be within normal physiological parameters.
Effect of ethanol on Na-dependent glucose uptake in IEC-18 cells
To determine whether moderate ethanol affects glucose absorption, 3H-OMG uptakes were conducted in IEC-18 cells exposed to 1, 3, 6, and 12 h of ethanol (P ≤ 0.04; n = 6). Ethanol significantly decreased Na-dependent glucose absorption at all time points (Figure 1).
FIGURE 1.
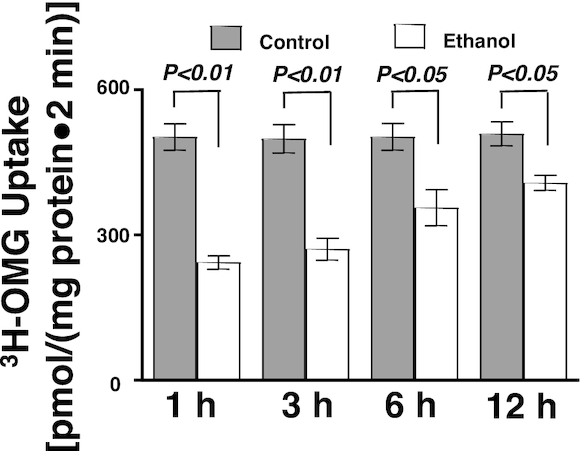
Moderate ethanol decreased glucose absorption in IEC-18 cells (n = 6). Values represent the means ± SEMs. IEC, intestinal epithelial cell; OMG, O-methyl-d-glucose.
Effect of ethanol on Na-K-ATPase activity in IEC-18 cells
The Na-K-ATPase located on the BLM provides the transcellular Na gradient necessary for Na-dependent nutrient co-transporters. The Na-K-ATPase activity was significantly inhibited by moderate ethanol at all time points (Figure 2; P ≤ 0.01; n = 6).
FIGURE 2.
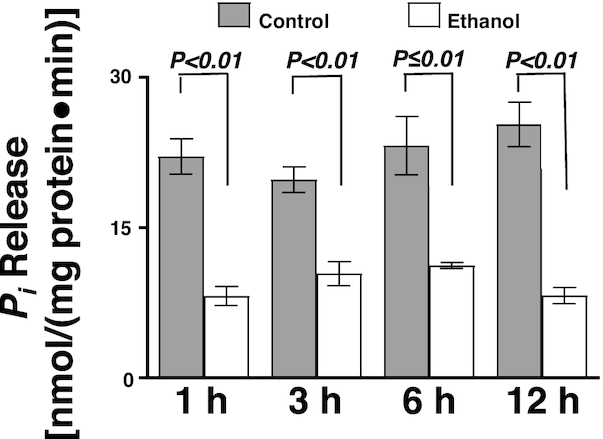
Moderate ethanol significantly decreased Na-K-ATPase activity in IEC-18 cells. The Na-K-ATPase activity was determined as a function of Pi release in the presence and absence of moderate ethanol (n = 6). Values represent the means ± SEMs. IEC, intestinal epithelial cell; Pi, inorganic phosphate.
Effect of acetaldehyde on glucose uptake in IEC-18 cells
Ethanol is metabolized into acetaldehyde, which can cause cell damage at low concentrations (33). Approximately 11 µM acetaldehyde was measured in IEC-18 cells after 1 h of ethanol exposure (data not shown). Then, in a separate experiment, acetaldehyde was exposed to IEC-18 cells to determine whether acetaldehyde affects SGLT1 activity. There was no change in Na-dependent glucose uptake after exposure to 15 µM acetaldehyde (Supplemental Figure 3; P ≥ 0.05).
Effect of ethanol on Na/H exchange in IEC-18 cells
To investigate whether ethanol also affects another Na-absorptive pathway on the BBM of IEC-18 cells, 22Na-uptakes were conducted to evaluate Na/H exchange. Moderate ethanol did not change Na/H exchange in IEC-18 cells (Supplemental Figure 4; P ≥ 0.05). This indicates that ethanol's effect on Na-absorptive pathways in IEC-18 cells is selective.
Effect of ethanol on the kinetic parameters of Na-dependent glucose co-transport in IEC-18 cells
Kinetic studies were conducted to determine the mechanism of inhibition of Na-dependent glucose co-transport by moderate ethanol. In IEC-18 cells, the affinity of the Na-dependent co-transporter SGLT1 was decreased as represented by an increase in Km when exposed to 1 h of ethanol. The mechanism of inhibition of Na-glucose co-transport in IEC-18 cells by ethanol was secondary to a decrease in the affinity of the co-transporter (1/Km) for glucose without a change in the maximal rate of uptake of the co-transporter (Vmax), suggesting a decreased affinity of SGLT1 to glucose, rather than a reduction in co-transporter number (Table 1).
TABLE 1.
Effect of ethanol on the kinetic parameters of Na-dependent glucose co-transport in rat intestinal epithelial cells in vitro and in vivo1
| Vmax, nmol/(mg protein·30 s) | Km, mM | |
|---|---|---|
| IEC-18 cells | ||
| Control | 4.9 ± 0.2 | 5.6 ± 0.5 |
| Ethanol | 5.1 ± 0.3 | 14.0 ± 1.0* |
| Sprague-Dawley rats | ||
| Control | 5.4 ± 0.6 | 12.4 ± 0.3 |
| Ethanol | 5.3 ± 0.5 | 15.3 ± 0.4* |
Na-dependent glucose uptake was determined by varying concentrations of glucose with phlorizin-sensitive 3H-OMG uptakes in the presence and absence of moderate ethanol for 1 h. Uptake for all concentrations was conducted at 30 s. Values represent the means ± SEMs. IEC, intestinal epithelial cell; OMG, O-methyl-d-glucose.
Denotes difference from control at that time and a significance of P < 0.01.
Quantification of SGLT1 protein expression after exposure to moderate ethanol in IEC-18 cells
Protein expression of SGLT1 in whole cell homogenates was not significantly altered in IEC-18 cells after 1 h exposure to ethanol, as quantified by densitometry (Figure 3A, B; P ≥ 0.05). Similarly, there was no difference in amounts of SGLT1 protein in IEC-18 cell BBM between control and ethanol-treated IEC-18 cells (Figure 3C, D; P ≥ 0.05).
FIGURE 3.
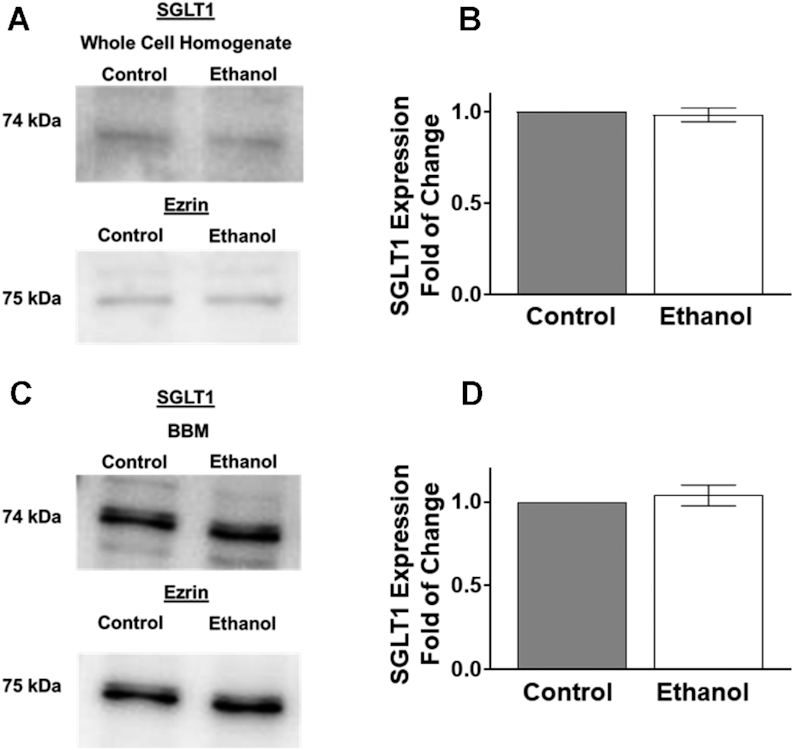
Ethanol did not change SGLT1 protein expression in IEC-18 cells. (A) Western blot analysis of SGLT1 protein expression in whole cell homogenates from control and ethanol-treated cells. The blots show a representative sample used for densitometric quantification (n = 4). (B) Densitometric quantification of SGLT1 protein expression was not significantly changed in whole cell homogenates after 1 h exposure of ethanol (n = 4). (C) Western blot analysis of BBM protein expression of SGLT1 from control and ethanol-treated cells. The blots show a representative sample used for densitometric quantification. (D) Densitometric analysis of SGLT1 protein expression was not significantly altered in the BBM fraction after 1 h exposure to ethanol (n = 4). Values represent the means ± SEMs. Blots were normalized with an anti-ezrin antibody to assure equivalence of loading. BBM, brush border membrane; IEC, intestinal epithelial cell; SGLT1, SLC5A1.
In addition, immunocytochemistry studies were performed in control and ethanol-treated cells exposed to 1 and 12 h of ethanol. Consistent with Western blot data, SGLT1 immunofluorescence intensity was unchanged in cells exposed to ethanol (Figure 4A, B; 1H: P ≥ 0.05; n = 4).
FIGURE 4.
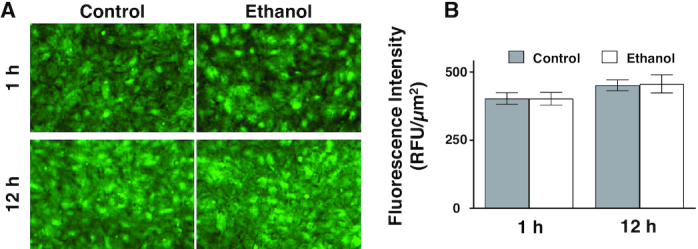
SGLT1 expression in IEC-18 cells after exposure to ethanol. (A) The effect of ethanol on SGLT1 expression in IEC-18 cells imaged with the 20× objective. (B) 1 h of ethanol did not significantly change SGLT1 immunofluorescence intensity in IEC-18 cells (n = 4). Each sample is an average of at least 5 different images obtained with a 20× objective. Values represent the means ± SEMs. IEC, intestinal epithelial cell; RFU, relative fluorescence units; SGLT1, SLC5A1.
These data, along with the kinetic analysis above, demonstrate that the mechanism of inhibition of ethanol-mediated Na-dependent glucose co-transport in IEC-18 cells occurs via a change in the affinity of SGLT1 for glucose and not through a change in the protein expression.
Effect of a short-term oral gavage of ethanol in Sprague-Dawley rats
To determine the in vivo effect of moderate ethanol consumption on SGLT1, Sprague-Dawley rats were administered ethanol by intragastric gavage. The body weights of the rats at the time of gavage did not differ (Supplemental Figure 5A). The BAC of the rats was measured at the time of euthanasia or, in the longer time points, 1 h after ethanol administration. The rats achieved the equivalent of 0.04% BAC (Supplemental Figure 5B).
Effect of ethanol on Na-glucose co-transport in intestinal epithelial cells in vivo
To determine whether moderate ethanol affects glucose absorption in vivo, 3H-OMG uptakes were conducted in isolated villus cells from Sprague-Dawley rats exposed to 1, 3, and 6 h of ethanol. Na-dependent glucose absorption was significantly decreased at all time points in ethanol-administered rats (Figure 5A; P ≤ 0.03; n = 4).
FIGURE 5.
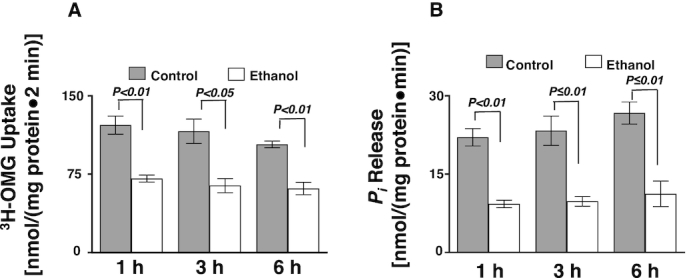
An oral gavage of ethanol significantly decreased glucose absorption and Na-K-ATPase activity in Sprague-Dawley rats. (A) Whole villus cell phlorizin-sensitive 3H-OMG uptakes were decreased in Sprague-Dawley rats exposed to ethanol (n = 4). (B) Ethanol decreased Na-K-ATPase activity in Sprague-Dawley rats (n = 4). Values represent the means ± SEMs. IEC, intestinal epithelial cell; OMG, O-methyl-d-glucose; Pi, inorganic phosphate.
Effect of ethanol on Na-K-ATPase activity in vivo
Intestinal epithelial cell Na-K-ATPase activity, as measured by the release of inorganic phosphate, was also decreased in ethanol-treated rats at all time points in vivo (Figure 5B; P ≤ 0.01; n = 4).
Effect of ethanol on Na-dependent glucose BBMV uptakes in Sprague-Dawley rats
To determine whether ethanol has a direct effect on Na-glucose co-transport in the BBM of the villus cells, BBMVs were studied. Na-dependent glucose absorption was significantly decreased in the BBMVs from ethanol-treated animals (Figure 6; P < 0.01).
FIGURE 6.
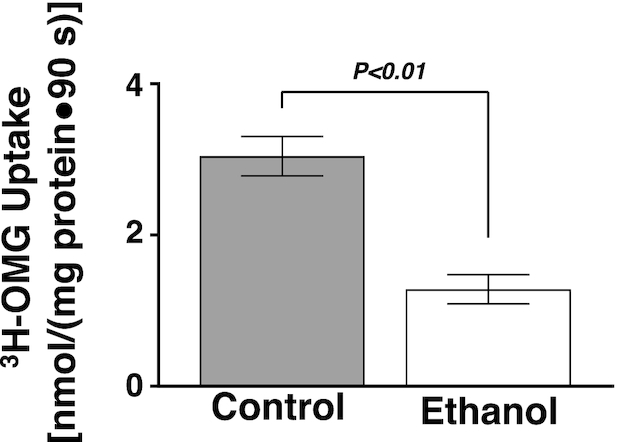
An oral gavage of ethanol significantly decreased BBMV 3H-OMG uptake in Sprague-Dawley rats (n = 4). Values represent the means ± SEMs. BBMV, brush border membrane vesicles; OMG, O-methyl-d-glucose.
Effect of ethanol on the kinetic parameters of Na-dependent glucose co-transport in Sprague-Dawley rats
Kinetic studies were conducted in BBMVs from rats exposed to ethanol for 1 h. In Sprague-Dawley rats, the affinity of the Na-dependent glucose co-transporter SGLT1 was decreased, represented by an increase in Km, when exposed to 1 h of ethanol. The mechanism of inhibition of Na-dependent glucose co-transport in vivo was secondary to a decrease in the affinity of the co-transporter for glucose (1/Km) without a change in the maximal rate of uptake of the co-transporter (Vmax) (Table 1), suggesting no reduction in SGLT1 co-transporter number, as seen in the previous in vitro studies.
Effect of in vivo ethanol consumption on SGLT1 protein expression in Sprague-Dawley rats
SGLT1 amounts in the whole cell homogenates were not significantly altered in Sprague-Dawley rats after 1 h exposure of ethanol, as quantified by densitometry (Figure 7A, B; P ≥ 0.05). Because SGLT1 is a BBM protein, Western blot analysis of SGLT1 protein was performed in the BBM as well. SGLT1 BBM immune reactive protein amounts were not significantly altered in Sprague-Dawley rats after 1 h exposure of ethanol as quantified by densitometry (Figure 7C, D; P ≥ 0.05).
FIGURE 7.
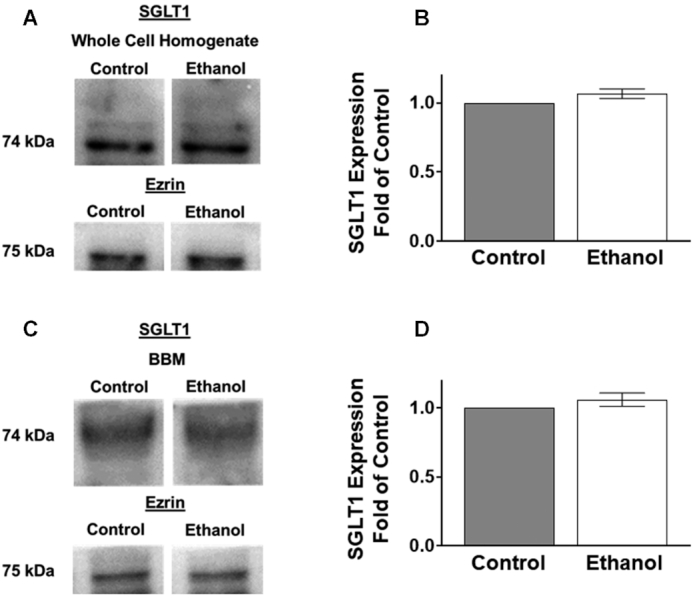
An oral gavage of ethanol in Sprague-Dawley rats did not change protein expression of SGLT1. (A) Western blot analysis of SGLT1 protein expression in whole cell homogenates from control and ethanol-treated Sprague-Dawley rats. The blots show a representative sample used for densitometric quantification. Separated control and ethanol samples were run on the same membrane but were not located next to each other. (B) Densitometric quantification of SGLT1 protein expression was not significantly changed in the whole cell homogenate fraction after 1 h exposure to ethanol (n = 4). (C) Western blot analysis of SGLT1 protein expression in the BBM from control and ethanol-treated Sprague-Dawley rats. The blots show a representative sample used for densitometric quantification. (D) Densitometric quantification of SGLT1 protein expression was not significantly altered in the BBM fraction after 1 h exposure of ethanol (n = 4). Values represent the means ± SEMs. Blots were normalized with an anti-ezrin antibody to assure equivalence of loading. All control and ethanol-treated samples were run on the same membrane. BBM, brush border membrane; SGLT1, SLC5A1.
Next, immunohistochemistry studies were performed in the small intestine of control and ethanol-treated rats (Figure 8A). Quantification of SGLT1 immunofluorescence intensity showed that control-treated rats did not significantly differ from ethanol-treated rats (Figure 8B). Furthermore, Na-K-ATPase immunofluorescence intensity also did not change between the control and ethanol-treated rats (Figure 8A, C).
FIGURE 8.
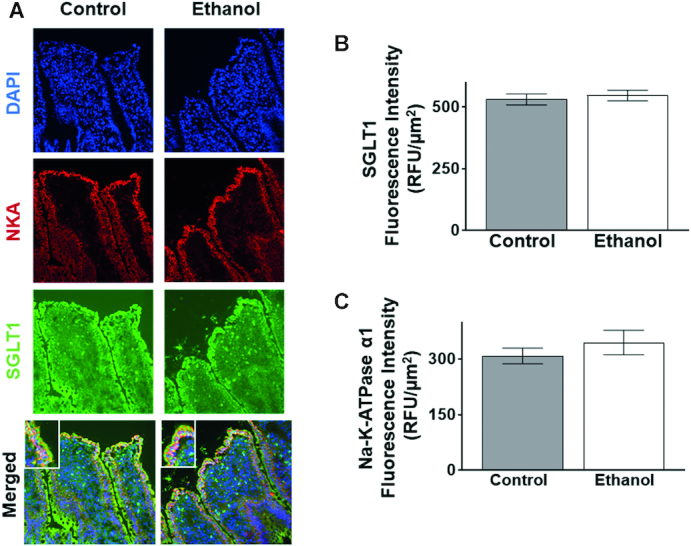
An oral gavage of ethanol in Sprague-Dawley rats did not change SGLT1 or Na-K-ATPase expression. (A) SGLT1 and Na-K-ATPase expression in Sprague-Dawley rats after exposure to 1 h of ethanol. The blue stain represents DAPI, the green stain represents SGLT1, and the red stain represents the Na-K-ATPase. SGLT1 is localized at the apical side, or BBM, of the cell while the Na-K-ATPase is localized at the BLM. (B) 1 h of ethanol did not significantly change SGLT1 immunofluorescence intensity in Sprague-Dawley rats (n = 4). (C) 1 h of ethanol did not significantly change Na-K-ATPase immunofluorescence intensity in Sprague-Dawley rats (n = 4). Each sample is an average of at least 5 different images obtained with a 20× objective. Values represent the means ± SEMs. BBM, brush border membrane; BLM, basolateral membrane; DAPI, 4',6-diamidino-2-phenylindole; SGLT1, SLC5A1.
Taken together, these molecular and kinetic data showed that ethanol, at a dosage equivalent to a BAC of 0.04%, significantly inhibited SGLT1 through a decrease in the affinity of the co-transporter without a change in the number of co-transporters in vivo. This is directly comparable to the previous in vitro studies in IEC-18 cells.
Discussion
Previous studies investigating the effect of ethanol on nutrition showed that ethanol can decrease the absorption of a wide variety of vitamins (7). Similar to our study, others have also investigated the effect of ethanol on vitamin absorption at the level of their respective co-transporters (8, 9, 34–36). Although there have been studies pertaining to nutrition and ethanol, no other study has investigated the effect of moderate ethanol on the Na-dependent glucose co-transporter SGLT1 in vitro and in vivo. SGLT1 is important because it transports glucose, an essential nutrient for intestinal cell and whole-body metabolism. Thus, the goal of this study was to investigate the effect of a moderate dose of ethanol, equivalent to a BAC of 0.04%, on Na-dependent glucose absorption in enterocytes in vitro and in vivo.
Studies conducted with the same dosage of moderate ethanol (8.64 mM) in neuronal-like pheochromocytomas cells showed no cell death after 12 h of continuous ethanol exposure (37). This directly supports our cell viability results with an LDH assay and trypan blue exclusion. This moderate dosage of ethanol did not significantly alter cell viability in IEC-18 cells.
This study showed that moderate ethanol affects glucose assimilation via SGLT1 in intestinal epithelial cells. When exposed to a moderate dose of ethanol both in vitro and in vivo, the effects of ethanol on SGLT1 are comparable. Previous studies conducted with inverted intestinal sacs showed that an extremely high dosage of ethanol (450 mM) decreased glucose absorption in the jejunum of hamsters (13, 15). This study did not determine whether SGLT1 was specifically affected by ethanol, but the researchers hypothesized that there is most likely interference of glucose absorption at the co-transporter level, which directly supports our findings.
Moreover, the present study determined that there was a decrease in the Na-K-ATPase activity in vitro and in vivo from moderate alcohol. Other studies have investigated the effect of ethanol on the Na-K-ATPase activity in hepatocyte and renal cells at concentrations equivalent to a BAC of ≥0.08%, and found that acute ethanol does decrease the activity of the Na-K-ATPase in these organs as well (38, 39). However, a previous study conducted with an extremely high dosage of ethanol (450 mM) in the jejunum of hamsters did not find a change in Na-K-ATPase activity (15). This differs from our results. It is possible that the difference between this previous study and our results stems from the differences in species, the duration of ethanol exposure, and the concentration used. Moreover, studies conducted afterward in the jejunum of hamsters showed that acute dosages of ethanol decreased the activity of the Na-K-ATPase (40), which does support our findings.
This decrease in Na-K-ATPase activity results in an altered Na gradient in response to moderate ethanol both in vitro and in vivo. Thus, at least part of the inhibition of Na-glucose co-transport at the cellular level was secondary to this altered Na-extrusion capacity of the cell. Regulation of glucose absorption has been shown in response to the inhibition of Na-K-ATPase activity in IEC-18 cells (41) and in mice, rats, and humans (42). The degree to which the Na-K-ATPase is responsible for the inhibition of glucose absorption can be further investigated. However, was the Na-dependent glucose co-transporter SGLT1 directly affected? Thus, BBMV studies were undertaken. Again, moderate ethanol reduced Na-glucose co-transport in BBMVs prepared from ethanol-treated Sprague-Dawley rats. Therefore, there are two mechanisms occurring in response to ethanol: there is a decrease in Na-dependent glucose absorption through SGLT1 at the level of the co-transporter itself as well as at the level of the Na gradient produced by the Na-K-ATPase. Previous studies examining the effect of ethanol on glucose absorption in BBMVs have found that direct incubation of the BBMVs with 4% v/v ethanol reduced the absorption of glucose, as in our studies (17).
We determined that moderate ethanol does not affect the protein expression of the SGLT1 at the whole cell homogenate and BBM levels. This has not been previously shown in the literature. Ethanol has been shown to increase the protein expression of the vitamin C co-transporters in the intestine in response to a 25% ethanol diet for 2 wk in Kunming mice (34). On the other hand, thiamine transporter-1 protein and mRNA expression levels were decreased in response to 2–6 wk of ethanol (8). Clearly, then, moderate ethanol's effect on SGLT1 is secondary to the altered affinity of the Na-dependent glucose co-transporter compared to diminished protein in the affected cells. Changes in phosphorylation and/or glycosylation may affect the affinity of SGLT1. Indeed, it has previously been shown that constitutive nitric oxide reduces SGLT1’s affinity for glucose by altering the glycosylation of the protein (23).
Many prior studies have determined the effect of large doses of ethanol on a variety of gastrointestinal functions. However, these studies have not investigated the effect of a moderate dose of ethanol. In this study, we used a moderate dose of ethanol equivalent to a BAC of 0.04%, which is achieved monthly by most of the population of the United States, making this dose very relevant (4). Clearly, this study demonstrates that even a modest dose of ethanol can have significant effects on assimilation of important nutrients in the mammalian intestine. Specifically, moderate consumption of ethanol inhibits intestinal glucose assimilation. It specifically inhibits SGLT1 via the reduced affinity of SGLT1 for glucose without a change in the number of co-transporters in enterocytes. These observations are similar both in vitro and in vivo. In conclusion, this novel study, through use of a moderate dose of ethanol, describes a possible mechanism for the onset of malnutrition commonly seen in chronic alcoholics and thus has potential implications for the treatment of moderate ethanol-dependent malnutrition.
Supplementary Material
Acknowledgments
We thank Dr Mary Louise Risher for the use of the AM1 Alcohol Analyzer (Analox). We wish to acknowledge the Marshall University Genomics Core Facility for use of FluorChem M imaging system. The facility was supported by a grant from the WV-INBRE grant (P20GM103434 from NIGMS). We wish to acknowledge the Marshall University Bioinformatics Core, specifically Jim Denvir and Todd Gress for their consultation, the COBRE ACCORD grant (1P20GM121299) and the West Virginia Clinical and Translational Science Institute (WV-CTSI) grant (2U54GM104942) for their support as well. The authors’ responsibilities were as follows—US: designed research; MB and SS: conducted research; MB and SS: analyzed data; MB, SS, JH, SA, and US: wrote the paper; MB, SS, JH, SA, and US: primary responsibility for final content; and all authors: read and approved the final manuscript.
Notes
Supported by National Institutes of Health grants DK-67420, DK-108054, and P20GM121299-01A1, and Veteran's Administration Merit Review grant BX003443-01 to US and the NASA WV Space Grant Consortium Research Fellowship to MB and US.
Author disclosures: The authors report no conflicts of interest.
The opinions in this paper and the authors are not those of the NIH.
Supplemental Figures 1–5 are available from the “Supplementary data” link in the online posting of the article and from the same link in the online table of contents at https://academic.oup.com/jn/.
Abbreviations used: BAC, blood alcohol content; BBM, brush border membrane; BBMV, brush border membrane vesicle; BLM, basolateral membrane; IEC, intestinal epithelial cell; LDH, lactate dehydrogenase; OMG, O-methyl-d-glucose; RIPA, radioimmunoprecipitation; SGLT1, SLC5A1.
References
- 1. Rehm J, Baliunas D, Borges GL, Graham K, Irving H, Kehoe T, Parry CD, Patra J, Popova S, Poznyak V et al.. The relation between different dimensions of alcohol consumption and burden of disease: an overview. Addiction. 2010;105:817–43. [DOI] [PMC free article] [PubMed] [Google Scholar]
- 2. World Health Organization. Global Status Report on Alcohol and Health. Geneva: WHO; 2018. [Google Scholar]
- 3. Substance Abuse and Mental Health Services Administration (SAMHSA). Results from the 2015 National Survey on Drug Use and Health: detailed tables. Table 2.41B: Alcohol use in lifetime, past year, and past month among persons aged 12 or older, by demographic characteristics: percentages, 2014 and 2015. Rockville (MD): SAMHSA; 2016. [Google Scholar]
- 4. National Institute on Alcohol Abuse and Alcoholism (NIAAA). Alcohol facts and statistics. Available from: https://www.niaaa.nih.gov/publications/brochures-and-fact-sheets/alcohol-facts-and-statistics. [Date last accessed: 2019 Mar 8]. [Google Scholar]
- 5. Centers for Disease Control and Prevention. Alcohol and public health. Available from: https://www.cdc.gov/alcohol/. [Date last accessed: 2019 Mar 8]. [Google Scholar]
- 6. Lieber CS. Relationships between nutrition, alcohol use, and liver disease. Alcohol Res Health. 2003;27:220–31. [PMC free article] [PubMed] [Google Scholar]
- 7. Bode C, Bode JC. Effect of alcohol consumption on the gut. Best Pract Res Clin Gastroenterol. 2003;17:575–92. [DOI] [PubMed] [Google Scholar]
- 8. Subramanya SB, Subramanian VS, Said HM. Chronic alcohol consumption and intestinal thiamin absorption: effects on physiological and molecular parameters of the uptake process. Am J Physiol Gastrointest Liver Physiol. 2010;299:G23–31. [DOI] [PMC free article] [PubMed] [Google Scholar]
- 9. Subramanian VS, Subramanya SB, Ghosal A, Said HM. Chronic alcohol feeding inhibits physiological and molecular parameters of intestinal and renal riboflavin transport. Am J Physiol Cell Physiol. 2013;305:C539–46. [DOI] [PMC free article] [PubMed] [Google Scholar]
- 10. Hamid A, Wani NA, Rana S, Vaiphei K, Mahmood A, Kaur J. Down-regulation of reduced folate carrier may result in folate malabsorption across intestinal brush border membrane during experimental alcoholism. FEBS J. 2007;274:6317–28. [DOI] [PubMed] [Google Scholar]
- 11. Coon S, Kekuda R, Saha P, Talukder JR, Sundaram U. Constitutive nitric oxide differentially regulates Na-H and Na-glucose cotransport in intestinal epithelial cells. Am J Physiol Gastrointest Liver Physiol. 2008;294:G1369–75. [DOI] [PubMed] [Google Scholar]
- 12. Lehmann A, Hornby PJ. Intestinal SGLT1 in metabolic health and disease. Am J Physiol Gastrointest Liver Physiol. 2016;310:G887–98. [DOI] [PubMed] [Google Scholar]
- 13. Dinda PK, Beck IT. On the mechanism of the inhibitory effect of ethanol on intestinal glucose and water absorption. Am J Dig Dis. 1977;22:529–33. [DOI] [PubMed] [Google Scholar]
- 14. Dinda PK, Beck IT. Ethanol-induced inhibition of glucose transport across the isolated brush-border membrane of hamster jejunum. Dig Dis Sci. 1981;26:23–32. [DOI] [PubMed] [Google Scholar]
- 15. Dinda PK, Beck IT, Beck M, McElligott TF. Effect of ethanol on sodium-dependent glucose transport in the small intestine of the hamster. Gastroenterology. 1975;68:1517–26. [PubMed] [Google Scholar]
- 16. Kaur J, Kaur M, Nagpaul JP, Mahmood A. Dietary protein regimens and chronic ethanol administration effects on sodium- and proton-dependent solute uptake in rat intestine. Alcohol. 1995;12:459–62. [DOI] [PubMed] [Google Scholar]
- 17. al-Balool F, Debnam ES. The effects of acute and chronic exposure to ethanol on glucose uptake by rat jejunal brush-border membrane vesicles. Q J Exp Physiol. 1989;74:751–3. [DOI] [PubMed] [Google Scholar]
- 18. Cobb CF, Van Thiel DH, Wargo J. Ethanol inhibition of glucose absorption in isolated, perfused small bowel of rats. Surgery. 1983;94:199–203. [PubMed] [Google Scholar]
- 19. Yunus AW, Awad WA, Kroger S, Zentek J, Bohm J. Dose-dependent increase and decrease in active glucose uptake in jejunal epithelium of broilers after acute exposure to ethanol. Alcohol. 2011;45:411–4. [DOI] [PubMed] [Google Scholar]
- 20. Money SR, Petroianu A, Kimura K, Jaffe BM. The effects of short-term ethanol exposure on the canine jejunal handling of calcium and glucose. Surgery. 1990;107:167–71. [PubMed] [Google Scholar]
- 21. Nepal N, Arthur S, Sundaram U. Unique regulation of Na-K-ATPase during growth and maturation of intestinal epithelial cells. Cells. 2019;8(6):593. [DOI] [PMC free article] [PubMed] [Google Scholar]
- 22. Gunzerath L, Faden V, Zakhari S, Warren K. National Institute on Alcohol Abuse and Alcoholism report on moderate drinking. Alcohol Clin Exp Res. 2004;28:829–47. [DOI] [PubMed] [Google Scholar]
- 23. Arthur S, Coon S, Kekuda R, Sundaram U. Regulation of sodium glucose co-transporter SGLT1 through altered glycosylation in the intestinal epithelial cells. Biochim Biophys Acta. 2014;1838:1208–14. [DOI] [PubMed] [Google Scholar]
- 24. Manoharan P, Sundaram S, Singh S, Sundaram U. Inducible nitric oxide regulates brush border membrane Na-glucose co-transport, but not Na:H exchange via p38 MAP kinase in intestinal epithelial cells. Cells. 2018;7(8):111. [DOI] [PMC free article] [PubMed] [Google Scholar]
- 25. Arthur S, Singh S, Sundaram U. Cyclooxygenase pathway mediates the inhibition of Na-glutamine co-transporter B0AT1 in rabbit villus cells during chronic intestinal inflammation. PLoS One. 2018;13:e0203552. [DOI] [PMC free article] [PubMed] [Google Scholar]
- 26. Khan-Merchant N, Penumetcha M, Meilhac O, Parthasarathy S. Oxidized fatty acids promote atherosclerosis only in the presence of dietary cholesterol in low-density lipoprotein receptor knockout mice. J Nutr. 2002;132:3256–62. [DOI] [PubMed] [Google Scholar]
- 27. Livy DJ, Parnell SE, West JR. Blood ethanol concentration profiles: a comparison between rats and mice. Alcohol. 2003;29:165–71. [DOI] [PubMed] [Google Scholar]
- 28. Sundaram U, Knickelbein RG, Dobbins JW. pH regulation in ileum: Na(+)-H+ and Cl(−)-HCO3- exchange in isolated crypt and villus cells. Am J Physiol. 1991;260:G440–449. [DOI] [PubMed] [Google Scholar]
- 29. Forbush B., 3rd Assay of Na,K-ATPase in plasma membrane preparations: increasing the permeability of membrane vesicles using sodium dodecyl sulfate buffered with bovine serum albumin. Anal Biochem. 1983;128:159–63. [DOI] [PubMed] [Google Scholar]
- 30. Talukder JR, Kekuda R, Saha P, Arthur S, Sundaram U. Identification and characterization of rabbit small intestinal villus cell brush border membrane Na-glutamine cotransporter. Am J Physiol Gastrointest Liver Physiol. 2008;295:G7–G15. [DOI] [PMC free article] [PubMed] [Google Scholar]
- 31. Singh S, Arthur S, Sundaram U. Unique regulation of Na-glutamine cotransporter SN2/SNAT5 in rabbit intestinal crypt cells during chronic enteritis. J Cell Mol Med. 2018;22:1443–51. [DOI] [PMC free article] [PubMed] [Google Scholar]
- 32. Singh S, Arthur S, Talukder J, Palaniappan B, Coon S, Sundaram U. Mast cell regulation of Na-glutamine co-transporters B0AT1 in villus and SN2 in crypt cells during chronic intestinal inflammation. BMC Gastroenterol. 2015;15:47. [DOI] [PMC free article] [PubMed] [Google Scholar]
- 33. Fisher SJ, Swaan PW, Eddington ND. The ethanol metabolite acetaldehyde increases paracellular drug permeability in vitro and oral bioavailability in vivo. J Pharmacol Exp Ther. 2010;332:326–33. [DOI] [PubMed] [Google Scholar]
- 34. Guo X, Wang Y, Shen Y, Gao Y, Chang Y, Duan X. Gene expression profiles of sodium-dependent vitamin C transporters in mice after alcohol consumption. Acta Biochim Biophys Sin (Shanghai). 2013;45:912–20. [DOI] [PubMed] [Google Scholar]
- 35. Hoyumpa AM Jr, Breen KJ, Schenker S, Wilson FA. Thiamine transport across the rat intestine. II. Effect of ethanol. J Lab Clin Med. 1975;86:803–16. [PubMed] [Google Scholar]
- 36. Romanoff RL, Ross DM, McMartin KE. Acute ethanol exposure inhibits renal folate transport, but repeated exposure upregulates folate transport proteins in rats and human cells. J Nutr. 2007;137:1260–5. [DOI] [PubMed] [Google Scholar]
- 37. Luo J, West JR, Cook RT, Pantazis NJ. Ethanol induces cell death and cell cycle delay in cultures of pheochromocytoma PC12 cells. Alcohol Clin Exp Res. 1999;23:644–56. [PubMed] [Google Scholar]
- 38. Rodrigo R, Novoa E, Thielemann L, Granata P, Videla L. Mechanism of enhancement of renal (Na(+)+K+) ATPase activity following chronic ethanol exposure. Acta Physiol Pharmacol Ther Latinoam. 1996;46:49–56. [PubMed] [Google Scholar]
- 39. Pascale R, Daino L, Garcea R, Frassetto S, Ruggiu ME, Vannini MG, Cozzolino P, Feo F. Inhibition by ethanol of rat liver plasma membrane (Na+,K+)ATPase: protective effect of S-adenosyl-L-methionine, L-methionine, and N-acetylcysteine. Toxicol Appl Pharmacol. 1989;97:216–29. [DOI] [PubMed] [Google Scholar]
- 40. Hoyumpa AM Jr, Patwardhan R, Antonson D, Nichols S, Gray JP. Effect of thiamin deficiency and acute ethanol ingestion on jejunal glucose transport in rats. Am J Clin Nutr. 1981;34:14–9. [DOI] [PubMed] [Google Scholar]
- 41. Manoharan P, Gayam S, Arthur S, Palaniappan B, Singh S, Dick GM, Sundaram U. Chronic and selective inhibition of basolateral membrane Na-K-ATPase uniquely regulates brush border membrane Na absorption in intestinal epithelial cells. Am J Physiol Cell Physiol. 2015;308:C650–6. [DOI] [PMC free article] [PubMed] [Google Scholar]
- 42. Palaniappan B, Arthur S, Sundaram VL, Butts M, Sundaram S, Mani K, Singh S, Nepal N, Sundaram U. Inhibition of intestinal villus cell Na/K-ATPase mediates altered glucose and NaCl absorption in obesity-associated diabetes and hypertension. FASEB J. 2019;33:9323–33. [DOI] [PMC free article] [PubMed] [Google Scholar]
Associated Data
This section collects any data citations, data availability statements, or supplementary materials included in this article.


