

Abstract
Background
Phosphate binders are commonly used in the treatment of patients with hyperphosphatemia. While phosphate binders are used to lower phosphate, the effects of specific phosphate binder types on vitamin D metabolism are unknown.
Methods
We performed a secondary analysis of the Phosphate Normalization Trial in which patients with moderate to advanced chronic kidney disease were randomized to receive either placebo, sevelamer carbonate, lanthanum carbonate or calcium acetate for 9 months. We evaluated changes in serum concentrations of vitamin D metabolites including 24,25-dihydroxyvitamin D3 [24,25(OH)2D3], 1,25-dihydroxyvitamin D3 [1,25(OH)2D3], the ratio of 24,25(OH)2D3 to 25-hydroxyvitamin D [the vitamin D metabolite ratio (VMR)] and the ratio of serum 1,25(OH)2D to 25-hydroxyvitamin D.
Results
Compared with placebo, randomization to the calcium acetate arm was associated with a 0.6 ng/mL (95% CI 0.2, 1) and 13.5 pg/ng (95% CI 5.5, 21.5) increase in 24,25(OH)2D and VMR, respectively, and a 5.2 pg/mL (95% CI 1.1, 9.4) reduction in 1,25(OH)2D. Randomization to sevelamer carbonate was associated with a 0.5 ng/mL (95% CI −0.9, −0.1) and 11.8 pg/ng (95% CI −20, −3.5) reduction in 24,25(OH)2D3 and VMR, respectively. There was no association of the sevelamer arm with the change in 1,25(OH)2D3, and randomization to lanthanum carbonate was not associated with a change in any of the vitamin D metabolites.
Conclusion
Administration of different phosphate binders to patients with moderate to severe CKD results in unique changes in vitamin D metabolism.
Keywords: chronic renal insufficiency, CKD-MBD, mineral metabolism, phosphate binders, vitamin D
Graphical Abstract
Graphical Abstract.

INTRODUCTION
Dietary phosphate binders are commonly prescribed to patients with chronic kidney disease (CKD) to lower serum phosphate concentration, with the overall goal of reducing morbidity and mortality associated with CKD–mineral and bone disorder (CKD-MBD) [1]. However, CKD-MBD is a complex disorder involving a network of interrelated regulatory hormones and metabolic pathways. Therefore phosphate binders may have effects beyond phosphate balance. Moreover, different types of phosphate binders may have differential effects on CKD-MBD. For example, compared with calcium-based phosphate binders, noncalcium-based phosphate binders are less effective at preventing the progression of secondary hyperparathyroidism but reduce the progression of vascular calcification, although these studies were not placebo controlled [2, 3].
Impaired vitamin D metabolism is a hallmark of CKD-MBD [4]. In CKD, CYP27B1-mediated production of 1,25-dihydroxyvitamin D [1,25(OH)2D, or calcitriol, the active hormonal form of vitamin D] from 25-hydroxyvitamin D [25(OH)D] is reduced (Figure 1). Additionally, CYP24A1-mediated clearance of 25(OH)D through 24,25-dihydroxyvitamin D [24,25(OH)2D] may also be reduced [5, 6]. This decrease in 24,25(OH)2D, presumably due to a loss of renal mass or tubular function, occurs despite increases in fibroblast growth factor 23 (FGF-23) in CKD, which are thought to increase CYP24A1-mediated clearance of 25(OH)D. Thus CKD appears to be a state of vitamin D metabolic stagnation [4].
FIGURE 1.
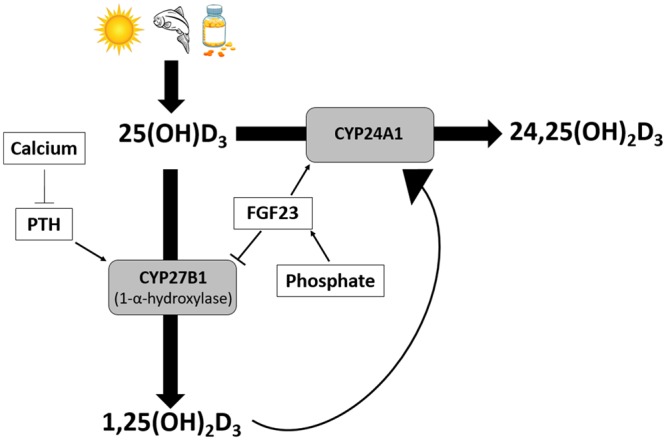
Regulation of vitamin D metabolism.
Decreased serum concentrations of 1,25(OH)2D and 24,25(OH)2D may lead to adverse outcomes in CKD. Animal experimental models demonstrate that deficient 1,25(OH)2D promotes inflammation and fibrosis in the kidneys, heart and other organs [7–10]. Epidemiologic studies have observed associations of low circulating concentrations of 1,25(OH)2D or 24,25(OH)2D with hyperparathyroidism, fractures, CKD progression, cardiovascular events and death, although clinical trials using vitamin D analogs have yielded mixed results [11–17].
We examined the effects of three phosphate binders on circulating vitamin D metabolites in a post hoc analysis of the Phosphate Normalization Trial (PNT), a randomized clinical trial [2]. We hypothesized that phosphate binders, compared with placebo, would increase concentrations of 1,25(OH)2D and 24,25(OH)2D and the ratios of these metabolites with their enzymatic substrate [vitamin D metabolite ratios (VMRs), reflecting activities of CYP27B1 and CYP24A1, respectively], with heterogeneity by phosphate binder type. Specifically, we hypothesized that calcium acetate would decrease activation of 25(OH)D to 1,25(OH)2D and increase clearance through conversion to 24,25(OH)2D, compared with sevelamer and lanthanum carbonate, due to the effect of calcium on vitamin D metabolism.
MATERIALS AND METHODS
Study population
The PNT was a randomized, double-blind, placebo-controlled trial of phosphate binders in patients with CKD. Details of the study design have been published elsewhere [2]. Briefly, 148 persons with CKD, an estimated glomerular filtration rate (eGFR) between 20 and 45 mL/min/1.73 m2 and a serum phosphate concentration between 2.5 and 6.0 mg/dL were recruited into this study. This was a single-center study that occurred between February 2009 and September 2010 in Denver (Denver Nephrologists, Denver, CO, USA). Notably, participants could not be taking a phosphate binder, calcimimetic or any active vitamin D prior to the study. Participants were randomized to either lanthanum carbonate, sevelamer carbonate or calcium acetate in a 1:1:1 design. Participants were then randomized within each arm to either active drug or placebo (3:2). Drug dosing was increased if the serum phosphate remained >3.5 mg/dL. Details of the dosing scheme are described elsewhere [2]. Participants were also given 1000 IU of cholecalciferol daily, initiated at randomization. The intended duration of participation in the trial was 9 months. For this study, we excluded seven study participants who had no available vitamin D measurements at any point in the study because of inadequate sample volume (Figure 2), leaving a final analytic population of 141.
FIGURE 2.

Cohort diagram for PNT.
Vitamin D measurements
Samples were collected during study visits at baseline as well as Months 1, 3, 6 and 9. Participants had fasted for ≥8 h at the time of blood sampling. Samples were stored at −70°C from collection in 2009–10 until testing in 2015. Vitamin D metabolites have been shown to remain stable across multiple freeze–thaw cycles [18]. We measured serum vitamin D metabolites including 24,25(OH)2D3, 25(OH)D3, 25(OH)D2, 1,25(OH)2D3 and 1,25(OH)2D2 using a single aliquot at each time point of measurement. Measurements were performed at the University of Washington by immunoaffinity extraction and high-performance liquid chromatography (HPLC)-mass spectrometry (Xevo TQ, Waters Corp., Milford, MA, USA) with deuterated internal standards [19, 20]. The lower limit of quantification for 24,25(OH)2D3, 25(OH)D3, 25(OH)D2, 1,25(OH)2D3 and 1,25(OH)2D2 were 0.06, 1.0 and 0.2 ng/mL and 3.4 and 2.8 pg/mL, respectively. The interassay precision for 24,25(OH)2D3, 25(OH)D3, 25(OH)D2, 1,25(OH)2D3 and 1,25(OH)2D2 was 2.6, 3.0, 4.7, 10.0 and 10.9%, respectively. We calculate the VMR by dividing the serum 24,25(OH)2D3 concentration by the serum 25(OH)D3 concentration and multiplying by 1000, with units of pg/ng.
Other measurements
Trained personnel performed interviews and obtained participant demographics. We measured serum calcium and phosphate by indirect potentiometry on a DxC Synchron analyzer (Beckman-Coulter, Brea, CA, USA) and with the timed-rate colorimetric reaction method, respectively. We measured parathyroid hormone (PTH) using the Unicell Dxl Clinical Analyzer (Beckman-Coulter). We measured C-terminal FGF-23 using the second generation C-terminal enzyme-linked immunosorbent assay (ELISA) assay (Immutopics, San Clemente, CA, USA). We measured Intact FGF-23 using a sandwich immunoassay (Kainos Laboratories, Tokyo, Japan). We measured serum creatinine using a standard AutoAnalyzer (Quest Diagnostics, Secaucus, NJ, USA) and calculated eGFR using the Modification of Diet in Renal Disease equation.
Statistical methods
We summarized demographic and clinical characteristics in the study population with mean and standard deviation (SD) for continuous variables or number and percent for categorical variables. In the primary analysis, we used a linear mixed model approach to evaluate the effects of the intervention on vitamin D metabolites in an intention-to-treat analysis. For many participants (n = 53), vitamin D measurements were missing for one or more visits because of inadequate sample volume; all participants in the analytic population (n = 141) were nevertheless included in the primary analysis using all available data. In a sensitivity analysis, we repeated the analyses described above, including only participants in whom a baseline and follow-up measure were ascertained (‘complete case’). The primary analysis tested differences by treatment assignment in the change in vitamin D metabolite concentrations, adjusted for age, sex, race and baseline weight. We likewise tested for differences by treatment in the change in 25(OH)D concentrations, the ratio of 1,25(OH)2D3 to 25(OH)D3 (ratio of active compound to substrate) and the VMR. In the exploratory analysis, we combined the noncalcium-based binders (sevelamer carbonate and lanthanum carbonate) together and compared them with the placebo and calcium acetate arms and assessed for all outcomes using the same methodology. We considered P-values <0.05 as statistically significant for all analyses. All analyses were conducted using the R computing environment, version 3.4.0 (R Foundation for Statistical Computing, Vienna, Austria).
RESULTS
Study participants
We studied 141 of 148 participants in the PNT in our primary analyses (Table 1). Of those, 88 were included in complete case analyses (Figure 2). The clinical characteristics of the primary analysis population and complete case population were similar to those of the overall trial (Supplementary data, Table S1). The mean age of the primary analysis population was 66.4 (SD 11.9) years, 50% were male and 80% were Caucasian. The mean eGFR of the cohort was 30.8 (SD 7.3) mL/min/1.73 m2. The mean phosphate at baseline was 4.2 (SD 0.4) mg/dL. Nearly all (98%) of the population was taking vitamin D supplementation at baseline. The baseline mean of 25(OH)D3, 25(OH)D2, 24,25(OH)2D3 and 1,25(OH)2D3 was 27.7 (SD 13.5), 3.0 (SD 5.7), 2.5 (SD 1.7) ng/mL and 21.9 (SD 10.4) pg/mL, respectively. The mean ratio of 1,25(OH)2D3 to 25(OH)D3 and VMR was 0.9 (SD 0.5) pg/ng and 87.9 (SD 35.4) pg/ng, respectively. Compared with placebo, participants randomized to calcium acetate, sevelamer carbonate and lanthanum carbonate experienced a 0.2 (95% CI 0.0, –0.5), 0.1 (95% CI −0.2, –0.4) and 0.2 (95% CI 0.0, –0.5) mg/dL reduction in serum phosphate, respectively.
Table 1.
Baseline characteristics of the primary analysis population (N = 141)
| Baseline factors | Overall | Placebo | Lanthanum | Sevelamer | Calcium |
|---|---|---|---|---|---|
| n | 141 | 55 | 27 | 29 | 30 |
| Demographics | |||||
| Age (years) | 66.4 (11.9) | 64.7 (12.4) | 68.6 (11.3) | 66.1 (11.8) | 67.7 (11.7) |
| Male, n (%) | 71 (50) | 28 (51) | 15 (56) | 14 (48) | 14 (47) |
| Race/ethnicity, n (%) | |||||
| White | 113 (80) | 43 (78) | 23 (85) | 23 (79) | 24 (80) |
| Black | 16 (11) | 6 (11) | 3 (11) | 2 (7) | 5 (17) |
| BMI (kg/m2) | 31.4 (7.1) | 31.9 (7.7) | 29.8 (6.6) | 33.0 (7.7) | 30.5 (5.3) |
| Comorbidities, n (%) | |||||
| Diabetes | 79 (56) | 32 (58) | 14 (52) | 16 (55) | 17 (57) |
| Congestive heart failure | 28 (20) | 6 (11) | 5 (19) | 7 (24) | 10 (33) |
| Coronary artery disease | 29 (21) | 8 (15) | 5 (19) | 7 (24) | 9 (30) |
| Hypertension | 139 (99) | 55 (100) | 27 (100) | 28 (97) | 29 (97) |
| Myocardial infarction | 14 (10) | 3 (5) | 1 (4) | 7 (24) | 3 (10) |
| Peripheral vascular disease | 30 (21) | 10 (18) | 5 (19) | 6 (21) | 9 (30) |
| Cerebrovascular accident | 8 (6) | 2 (4) | 3 (11) | 1 (3) | 2 (7) |
| Secondary hyperparathyroidism | 100 (71) | 39 (71) | 20 (74) | 18 (62) | 23 (77) |
| Nontraumatic fracture | 25 (18) | 10 (18) | 2 (7) | 7 (24) | 6 (20) |
| Laboratory characteristics | |||||
| Serum phosphorus (mg/dL) | 4.2 (0.4) | 4.2 (0.4) | 4.2 (0.4) | 4.2 (0.4) | 4.2 (0.4) |
| Serum albumin (g/dL) | 4.2 (0.3) | 4.1 (0.3) | 4.2 (0.2) | 4.2 (0.3) | 4.2 (0.3) |
| Serum calcium (mg/dL) | 9.3 (0.4) | 9.3 (0.4) | 9.2 (0.5) | 9.3 (0.5) | 9.3 (0.3) |
| Intact PTH (pg/mL), median (IQR) | 65.0 (39.0–113.0) | 80.0 (46.5–125.5) | 65.0 (34.0–109.5) | 55.0 (37.0–85.0) | 60.0 (44.2–98.8) |
| C-terminal FGF-23 (RU/mL), median (IQR) | 229.0 (144.1–321.4) | 228.7 (149.3–292.9) | 253.2 (126.1–367.7) | 230.7 (175.4–345.4) | 222.8 (158.2–288.7) |
| Intact FGF-23 (pg/mL), median (IQR) | 120.9 (89.6–176.1) | 118.8 (91.5–174.1) | 107.2 (64.3–193.6) | 150.1 (108.2–205.6) | 110.4 (89.6–154.3) |
| Hemoglobin (g/dL) | 13.3 (1.6) | 13.5 (1.7) | 13.1 (1.6) | 13.5 (1.6) | 12.8 (1.4) |
| eGFR (mL/min/1.73 m2) | 30.8 (7.3) | 29.5 (7.1) | 33.2 (7.4) | 30.9 (7.5) | 30.7 (6.9) |
| Total urinary excretion of phosphorus (mg) | 776.9 (347.2) | 802.8 (305.0) | 729.9 (483.0) | 797.5 (310.6) | 751.6 (317.1) |
| Fractional excretion of phosphorus (%) | 0.31 (0.11) | 0.31 (0.10) | 0.30 (0.13) | 0.33 (0.12) | 0.33 (0.11) |
| Total urinary excretion of calcium (mg), median (IQR) | 42.0 (31.2–71.0) | 43.4 (27.5–80.9) | 34.4 (28.5–59.1) | 42.2 (33.0–66.5) | 41.6 (34.1–88.2) |
| Total urinary excretion of protein (mg), median (IQR) | 216.0 (119.2–1188.4) | 365.5 (140.0–1611.0) | 150.0 (96.5–705.0) | 401.3 (133.0–1462.0) | 156.0 (96.0–273.0) |
| Vitamin D supplementation | 138 (98) | 53 (96) | 27 (100) | 29 (100) | 29 (97) |
Values are presented as mean (SD) unless stated otherwise.
Changes in vitamin D metabolites
Temporal changes in vitamin D metabolites within treatment arms are described in Table 2 and Figure 3. Notably, participants randomized to calcium acetate experienced an increase in 24,25(OH)2D3 and the VMR while participants randomized to noncalcium-based binders experienced an increase in 1,25(OH)2D3. Results were similar in our complete case-sensitivity analysis.
Table 2.
Distributions of vitamin D metabolite concentrations by time and treatment group
| Time (months from randomization) |
|||||
|---|---|---|---|---|---|
| Vitamin D Metabolite | 0 | 1 | 3 | 6 | 9 |
| Participants, n | |||||
| Placebo | 36 | 52 | 48 | 42 | 29 |
| Lanthanum | 19 | 24 | 23 | 20 | 8 |
| Sevelamer | 17 | 29 | 26 | 23 | 18 |
| Calcium | 18 | 28 | 27 | 23 | 13 |
| Total 25(OH)D (ng/mL) | |||||
| Placebo | 30.2 (10.4) | 30.6 (7.5) | 31.8 (6.9) | 32.0 (7.8) | 32.3 (8.4) |
| Lanthanum | 33.0 (13.9) | 31.6 (9.6) | 33.1 (10.3) | 33.8 (11.9) | 36.4 (8.5) |
| Sevelamer | 30.1 (10.0) | 30.6 (6.4) | 30.1 (7.0) | 28.8 (7.7) | 29.7 (7.2) |
| Calcium | 29.8 (10.9) | 32.1 (9.0) | 34.5 (10.0) | 35.4 (10.5) | 35.9 (8.8) |
| 25(OH)D3 (ng/mL) | |||||
| Placebo | 27.9 (12.9) | 28.6 (9.3) | 30.5 (8.1) | 30.8 (8.8) | 31.2 (9.4) |
| Lanthanum | 30.7 (15.9) | 28.9 (12.0) | 31.1 (12.0) | 31.7 (13.7) | 33.4 (13.9) |
| Sevelamer | 24.7 (14.0) | 27.0 (9.1) | 27.9 (8.9) | 27.3 (8.1) | 28.6 (7.6) |
| Calcium | 27.0 (11.7) | 30.3 (9.6) | 32.4 (10.6) | 33.4 (12.1) | 34.2 (9.3) |
| 1,25(OH)2D3 (pg/mL) | |||||
| Placebo | 21.9 (10.8) | 24.1 (10.1) | 24.7 (10.5) | 24.7 (10.4) | 24.7 (9.8) |
| Lanthanum | 22.9 (11.2) | 25.5 (11.0) | 28.8 (13.2) | 27.4 (14.6) | 26.7 (15.2) |
| Sevelamer | 19.2 (10.9) | 18.3 (8.3) | 21.5 (8.1) | 21.4 (10.3) | 25.7 (16.6) |
| Calcium | 23.4 (8.5) | 20.7 (8.6) | 19.0 (8.3) | 20.0 (10.6) | 18.1 (8.4) |
| 24,25(OH)2D3 (ng/mL) | |||||
| Placebo | 2.5 (1.5) | 2.5 (1.4) | 2.6 (1.3) | 2.7 (1.3) | 2.8 (1.6) |
| Lanthanum | 3.1 (2.2) | 3.1 (1.9) | 3.2 (1.8) | 3.2 (2.0) | 2.9 (1.1) |
| Sevelamer | 2.5 (1.8) | 2.6 (1.3) | 2.6 (1.3) | 2.5 (1.4) | 2.1 (1.0) |
| Calcium | 2.0 (1.3) | 2.5 (1.3) | 3.0 (1.4) | 3.1 (1.3) | 3.1 (1.3) |
| 1,25(OH)2D3:25(OH)D3 (pg/ng) | |||||
| Placebo | 0.87 (0.40) | 0.87 (0.33) | 0.83 (0.35) | 0.81 (0.30) | 0.85 (0.41) |
| Lanthanum | 0.93 (0.63) | 1.00 (0.54) | 1.00 (0.47) | 0.93 (0.40) | 0.89 (0.40) |
| Sevelamer | 0.83 (0.30) | 0.73 (0.33) | 0.82 (0.34) | 0.82 (0.35) | 0.94 (0.50) |
| Calcium | 1.02 (0.50) | 0.73 (0.34) | 0.63 (0.34) | 0.71 (0.51) | 0.60 (0.46) |
| 24,25(OH)2D3:25(OH)2D3 (pg/ng) | |||||
| Placebo | 86.0 (29.8) | 82.7 (34.4) | 83.1 (30.9) | 85.6 (35.7) | 85.0 (34.5) |
| Lanthanum | 96.5 (32.6) | 102.6 (41.6) | 100.4 (36.9) | 103.1 (40.9) | 90.7 (16.7) |
| Sevelamer | 99.2 (45.7) | 94.3 (37.7) | 92.3 (37.7) | 90.2 (39.6) | 75.5 (30.6) |
| Calcium | 72.2 (34.0) | 82.1 (36.1) | 92.1 (36.7) | 95.7 (34.1) | 91.1 (25.4) |
Values are presented as mean (SD) unless stated otherwise.
FIGURE 3.
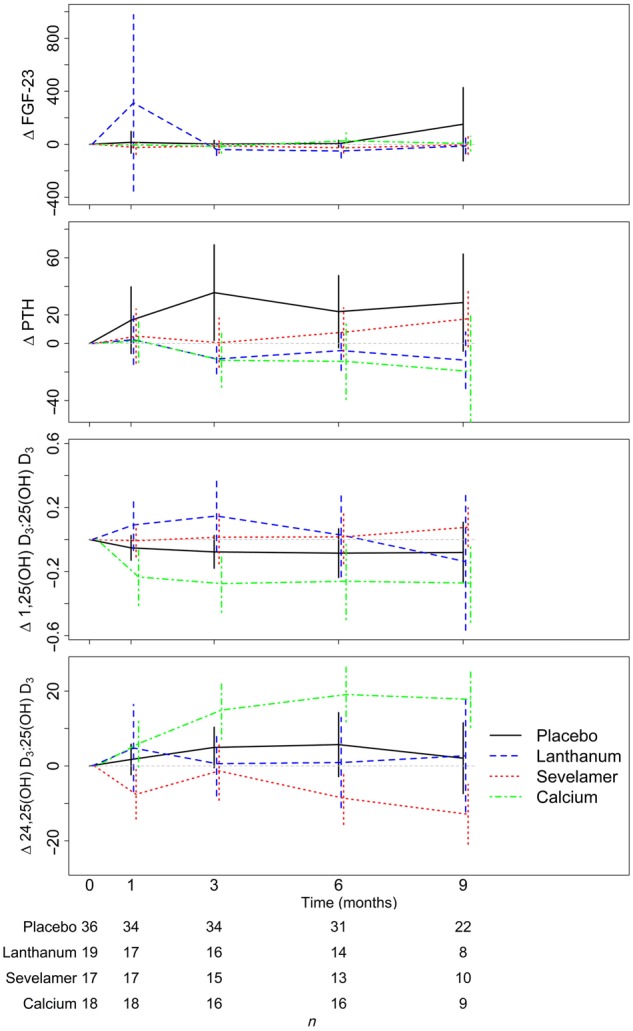
Change in FGF-23, PTH and vitamin D metabolite ratios in PNT, by group and time.
We then compared changes in vitamin D metabolites between treatment arms. In the fully adjusted model, there was a significant effect of treatment arm on the change in 24,25(OH)2D3 and the VMR (P-int <0.001). Compared with placebo, randomization to the calcium acetate arm resulted in a 0.6 ng/mL (95% CI 0.2, –1) and 13.5 pg/µg (95% CI 5.5, –21.5) greater increase in 24,25(OH)2D3 and VMR, respectively (Table 3). Randomization to sevelamer resulted in a 0.5 ng/mL (95% CI −0.9 to −0.1) and 11.8 pg/ng (95% CI −20 to −3.5) reduction in 24,25(OH)2D3 and VMR, respectively. Randomization to lanthanum did not significantly change serum 24,25(OH)2D3 or the VMR. After combining the noncalcium-containing phosphate binder arms, compared with placebo, randomization to this combined group resulted in a 0.4 mg/mL (95% CI 0.1, –0.7) and 6.1 pg/ng (95% CI −0.6, –12.8) reduction in 24,25(OH)2D3 and VMR, respectively (Supplementary data, Table S2). Results were similar in our complete case-sensitivity analysis (Supplementary data, Tables S3 and S4).
Table 3.
Adjusted differences in vitamin D metabolite concentrations, by treatment group and comparing Months 3, 6 and 9 to baseline, for primary analytic population (N = 141)
| Difference in time trend (95% CI) |
||||
|---|---|---|---|---|
| Treatment group | 1,25(OH)2D3 (pg/mL) | 24,25(OH)2D3 (ng/mL) | 1,25(OH)2D3:25(OH)D3 (pg/ng) | 24,25(OH)2D3:25(OH)2D3 (pg/ng) |
| Placebo | 0 (Ref.) | 0 (Ref.) | 0 (Ref.) | 0 (Ref.) |
| Lanthanum | 4 (−0.3, –8.2) | −0.3 (−0.7, –0.1) | 0.13 (−0.03, –0.3) | −0.3 (−8.5, –7.9) |
| Sevelamer | 0.3 (−3.9, –4.6) | −0.5 (−0.9 to −0.1) | 0.12 (−0.05, –0.28) | −11.8 (−20 to −3.5) |
| Calcium | −5.2 (−9.4 to −1.1) | 0.6 (0.2, –1) | −0.21 (−0.37 to −0.05) | 13.5 (5.5, –21.5) |
| P-value | 0.003 | <0.001 | <0.001 | <0.001 |
Entries are modeled differences in time trends (between time t ≥ 3 and baseline), comparing the treatment group to placebo (i.e. interaction parameter estimates), in a model that adjusts for age, sex, race (white/black/other) and baseline weight. P-value tests for any difference in time trend among all treatments.
In the fully adjusted model, there was a significant effect of treatment arm on the change in 1,25(OH)2D3 and the 1,25(OH)2D3:25(OH)D3 ratio (P-int <0.01) (Table 3). Randomization to the calcium acetate arm resulted in a 5.2 pg/mL (95% CI 1.1, –9.4) and a 0.21 pg/ng (95% CI 0.05, –0.37) reduction in 1,25(OH)2D3 and the 1,25(OH)2D3:25(OH)D3 ratio, respectively. Randomization to sevelamer or lanthanum did not result in a significant change in 1,25(OH)2D3 or the 1,25(OH)2D3:25(OH)D3 ratio. After combining the noncalcium-containing phosphate binder arms, we did not find a significant increase in 1,25(OH)2D3, but the 1,25(OH)2D3:25(OH)D3 ratio was modestly increased compared with placebo [0.1 pg/ng (95% CI 0.0, –0.3)] (Supplementary data, Table S2). Results were similar in our complete case-sensitivity analysis (Supplementary data, Tables S3 and S4).
There was a significant effect of treatment arm on total 25(OH)D3 concentrations (P = 0.04). While compared with placebo there were no significant changes in 25(OH)D3, we did find that compared with the calcium acetate group, there was a relative decrease in 25(OH)D3 in the noncalcium-containing binder arms (Supplementary data, Table S4). Lastly, similar to the overall original study population, there was no significant effect of treatment arm on C-terminal FGF-23 (P-int = 0.75).
DISCUSSION
This study demonstrates the differential effects of phosphate binders on vitamin D metabolites in persons with moderate to advanced CKD. We demonstrate that compared with placebo, calcium acetate increased clearance of 25(OH)D3 to 24,25(OH)2D3 and decreased 25(OH)D3 activation to 1,25(OH)2D3. Conversely, sevelamer carbonate decreased 25(OH)D3 clearance. While lanthanum carbonate did not yield a significant change in the studied metabolites, when combined with sevelamer we found that randomization to noncalcium-containing binders decreased 25(OH)D3 clearance. Lastly, we found some suggestions that noncalcium-containing binders may decrease 25(OH)D3 concentrations, possibly through effects on intestinal absorption of vitamin D supplements.
The 24,25(OH)2D and the VMR have been hypothesized to be markers of vitamin D adequacy [21, 22]. In our prior work we demonstrated that 24,25(OH)2D and the VMR have been shown to be lower in CKD, a state of stagnant vitamin D metabolism [6, 13, 23]. Additionally, lower values of 24,25(OH)2D and the VMR have been associated with secondary hyperparathyroidism, lower bone density and an increased risk of hip fracture and death [6, 11, 12]. However, to date, there are limited data on ways to increase these parameters. Stubbs et al. [24] first showed that 24,25(OH)2D increases with cholecalciferol supplementation, although the increase was more limited in persons with CKD. Additionally, we have previously demonstrated that ergocalciferol and paricalcitol supplementation increases 24,25(OH)2D and the VMR in persons with and without CKD [25, 26]. Recently, Berg et al. [27] confirmed that administration of ergocalciferol can effectively increase 24,25(OH)2D. In this analysis we demonstrate that 24,25(OH)2D concentrations can be modified by interventions other than vitamin D supplementation, specifically by administration of calcium acetate or sevelamer carbonate. While decreased intestinal absorption of phosphate appears to decrease vitamin D clearance (as evidenced by the sevelamer carbonate group), we hypothesize that this effect was overridden by the effects of calcium in the calcium acetate group. One possible mechanism for this effect is calcium supplementation (via calcium acetate) decreases PTH production and this in turn leads to decreased 1,25(OH)2D production and more vitamin D clearance by downregulating CYP27B1 and upregulating CYP24A1 [28]. In contrast, sevelamer carbonate may have led to decreased vitamin D clearance through inhibition of FGF-23. While sevelamer has been shown to lower FGF-23 in several clinical trials [29, 30], sevelamer did not significantly change FGF-23 in the current trial, perhaps related to high variability in FGF-23, relatively small sample size and missing data. There is also evidence that dietary phosphate restriction can decrease CYP24A1 activity and vitamin D clearance through effects of growth hormone and insulin-like growth factor 1, independent of FGF-23 [31]. This may explain why we found a decrease in vitamin D clearance after sevelamer treatment without a significant change in FGF-23.
Serum 1,25(OH)2D is associated with progression of CKD and all-cause mortality [7, 32]. Typically 1,25(OH)2D deficiency can be treated with a vitamin D receptor agonist (VDRA), although studies evaluating the use of VDRAs on cardiovascular outcomes have had mixed results [33, 34]. Here we demonstrate that 1,25(OH)2D concentrations can be altered via the use of phosphate binders. Specifically, 1,25(OH)2D concentrations can be increased by the use of noncalcium-containing binders and decreased by the use of calcium-containing phosphate binders. Similar pathways invoked to explain the changes in 24,25(OH)2D can be used to explain the changes in 1,25(OH)2D. As serum phosphate concentrations decrease with phosphate binders, there may be a similar reduction in FGF-23, with decreased vitamin D clearance and shunting toward activation, although we do not observe this change in FGF-23 here. Alternatively, considering lanthanum drove up vitamin D activation more than sevelamer, this may be due to the fact that sevelamer may increase calcium absorption compared with lanthanum [35]. In contrast, when calcium-containing binders have used the effect of calcium supplementation rather than phosphate, reduction may become the primary driver of vitamin D activation. Specifically, calcium will decrease PTH production and thus can suppress CYP27B1 and vitamin D activation.
Higher 24,25(OH)2D and VMR are thought to reflect a higher tissue-level vitamin D. As concentrations of vitamin D and 1,25(OH)2D increase, there is a feedback mechanism, shunting 25(OH)D toward 24,25 (OH)2D in order to prevent tissue-level toxicity [22]. Thus with increased vitamin D receptor activity, there is thought to be a resultant increase in 24,25(OH)2D and the VMR. While prior studies have shown a possible protective effect of a higher 24,25(OH)2D, 1,25(OH)2D and VMR, it remains unclear if driving these values up with the use of a calcium or noncalcium-containing phosphate binder will provide clinical benefit [6, 7, 11, 12, 32]. We have hypothesized that higher 24,25(OH)2D and VMR are biomarkers of 1,25(OH)2D tissue-level concentration, and thus if these levels are increased via alternative mechanisms, like the use of phosphate binders, they would not afford similar benefits. Prior studies have demonstrated that different phosphate binders may have differing clinical consequences, specifically, that calcium-based binders increase the risk of vascular calcification compared with sevelamer [2, 36, 37]. A relatively large clinical trial comparing the effects of calcium-containing phosphate binders and sevelamer on survival showed no significant difference overall, although subgroup analyses showed a significant benefit on survival in elderly (>65 years of age) patients [38]. Our findings suggest that decreases in 1,25(OH)2D concentrations among persons treated with calcium-containing binders may be a possible mediator of the association between calcium-containing binders and vascular calcification and mortality.
The strengths of this study include the randomized design, allowing for evaluation of unconfounded effects of phosphate binders on vitamin D metabolites. We have extensive high-quality measurements of multiple vitamin D metabolites that allowed us to assess for the effects of binders on multiple different metabolites. Additionally, this study evaluated a population with moderate to advanced CKD in which changes in phosphate from binders may be more pronounced than in early CKD. This study also has some important limitations. First, while participants were diverse by age, sex, race/ethnicity and other clinical characteristics, they were cared for in one metropolitan area by a single nephrology practice, thus results may not be fully generalizable to the larger population of patients with moderate to advanced CKD in the USA or elsewhere. Second, there were missing data for a relatively high number of participants. However, since these data were generally unavailable due to insufficient sample volume, the missingness was likely ‘missing at random’, a scenario in which linear mixed modeling yields unbiased effect estimates. Third, we assessed biomarker outcomes that provide information on pathophysiology and the risk of CKD complications but may not translate to clinical outcomes. Additionally, the trial was conducted before iron-based phosphate binders were commercially available, thus the effects of this class of phosphate binders could not be assessed. Lastly, phosphate binders are far more widely used in end-stage renal disease (ESRD) than CKD, and the results of these findings may not be generalizable to patients with more advanced CKD and ESRD. Despite these limitations, our findings may help us better understand the mechanisms underlying CKD-MBD and how some processes leading to clinical manifestations of CKD-MBD may be interrupted.
In summary, administration of different phosphate binder classes to patients with moderate to severe CKD results in distinct changes in vitamin D metabolism. While serum phosphate and vitamin D metabolite concentrations have often been thought of as separate potential therapeutic targets, our work demonstrates that there is considerable overlap in the treatment of these parameters. Additionally, our work suggests a potential mechanism for the differences in clinical outcomes between patients treated with calcium versus noncalcium-containing phosphate binders. Further studies are necessary to evaluate the effects of other phosphate-lowering drugs, including iron-based phosphate binders, on vitamin D metabolism as well as clinical outcomes including fractures, vascular calcification, cardiovascular disease and death.
Supplementary Material
ACKNOWLEDGEMENTS
We thank all the patients who participated in this trial.
FUNDING
This work was supported by the National Insitutes of Health (NIH) and the National Institute of Diabetes and Digestive and Kidney Diseases (K23 DK118197 to C.G.) and the NIH Loan Repayment Program (to C.G.), together with additional support from an unrestricted fund from the Northwest Kidney Centers. Funding for the initial investigator-initiated Phosphate Normalization Trial was provided by Shire, Fresenius, Genzyme, Denver Nephrologists, Novartis and DaVita.
AUTHORS’ CONTRIBUTIONS
C.G., L.R.Z., M.C. and I.H.d.B. participated in developing the research idea, data analysis and manuscript preparation. G.A.B., G.M.C. and B.K. participated in the initial trial design and manuscript preparation. A.H. participated in data acquisition and manuscript preparation.
CONFLICT OF INTEREST STATEMENT
G.A.B. reports a consulting agreement with Kirin and equity in Ardelyx.
REFERENCES
- 1. Ketteler M, Block GA, Evenepoel P. et al. Diagnosis, evaluation, prevention, and treatment of chronic kidney disease-mineral and bone disorder: synopsis of the Kidney Disease: Improving Global Outcomes 2017 Clinical Practice Guideline Update. Ann Intern Med 2018; 168: 422–430 [DOI] [PubMed] [Google Scholar]
- 2. Block GA, Wheeler DC, Persky MS. et al. Effects of phosphate binders in moderate CKD. J Am Soc Nephrol 2012; 23: 1407–1415 [DOI] [PMC free article] [PubMed] [Google Scholar]
- 3. Russo D, Miranda I, Ruocco C. et al. The progression of coronary artery calcification in predialysis patients on calcium carbonate or sevelamer. Kidney Int 2007; 72: 1255–1261 [DOI] [PubMed] [Google Scholar]
- 4. Bosworth C, de Boer IH.. Impaired vitamin D metabolism in CKD. Semin Nephrol 2013; 33: 158–168 [DOI] [PMC free article] [PubMed] [Google Scholar]
- 5. Levin A, Bakris GL, Molitch M. et al. Prevalence of abnormal serum vitamin D, PTH, calcium, and phosphorus in patients with chronic kidney disease: results of the study to evaluate early kidney disease. Kidney Int 2007; 71: 31–38 [DOI] [PubMed] [Google Scholar]
- 6. de Boer IH, Sachs MC, Chonchol M. et al. Estimated GFR and circulating 24,25-dihydroxyvitamin D3 concentration: a participant-level analysis of 5 cohort studies and clinical trials. Am J Kidney Dis 2014; 64: 187–197 [DOI] [PMC free article] [PubMed] [Google Scholar]
- 7. Qu H, Lin K, Wang H. et al. 1,25(OH)D3improves cardiac dysfunction, hypertrophy, and fibrosis through PARP1/SIRT1/mTOR-related mechanisms in type 1 diabetes. Mol Nutr Food Res 2017; 61: 6100338. [DOI] [PubMed] [Google Scholar]
- 8. Gao L, Cao JT, Liang Y. et al. Calcitriol attenuates cardiac remodeling and dysfunction in a murine model of polycystic ovary syndrome. Endocrine 2016; 52: 363–373 [DOI] [PubMed] [Google Scholar]
- 9. Maquigussa E, Arnoni CP, Pereira LG. et al. Calcitriol ameliorates renal damage in a pre-established proteinuria model. Mol Med Rep 2015; 12: 1009–1015 [DOI] [PMC free article] [PubMed] [Google Scholar]
- 10. Duran A, Hernandez ED, Reina-Campos M. et al. p62/SQSTM1 by binding to vitamin D receptor inhibits hepatic stellate cell activity, fibrosis, and liver cancer. Cancer Cell 2016; 30: 595–609 [DOI] [PMC free article] [PubMed] [Google Scholar]
- 11. Ginsberg C, Katz R, de Boer IH. et al. The 24,25 to 25-hydroxyvitamin D ratio and fracture risk in older adults: the Cardiovascular Health Study. Bone 2018; 107: 124–130 [DOI] [PMC free article] [PubMed] [Google Scholar]
- 12. Selamet U, Katz R, Ginsberg C. et al. Serum calcitriol concentrations and kidney function decline, heart failure, and mortality in elderly community-living adults persons: the Health, Aging and Body Composition Study. Am J Kidney Dis 2018; 72: 419–428 [DOI] [PMC free article] [PubMed] [Google Scholar]
- 13. Bosworth CR, Levin G, Robinson-Cohen C. et al. Kidney the serum 24,25-dihydroxyvitamin D concentration, a marker of vitamin D catabolism, is reduced in chronic kidney disease. Kidney Int 2012; 82: 693–700 [DOI] [PMC free article] [PubMed] [Google Scholar]
- 14. Kendrick J, Cheung AK, Kaufman JS. et al. Associations of plasma 25-hydroxyvitamin D and 1,25-dihydroxyvitamin D concentrations with death and progression to maintenance dialysis in patients with advanced kidney disease. Am J Kidney Dis 2012; 60: 567–575 [DOI] [PMC free article] [PubMed] [Google Scholar]
- 15. Kendrick J, Andrews E, You Z. et al. Cholecalciferol, calcitriol, and vascular function in CKD: a randomized, double-blind trial. Clin J Am Soc Nephrol 2017; 12: 1438–1446 [DOI] [PMC free article] [PubMed] [Google Scholar]
- 16. Keyzer CA, van Breda GF, Vervloet MG. et al. Effects of vitamin D receptor activation and dietary sodium restriction on residual albuminuria in CKD: the ViRTUE-CKD Trial. J Am Soc Nephrol 2017; 28: 1296–1305 [DOI] [PMC free article] [PubMed] [Google Scholar]
- 17. Kendrick J, Cheung AK, Kaufman JS. et al. Associations of plasma 25-hydroxyvitamin D and 1,25-dihydroxyvitamin D concentrations with death and progression to maintenance dialysis in patients with advanced kidney disease. Am J Kidney Dis 2012; 60: 567–575 [DOI] [PMC free article] [PubMed] [Google Scholar]
- 18. Phinney KW. Development of a standard reference material for vitamin D in serum. Am J Clin Nutr 2008; 88: 511S–512S [DOI] [PubMed] [Google Scholar]
- 19. Strathmann FG, Laha TJ, Hoofnagle AN.. Quantification of 1α,25-dihydroxy vitamin D by immunoextraction and liquid chromatography-tandem mass spectrometry. Clin Chem 2011; 57: 1279–1285 [DOI] [PMC free article] [PubMed] [Google Scholar]
- 20. Laha TJ, Strathmann FG, Wang Z. et al. Characterizing antibody cross-reactivity for immunoaffinity purification of analytes prior to multiplexed liquid chromatography-tandem mass spectrometry. Clin Chem 2012; 58: 1711-1716 [DOI] [PMC free article] [PubMed] [Google Scholar]
- 21. Berg AH, Powe CE, Evans MK. et al. 24,25-dihydroxyvitamin D3 and vitamin D status of community-dwelling black and white Americans. Clin Chem 2015; 61: 877–884 [DOI] [PMC free article] [PubMed] [Google Scholar]
- 22. Jones G, Prosser DE, Kaufmann M.. 25-Hydroxyvitamin D-24-hydroxylase (CYP24A1): its important role in the degradation of vitamin D. Arch Biochem Biophys 2012; 523: 9–18 [DOI] [PubMed] [Google Scholar]
- 23. Dai B, David V, Alshayeb HM. et al. Assessment of 24,25(OH)2D levels does not support FGF23-mediated catabolism of vitamin D metabolites. Kidney Int 2012; 82: 1061–1070 [DOI] [PMC free article] [PubMed] [Google Scholar]
- 24. Stubbs JR, Zhang S, Friedman PA, Nolin TD.. Decreased conversion of 25-hydroxyvitamin D3 to 24,25-dihydroxyvitamin D3 following cholecalciferol therapy in patients with CKD. Clin J Am Soc Nephrol 2014; 9: 1965–1973 [DOI] [PMC free article] [PubMed] [Google Scholar]
- 25. Batacchi Z, Robinson-Cohen C, Hoofnagle AN. et al. Effects of vitamin D2 supplementation on vitamin D3 metabolism in health and CKD. Clin J Am Soc Nephrol 2017; 12: 1498–1506 [DOI] [PMC free article] [PubMed] [Google Scholar]
- 26. de Boer IH, Sachs M, Hoofnagle AN. et al. Paricalcitol does not improve glucose metabolism in patients with stage 3–4 chronic kidney disease. Kidney Int 2013; 83: 323–330 [DOI] [PMC free article] [PubMed] [Google Scholar]
- 27. Berg AH, Bhan I, Powe C. et al. Acute homeostatic changes following vitamin D2 supplementation. J Endocr Soc 2017; 1: 1135–1149 [DOI] [PMC free article] [PubMed] [Google Scholar]
- 28. Melamed ML, Chonchol M, Gutiérrez OM. et al. The role of vitamin D in CKD stages 3 to 4: report of a scientific workshop sponsored by the National Kidney Foundation. Am J Kidney Dis 2018; 72: 834–845 [DOI] [PMC free article] [PubMed] [Google Scholar]
- 29. Koiwa F, Kazama JJ, Tokumoto A. et al. Sevelamer hydrochloride and calcium bicarbonate reduce serum fibroblast growth factor 23 levels in dialysis patients. Ther Apher Dial 2005; 9: 336–339 [DOI] [PubMed] [Google Scholar]
- 30. Yilmaz MI, Sonmez A, Saglam M. et al. Comparison of calcium acetate and sevelamer on vascular function and fibroblast growth factor 23 in CKD patients: a randomized clinical trial. Am J Kidney Dis 2012; 59: 177–185 [DOI] [PubMed] [Google Scholar]
- 31. Wu S, Grieff M, Brown AJ.. Regulation of renal vitamin D-24-hydroxylase by phosphate: effects of hypophysectomy, growth hormone and insulin-like growth factor I. Biochem Biophys Res Commun 1997; 233: 813–817 [DOI] [PubMed] [Google Scholar]
- 32. Inaguma D, Nagaya H, Hara K. et al. Relationship between serum 1,25-dihydroxyvitamin D and mortality in patients with pre-dialysis chronic kidney disease. Clin Exp Nephrol 2008; 12: 126–131 [DOI] [PubMed] [Google Scholar]
- 33. Shoji T, Inaba M, Fukagawa M. et al. Effect of oral alfacalcidol on clinical outcomes in patients without secondary hyperparathyroidism receiving maintenance hemodialysis: the J-DAVID Randomized Clinical Trial. JAMA 2018; 320: 2325–2334 [DOI] [PMC free article] [PubMed] [Google Scholar]
- 34. Teng M, Wolf M, Ofsthun MN. et al. Activated injectable vitamin D and hemodialysis survival: a historical cohort study. J Am Soc Nephrol 2005; 16: 1115–1125 [DOI] [PubMed] [Google Scholar]
- 35. Behets GJ1, Dams G, Damment SJ. et al. Differences in gastrointestinal calcium absorption after the ingestion of calcium-free phosphate binders. Am J Physiol Renal Physiol 2014; 306: F61–F67 [DOI] [PubMed] [Google Scholar]
- 36. Block GA, Spiegel DM, Ehrlich J. et al. Effects of sevelamer and calcium on coronary artery calcification in patients new to hemodialysis. Kidney Int 2005; 68: 1815–1824 [DOI] [PubMed] [Google Scholar]
- 37. St Peter WL, Liu J, Weinhandl E. et al. A comparison of sevelamer and calcium-based phosphate binders on mortality, hospitalization, and morbidity in hemodialysis: a secondary analysis of the Dialysis Clinical Outcomes Revisited (DCOR) randomized trial using claims data. Am J Kidney Dis 2008; 51: 445–454 [DOI] [PubMed] [Google Scholar]
- 38. Suki WN, Zabaneh R, Cangiano JL. et al. Effects of sevelamer and calcium-based phosphate binders on mortality in hemodialysis patients. Kidney Int 2007; 72: 1130–1137 [DOI] [PubMed] [Google Scholar]
Associated Data
This section collects any data citations, data availability statements, or supplementary materials included in this article.