Abstract
Background: Of scientometric goals are to explore scientific productivity and trend, elicit scientific collaborations and inter/intra and cross disciplinary relations within a realm of study. This is a descriptive scientometric analysis of Medical Journal of the Islamic Republic of Iran (MJIRI) from 1987 to 2018.
Methods: The data were collected from 1987 to 2018 including the MJIRI annual publication number, annual growth rate (AGR), annual citation indicators, annual degree of collaboration (DC), the most active universities, and the most co-occurred keywords being used in MJIRI articles.
Results: MJIRI has published 2166 articles in the field of health and medicine between 1987 and 2018, over a third of which have been published during the last five years (2014-2018). The highest and lowest AGR were recorded in 2014 (AGR=276.190%) and 2001(AGR=-28.75%), respectively. The journal CiteScore has increased from 0.26 in 2013 to 0.94 in 2018; the SCImago Journal Rank has promoted from 0.123 in 2013 to 0.320 in 2018. The Source Normalized Impact per Paper has enhanced from 0.398 in 2013 to 0.552 in 2018. The overall degree of collaboration of MJIRI articles was 0.89. Also, the most co-occurred keywords pertaining to the specific field of medicine were "Breast cancer", "Pregnancy", "Tuberculosis", and "Hypertension".
Conclusion: The current quantitative evaluation of MJIRI provides a holistic landscape of journal performance for 32 years.
Keywords: Scientometrics, Bibliometrics, Medical Journal of the Islamic Republic of Iran, Productivity
↑ What is “already known” in this topic:
The scientometric analysis of science has been widely employed to explore the scientific production of countries, academic institutions, universities, journals, and individual researchers.
→ What this article adds:
Analysis of the Medical Journal of the Islamic Republic of Iran illustrated several trends in publishing a scientific journal in field of health, some of which including: dominance of multiauthorship vs single-authorship and publishing more at each volume annually. These may be related to either/both economic interests of publishers or/and exponentially accelerating development of science.
Introduction
Scientometrics investigates hidden relations and connections within scientific fields and subfields through citation analysis methods. Scientometrics mostly examines scientific productivity and trends through various disciplines (1). Scientometrics has been widely used to calculate the scientific productions per individual researchers, journals, universities or academic institutions, and even countries. For example, Mahmudi et al. (2) reported the most productive scientific institutes among Iranian research centers for biomedical sciences based on the number of publicatio ns indexed either in Scopus or Web of Science (WoS) during 1991 to 2010 were “Drug Applied Research Center of Tabriz University of Medical Sciences” with 369 (Scopus) and 408 (WoS) publications, followed by “Royan Institute” with 314 and 362 publications. Additionally, these centers the most cited institutions in either Scopus or WoS compared to the other Iranian research centers (2). Asadi H et al. studied the Iranian Biomedical Journal (IBJ) between 2000 and 2017 and reported that its Scopus Quartile ranking has improved from Q4 in 2000 to Q2 in 2016. International contribution to IBJ was 10% of which the UK researchers have had the leading role (3). Kalita evaluated the Nature’s 8335 articles published between 2006 and 2015 and reported that 147 articles were conducted by single authors with an average collaboration degree of 0.98. University of California and Harvard University had the highest contributions with 16.11% and 12.57% and the United States’ authors participated in 70.39% of all articles (4).
Scientometric analysis also provides a clear roadmap of scientific growth over time (1, 5-7). For instance, in Iran, especially in the field of medical sciences, the growth of science has been remarkable during the last decade and according to the Scopus metrics of 2015, Iran has had the most publications as well as the most citations in 2015 among the Islamic countries and also in the Middle East (8).
Therefore, in the present study, we aim to conduct a scientometric analysis of the Medical Journal of the Islamic Republic of Iran (MJIRI) from 1987 to 2018. MJIRI (accessible at http://mjiri.iums.ac.ir) is an open-access peer-reviewed journal with continuous online updating policy, which publishes articles from almost all medical sciences disciplines. MJIRI is currently being indexed by Scopus, PubMed, PubMed Central, etc. Through this study, we intended to show chronological publishing trend of articles, articles’ annual growth rate (AGR), chronological trend of its citation metrics (including Source Normalized Impact per Paper (SNIP), SCImago Journal Rank (SJR), and CiteScore), chronological authorship trend (single vs multiple authorship), the universities with the highest number of articles published in MJIRI, and the most co-occurrences of keywords appeared in titles, abstracts and article Keywords.
Methods
All articles published in MJIRI from 1987 to 2018, i.e. 2166 articles were included. The used indicators were distribution of the number of published articles in issues & volumes, the annual growth rate (AGR) of articles, the annual authorship pattern of articles (the distribution of single-authored, two-authored, three-authored or more than three-authored articles), the annual degree of collaboration (DC), the universities with the highest number of articles published in MJIRI, and the citation indicators. The data were extracted and analyzed through Microsoft Excel software and Graph Pad Prism software.
The annual growth rate (AGR) determines how much the value of journal based on the number of its publications changes during a year and is calculated by (5): AGR= (End value – First value)/First value * 100
The degree of collaboration (DC) is the ratio of the research papers carried out by multiple authors to the total number of research papers in the discipline during a given period of time, usually a year and is calculated by Subramanyam formula (1983) (9):
DC=No. of multiple-authored articles during a specific year/ (No. of single-author and multiple-author articles during the same year)
Furthermore, the MJIRI’s CiteScore, Source Normalized Impact per Paper (SNIP), SCImago Journal Rank (SJR) and its quartile trend from 2013 to 2018, using Scopus and Scimagojr databases were studied. The CiteScore of a journal is determined by dividing total citations of a given year dedicated to the last three years’ articles by the total number of last three years’ articles and is derived from the Scopus (10). The SNIP corrects the differences of citation impact between different subject fields through source normalizing approach (3, 11). Scopus derived indicators were extracted for 2013-2018 period since the MJIRI has not been indexed by the Scopus earlier this time.
Additionally, we analyzed the most dominant co-occurred keywords of abstracts and created a co-occurrences network of the most dominant keywords using VOSviewer software (12). The keywords were obtained from the titles, abstracts, as well as the papers’ Keywords.
It is noteworthy that since the affiliation of the corresponding authors only were fully mentioned in the MJIRI website, the assessment of the participation by universities/institutions was carried out based on the information collected from the MJIRI website; articles with incomplete information were excluded from the analysis.
Results
Chronological publishing trend of MJIRI articles
The MJIRI was established in the year 1987 with 16 articles in the area of medicine. Since then, this journal had published articles in this area mostly on a quarterly basis until 2013 and since then, it has published articles continuously as they become ready for publication. Since 2014, as for continuously updating publishing policy, the journal publishes one issue per volume annually, thus, the number of articles published in one issue shows an increase from an average of 10 articles per issue by the end of 2013 to an average of 150 articles in each issue after 2014. The chronologic analysis of journal productivity based on the number of articles published each year between 1987 and 2018 shows the most productive years of MJIRI are 2016, 2014, 2015, 2017, and 2018 with 166, 158, 154, 139, and 135 articles, respectively. Except for 1987 with only 16 articles, the least productive years of MJIRI are 1991, 2012, 2008, and 2009 with 33, 36, 40, and 40 publications, respectively. Interestingly, more than a third (34.72%) of all 2166 MJIRI articles published up to the end of 2018 have been appeared during 2014-2018 with an average of 150 articles per year. The average journal productivity during 1987-2018 was 67.68 articles per year. The details of annual journal productivity based on the number of volumes, issues, articles in each issue, and total articles published each year during the study period are shown in Table 1.
Table 1. The annual journal productivity based on the volume number, issues in each volume, articles in each issue, and total articles published each year from 1987 to 2018.
| Year | Volume | Issue | Number of articles for each issue | Total | ||||||
| 1987 | 1 | 1 | 16 | 16 | ||||||
| 1988 | 2 | 1 | 2 | 3 | 15 | 18 | 14 | 47 | ||
| 1989 | 2 | 4 | 15 | 45 | ||||||
| 3 | 1&2 | 3&4 | 18 | 12 | ||||||
| 1990 | 4 | 1 | 2 | 3 | 4 | 12 | 12 | 11 | 11 | 46 |
| 1991 | 5 | 1&2 | 3&4 | 14 | 19 | 33 | ||||
| 1992 | 6 | 1 | 2 | 3 | 15 | 15 | 14 | 44 | ||
| 1993 | 6 | 4 | 18 | 61 | ||||||
| 7 | 1 | 2 | 3 | 15 | 12 | 16 | ||||
| 1994 | 7 | 4 | 10 | 49 | ||||||
| 8 | 1 | 2 | 3 | 15 | 14 | 10 | ||||
| 1995 | 8 | 4 | 14 | 57 | ||||||
| 9 | 1 | 2 | 3 | 12 | 14 | 17 | ||||
| 1996 | 9 | 4 | 18 | 67 | ||||||
| 10 | 1 | 2 | 3 | 19 | 12 | 18 | ||||
| 1997 | 10 | 4 | 14 | 74 | ||||||
| 11 | 1 | 2 | 3 | 19 | 22 | 19 | ||||
| 1998 | 11 | 4 | 22 | 83 | ||||||
| 12 | 1 | 2 | 3 | 20 | 24 | 17 | ||||
| 1999 | 12 | 4 | 17 | 64 | ||||||
| 13 | 1 | 2 | 3 | 15 | 17 | 15 | ||||
| 2000 | 13 | 4 | 16 | 80 | ||||||
| 14 | 1 | 2 | 3 | 22 | 18 | 24 | ||||
| 2001 | 14 | 4 | 23 | 57 | ||||||
| 15 | 1 | 2 | 3 | 11 | 11 | 12 | ||||
| 2002 | 15 | 4 | 11 | 49 | ||||||
| 16 | 1 | 2 | 3 | 13 | 13 | 12 | ||||
| 2003 | 16 | 4 | 14 | 64 | ||||||
| 17 | 1 | 2 | 3 | 16 | 16 | 18 | ||||
| 2004 | 17 | 4 | 17 | 70 | ||||||
| 18 | 1 | 2 | 3 | 18 | 18 | 17 | ||||
| 2005 | 18 | 4 | 19 | 69 | ||||||
| 19 | 1 | 2 | 3 | 18 | 15 | 17 | ||||
| 2006 | 19 | 4 | 16 | 50 | ||||||
| 20 | 1 | 2 | 3 | 12 | 10 | 12 | ||||
| 2007 | 20 | 4 | 12 | 42 | ||||||
| 21 | 1 | 2 | 3 | 10 | 10 | 10 | ||||
| 2008 | 21 | 4 | 10 | 40 | ||||||
| 22 | 1 | 2 | 3 | 10 | 10 | 10 | ||||
| 2009 | 22 | 4 | 10 | 40 | ||||||
| 23 | 1 | 2 | 3 | 10 | 10 | 10 | ||||
| 2010 | 23 | 4 | 10 | 41 | ||||||
| 24 | 1 | 2 | 3 | 10 | 10 | 11 | ||||
| 2011 | 24 | 4 | 11 | 48 | ||||||
| 25 | 1 | 2 | 3 | 4 | 9 | 9 | 10 | 9 | ||
| 2012 | 26 | 1 | 2 | 3 | 4 | 8 | 9 | 10 | 9 | 36 |
| 2013 | 27 | 1 | 2 | 3 | 4 | 9 | 9 | 11 | 13 | 42 |
| 2014 | 28 | 1 | 158 | 158 | ||||||
| 2015 | 29 | 1 | 154 | 154 | ||||||
| 2016 | 30 | 1 | 166 | 166 | ||||||
| 2017 | 31 | 1 | 139 | 139 | ||||||
| 2018 | 32 | 1 | 135 | 135 | ||||||
The AGR of MJIRI articles
The annual growth rate (AGR) indicates the amount of change in the journal publications over a year. As illustrated in Figure 1, the AGR of MJIRI articles has many fluctuations during the study period. The highest growth rate belongs to the year 2014 (AGR=276.190%), followed by the year 1988 (AGR=193.75%) and the lowest growth rates in the years 2001, 1991, and 2006 with AGR of -28.75%, -28.26%, and -27.54%, respectively. Table 2 shows the AGR of MJIRI articles between 1988 and 2018 as well as the cumulative percentage of journal publications during this period.
Fig. 1.
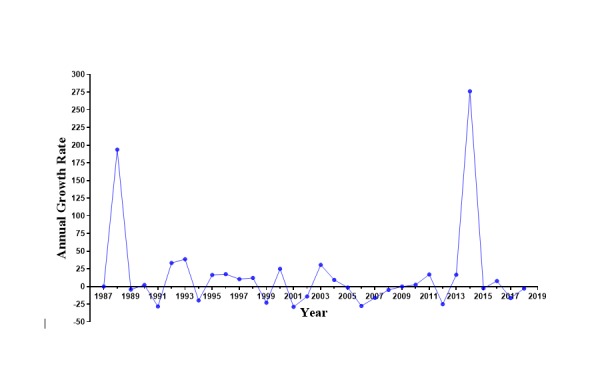
Annual growth rate of MJIRI articles
Table 2. The annual growth rate (AGR) of MJIRI articles .
| Year | Articles | AGR (%) |
| 1987 | 16 | 0 |
| 1988 | 47 | 193.75 |
| 1989 | 45 | -4.255 |
| 1990 | 46 | 2.222 |
| 1991 | 33 | - 28.260 |
| 1992 | 44 | 33.333 |
| 1993 | 61 | 38.636 |
| 1994 | 49 | -19.672 |
| 1995 | 57 | 16.326 |
| 1996 | 67 | 17.543 |
| 1997 | 74 | 10.447 |
| 1998 | 83 | 12.162 |
| 1999 | 64 | -22.891 |
| 2000 | 80 | 25 |
| 2001 | 57 | -28.75 |
| 2002 | 49 | -14.035 |
| 2003 | 64 | 30.612 |
| 2004 | 70 | 9.375 |
| 2005 | 69 | -1.428 |
| 2006 | 50 | -27.536 |
| 2007 | 42 | -16 |
| 2008 | 40 | -4.761 |
| 2009 | 40 | 0 |
| 2010 | 41 | 2.5 |
| 2011 | 48 | 17.073 |
| 2012 | 36 | -25 |
| 2013 | 42 | 16.666 |
| 2014 | 158 | 276.190 |
| 2015 | 154 | -2.531 |
| 2016 | 166 | 7.792 |
| 2017 | 139 | -16.265 |
| 2018 | 135 | -2.877 |
| Total | 2166 |
The citation metrics (SNIP, SJR, and CiteScore) analysis of MJIRI
We assessed the impact of MJIRI from 2013 to 2018 using the Scopus metrics like SNIP, SJR, and CiteScore. As illustrated in Figure 2a, MJIRI CiteScore has increased during these 6 years, from the CiteScore of 0.26 in 2013 to 0.94 in 2018 with the highest CiteScore of 1 in 2017. These statistics based on the Scopus’ quartile system fall in Q3, Q2 and Q1, respectively; which indicates that the impact of MJIRI has gradually improved over the recent years. Similar to CiteScore growth curve, Figure 2b demonstrates that the SJR score of MJIRI has been increasing during this period, from SJR of 0.123 (SJR Quartile: Q4) in 2013 to SJR of 0.320 (SJR Quartile: Q3) in 2018 with the highest SJR of 0.364 (SJR Quartile: Q3) in 2017. Besides, the SNIP score analysis of MJIRI reveals some ups and downs during the past six years as it drops slightly from 0.398 in 2013 to 0.337 in 2015 and then dramatically increases to 0.616 in 2016, and again falls to 0.477 in 2017 and once again grows to 0.552 in 2018. However, as is well observable in Figure 2c, the overall value of SNIP is growing during this period. The details of annual Scopus metrics for the MJIRI impact assessment from 2013 to 2018 are shown in Table 3.
Table 3. The citation metrics of MJIRI during 2013-2018 .
| Year | SNIP | SJR | CiteScore | Scimago Quartile (SJR) | Scopus Quartile (CiteSore) |
| 2013 | 0.398 | 0.123 | 0.26 | Q4 | Q3 |
| 2014 | 0.343 | 0.151 | 0.52 | Q3 | Q2 |
| 2015 | 0.337 | 0.22 | 0.61 | Q3 | Q2 |
| 2016 | 0.616 | 0.3 | 0.64 | Q3 | Q3 |
| 2017 | 0.477 | 0.364 | 1 | Q3 | Q1 |
| 2018 | 0.552 | 0.320 | 0.94 | Q3 | Q2 |
Fig. 2a.
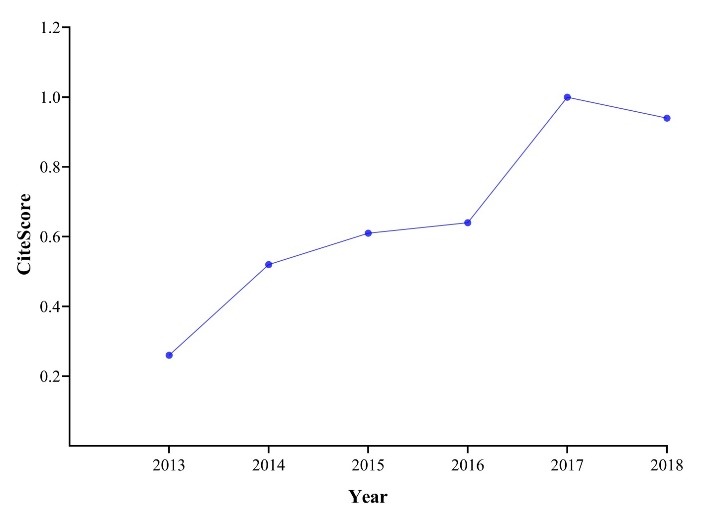
CiteScore trend of MJIRI during 2013-2018
Fig. 2b.
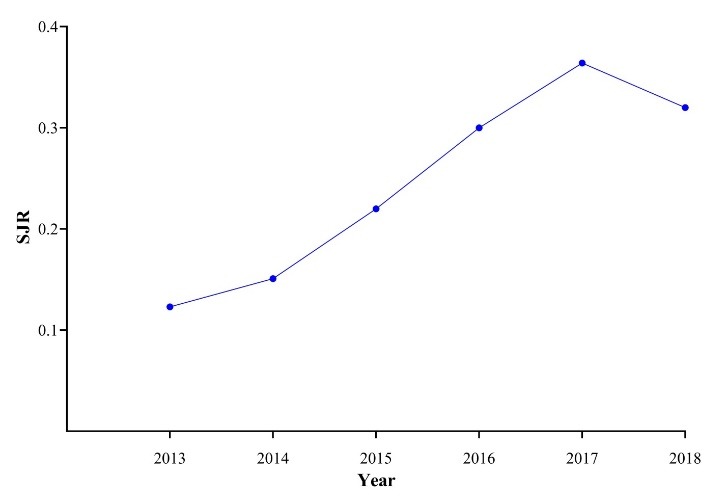
SJR trend of MJIRI during 2013-2018
Fig. 2c .
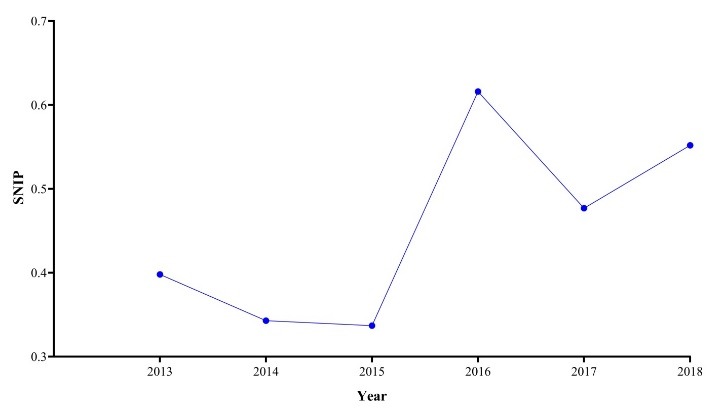
SNIP trend of MJIRI during 2013-2018
Authorship trend of MJIRI articles overtime and the co-authorship network analysis
The annual authorship trend of published articles in MJIRI over the period of 1987 to 2018 is shown in Table 4. In total, there are 218 single-authored articles (10% of all 2166 articles), 442 two-authored articles (20.4%), 447 three-authored articles (20.6%) and 1059 over three-authored articles (48.9%) in MJIRI during this period.
Table 4. The authorship Pattern of MJIRI articles based on the number of authors in each article .
| Year | Authorship Pattern | Total | |||
| Single author | Two Authors | Three Authors | More than 3 Authors | ||
| 1987 | 3 | 6 | 4 | 3 | 16 |
| 1988 | 17 | 12 | 10 | 8 | 47 |
| 1989 | 12 | 12 | 8 | 13 | 45 |
| 1990 | 12 | 15 | 6 | 13 | 46 |
| 1991 | 6 | 10 | 8 | 9 | 33 |
| 1992 | 23 | 7 | 8 | 6 | 44 |
| 1993 | 18 | 22 | 14 | 7 | 61 |
| 1994 | 10 | 18 | 14 | 7 | 49 |
| 1995 | 11 | 17 | 15 | 14 | 57 |
| 1996 | 8 | 21 | 19 | 19 | 67 |
| 1997 | 8 | 36 | 14 | 16 | 74 |
| 1998 | 16 | 23 | 21 | 23 | 83 |
| 1999 | 10 | 28 | 14 | 12 | 64 |
| 2000 | 8 | 29 | 23 | 20 | 80 |
| 2001 | 7 | 16 | 17 | 17 | 57 |
| 2002 | 5 | 14 | 17 | 13 | 49 |
| 2003 | 10 | 19 | 20 | 15 | 64 |
| 2004 | 4 | 22 | 15 | 29 | 70 |
| 2005 | 5 | 16 | 12 | 36 | 69 |
| 2006 | 3 | 13 | 20 | 14 | 50 |
| 2007 | 1 | 10 | 10 | 21 | 42 |
| 2008 | 0 | 5 | 13 | 22 | 40 |
| 2009 | 2 | 4 | 8 | 26 | 40 |
| 2010 | 0 | 2 | 8 | 31 | 41 |
| 2011 | 4 | 6 | 5 | 33 | 48 |
| 2012 | 2 | 3 | 5 | 26 | 36 |
| 2013 | 2 | 7 | 9 | 24 | 42 |
| 2014 | 2 | 11 | 27 | 118 | 158 |
| 2015 | 3 | 9 | 23 | 119 | 154 |
| 2016 | 3 | 14 | 21 | 128 | 166 |
| 2017 | 1 | 5 | 19 | 114 | 139 |
| 2018 | 2 | 10 | 20 | 103 | 135 |
| Total | 218 | 442 | 447 | 1059 | 2166 |
| % | 10.06 | 20.40 | 20.63 | 48.89 | 100.00 |
To draw the author's collaboration pattern for MJIRI articles, we divided all articles into two categories: single-authored articles and multiple-authored articles. The trend of single vs multiple-authored articles published from 1987 to 2018 is shown in Figure 3, which shows the journal’s interest toward publishing multi-author articles vs single-author articles. The annual degree of collaboration in shown in Table 5. Since all articles published in 2008 and 2010 were conducted by multiple authors, the degree of collaboration for these years is calculated as 1, followed by 2017 (DC=0.99), 2018 (DC=0.98), 2016 (DC=0.98), and 2015 (DC=0.98). The least collaboration degree belongs to the year 1992 (DC=0.42) depicting more single-author articles and fewer multi-author articles. Besides, the overall degree of collaboration in MJIRI during 1987-2018 is 0.89 and merely 10% of all MJIRI articles were single-authored.
Fig. 3.

Single vs multiple-author articles from 1987 to 2018
Table 5. The annual degree of collaboration (DC) to MJIRI’s articles .
| Year | Single author | Multiple author | Total | DC |
| 1987 | 3 | 13 | 16 | 0.81 |
| 1988 | 17 | 30 | 47 | 0.63 |
| 1989 | 12 | 33 | 45 | 0.73 |
| 1990 | 12 | 34 | 46 | 0.73 |
| 1991 | 6 | 27 | 33 | 0.81 |
| 1992 | 23 | 21 | 44 | 0.47 |
| 1993 | 18 | 43 | 61 | 0.70 |
| 1994 | 10 | 39 | 49 | 0.79 |
| 1995 | 11 | 46 | 57 | 0.80 |
| 1996 | 8 | 59 | 67 | 0.88 |
| 1997 | 8 | 66 | 74 | 0.89 |
| 1998 | 16 | 67 | 83 | 0.80 |
| 1999 | 10 | 54 | 64 | 0.84 |
| 2000 | 8 | 72 | 80 | 0.90 |
| 2001 | 7 | 50 | 57 | 0.87 |
| 2002 | 5 | 44 | 49 | 0.89 |
| 2003 | 10 | 54 | 64 | 0.84 |
| 2004 | 4 | 66 | 70 | 0.94 |
| 2005 | 5 | 64 | 69 | 0.92 |
| 2006 | 3 | 47 | 50 | 0.94 |
| 2007 | 1 | 41 | 42 | 0.97 |
| 2008 | 0 | 40 | 40 | 1:00 |
| 2009 | 2 | 38 | 40 | 0.95 |
| 2010 | 0 | 41 | 41 | 1:00 |
| 2011 | 4 | 44 | 48 | 0.91 |
| 2012 | 2 | 34 | 36 | 0.94 |
| 2013 | 2 | 40 | 42 | 0.95 |
| 2014 | 2 | 152 | 158 | 0.96 |
| 2015 | 3 | 151 | 154 | 0.98 |
| 2016 | 3 | 163 | 166 | 0.98 |
| 2017 | 1 | 138 | 139 | 0.99 |
| 2018 | 2 | 133 | 135 | 0.98 |
| Total | 218 | 1948 | 2166 | 0.89 |
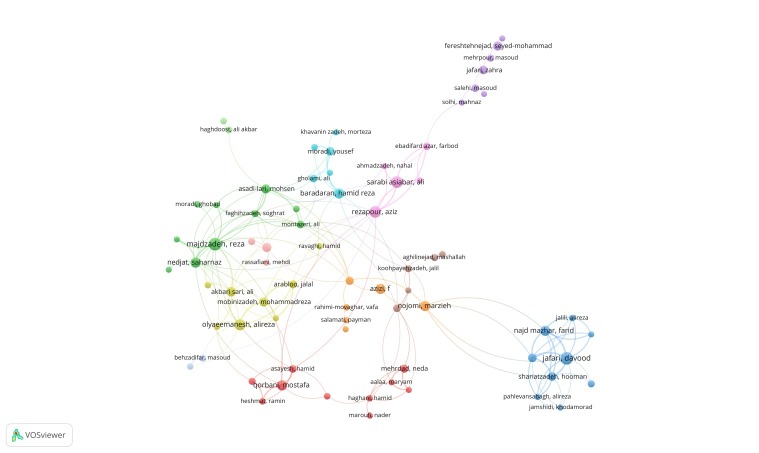
To analyze the co-authorship network, we included all authors with at least 5 articles published in MJIRI up to 2018. Therefore, among 6046 authors with at least one title in MJIRI, 129 authors had 5 or more MJIRI articles of which 56 ones excluded for having no co-authors. Finally, the remaining 73 authors were included in the cluster network shown in Figure 4.
Fig. 4.
The cluster network of co-authorships between all authors who contributed at least 5 articles to MJIRI and had at least one co-authorship with others. Out of 6046 MJIRI authors, 129 individuals had five or more articles, 73 of whom constructed the largest co-authorship network that are considered for the cluster mapping. This network contains 12 clusters and 164 co-authorships between 73 authors. The line thickness between two authors represents the number of co-authorships and the circle size represents the number of articles published by that author.
Top ten universities based on contribution to MJIRI
Based on affiliations of authors, we studied the participated universities with at least having a paper published in the MJIRI. Since we had limited access to all authors' affiliations in the MJIRI website, we considered the corresponders’ affiliations. Table 6 demonstrates the top ten institutions based on the amount of contribution to the MJIRI. The highest contribution was by ‘Iran University of Medical Sciences’ with publishing 407 articles (18.79%), followed by ‘Tehran University of Medical Sciences’ with 335 articles (15.46%), ‘Shiraz University of Medical Sciences’ with 164 articles (7.57%), and ‘Shahid Beheshti University of Medical Sciences’ with 127 articles (5.86%). It is noteworthy that MJIRI is published and owned by the ‘Iran University of Medical Sciences’.
Table 6. Top ten universities contributed to MJIRI .
| No | University | Number of Articles | % |
| 1 | Iran University of Medical Sciences | 407 | 18.79 |
| 2 | Tehran University of Medical Sciences | 335 | 15.46 |
| 3 | Shiraz University of Medical Sciences | 164 | 7.57 |
| 4 | Shahid Beheshti University of Medical Sciences | 127 | 5.86 |
| 5 | Mashhad University of Medical Sciences | 113 | 5.21 |
| 6 | Isfahan University of Medical Sciences | 61 | 2.81 |
| 7 | Baqiyatallah University of Medical Sciences | 58 | 2.67 |
| 8 | Tarbiat Modares University | 48 | 2.21 |
| 9 | Kerman University of Medical Sciences | 38 | 1.75 |
| 10 | Tabriz University of Medical Sciences | 36 | 1.66 |
Keywords’ co-occurrence
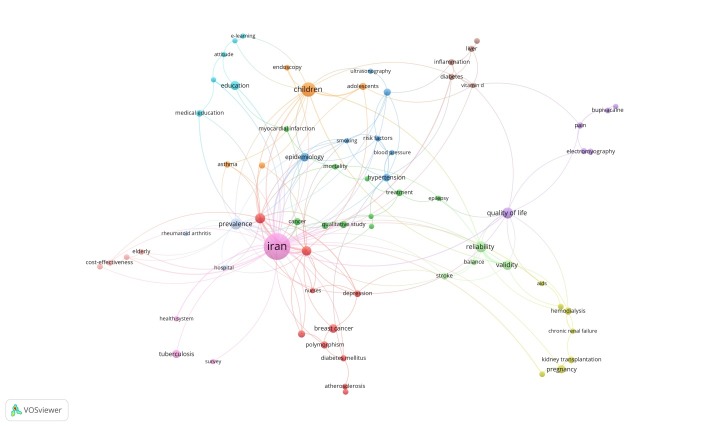
To analyze the co-occurrence relationship between articles’ keywords, we considered the articles’ keywords with at least 5 occurrences. Out of a total of 4916 keywords 76 were included for analysis. Five author keywords were excluded due to having no co-occurrence. Finally, the co-occurrence network of the remaining 71 keywords was drawn by VOSveiwer (Fig. 5). As illustrated in Figure 5, the most co-occurred keyword was “Iran” with 131co-occurrences, followed by “children” with 37, “prevalence” with 23 and “Quality of life” with 23. The top ten most co-occurred keywords in MJIRI articles based on the dense ranking system are demonstrated in Table 7. Among top ten most co-occurred keywords, some are pertaining to specific fields of medicine including: “Breast cancer”, “Pregnancy”, “Tuberculosis”, and “Hypertension” with 14, 12, 12, and 11 co-occurrences, respectively.
Fig. 5.
The cluster co-occurrence network of keywords with at least five occurrences and one or more co-occurrences with other keywords. The keywords with the same color belong to the same cluster. The line thickness between the two keywords represents the number of co-occurrences of both in MJIRI articles and the circle size represents the number of occurrences of each keyword in MJIRI articles.
Table 7. Top ten co-occurred keywords .
| No | Author Keyword | Numbers | Rank | No | Author Keyword | Numbers | Rank |
| 1 | Iran | 131 | 1 | 8 | Validity | 17 | 6 |
| 2 | children | 37 | 2 | 9 | Education | 15 | 7 |
| 3 | Prevalence | 23 | 3 | 10 | Breast Cancer | 14 | 8 |
| 4 | Quality of Life | 23 | 3 | 11 | Epidemiology | 14 | 8 |
| 5 | Reliability | 22 | 4 | 12 | Pregnancy | 12 | 9 |
| 6 | Systematic Review | 19 | 5 | 13 | Tuberculosis | 12 | 9 |
| 7 | Meta-Analysis | 17 | 6 | 14 | Hypertension | 11 | 10 |
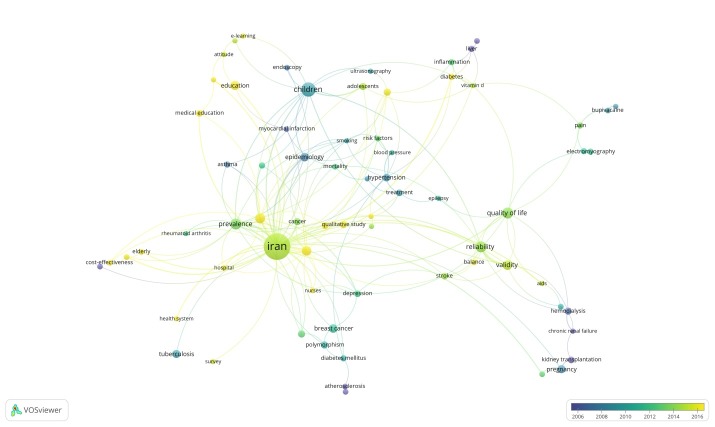
We also analyzed the a year-based co-occurrence network of 71 selected keywords shown by color spectrum from purple (the oldest one) to yellow (the newest one). As is shown in Figure 6, the latest keywords co-occurred in MJIRI articles are “diabetes”, “elderly”, “health system”, “hospital”, “nurses”, “education”, “medical education”, “e-learning”, and “qualitative study”.
Fig. 6.
The co-occurrence network of keywords with at least five occurrences in MJIRI articles and one or more co-occurrences with other keywords. The keywords appeared per year in the MJIRI articles are shown by color spectrum from purple (the oldest one) to yellow (the newest one). The line thickness between the two keywords represents the number of co-occurrences of both in MJIRI articles and the circle size represents the number of occurrences of each keyword in MJIRI articles.
Discussion
The current study demonstrates quantitative performance of MJIRI from its debut at 1987 up to the end of 2018 and provides a holistic landscape of the journal publishing trends during this period. We studied the journal’s publishing trends regarding number of published articles each year, AGR, the authorship pattern trend over time, top participated institutions per contribution to the journal, and the most co-occurred keywords appeared at the titles and abstracts and keywords.
The findings of the current study revealed that the number of MJIRI publications had suddenly increased dramatically after 2014, with over three times growth in the number of articles. This great increase has resulted in more than a third of articles being published in the last five years of 2014-2018. The chronological analysis of the authorship pattern of MJIRI articles shows that researchers tend to publish more multiple-author articles in compare to single-author articles over time. The same trend is also observed in the scientometric analysis of other journals (4, 5) some of which including PlosOne, JAMA and BMJ journals. Also, the overall DC of MJIRI articles was calculated as 0.89 depicting that there is an increasing trend of multiple authorship. Also, since 2014, the DC has become over 0.95 that is in line with the DC of other journals in the same field of research, like the journal of “Addictive Behavior” (13).
The greatest annual growth rate was at the year 2014 (AGR=276.190%), followed by the year 1988 (AGR=193.75%) and the lowest growth rates in the years 2001, 1991, and 2006 with AGR of -28.75%, -28.26%, and -27.54%, respectively. This result returns fluctuations in setting the publishing trends, which seemingly are influenced by the publisher/editors-in chief interests during the course of time.
The analysis of the most co-occurred keywords revealed that this journal paid a special attention to some area of medicine e.g. “Breast cancer”, “Pregnancy”, “Tuberculosis”, and “Hypertension”. The adaptable large range of MJIRI’s scope that accepts paper from most of health and medicine fields may have a role in having such versatile co-occurred keywords. It is likely that articles within these scopes have a better chance of acceptance.
The Potential limitations of this study were due to the lack of indexing of all articles published in the journal on the Scopus, and as a result, it was not possible to analyze the citations of the articles. In addition, the analysis of contribution by the universities was limited to the corresponding authors’ mentioned affiliations.
Conclusion
The study was a scientometric analysis of the 32 years (1987-2018) publishing research articles in the Medical Journal of The Islamic Republic of Iran. The results of this paper can be very helpful for policymakers of MJIRI to improve the journal’s status. Based on the current study, it is clear that the publishing trend of journals may have a critical impact on development of scientific productions.
Conflict of Interests
The authors declare that they have no competing interests.
Cite this article as: Dehghanbanadaki H, Khademsharif M, Aazami H, Azimi A. 32-Year Scientometric analysis of the Medical Journal of the Islamic Republic of Iran. Med J Islam Repub Iran. 2020 (5 Feb);34:1. https://doi.org/10.34171/mjiri.34.1
References
- 1.Jayabal R, Balasubramanian K. A Scientometric Study of Indian Journal of Chemical Technology. Lib Philosophy Pract. 2018:1. [Google Scholar]
- 2.Mahmudi Z, Tahamtan I, Sedghi S, Roudbari M. Ranking Iranian biomedical research centers according to H-variants (G, M, A, R) in Scopus and Web of Science. Med J Islam Repub Iran. 2015;29:217. [PMC free article] [PubMed] [Google Scholar]
- 3.Asadi H, Mostafavi E. The Productivity and Characteristics of Iranian Biomedical Journal (IBJ): A Scientometric Analysis. Iran Biomed J. 2018;22(6):362. doi: 10.29252/.22.6.362. [DOI] [PMC free article] [PubMed] [Google Scholar]
- 4.Kalita D. The scientometrics of nature. J Scientometric Res. 2016;5(2):123–34. [Google Scholar]
- 5.Gupta S, Hasan N. Scientometric analysis of Metamorphosis: A journal of management research. J Lib Inform Technol. 2018;38(4):254–8. [Google Scholar]
- 6.Nattar S. Indian journal of physics: A scientometric analysis. Int J Lib Inform Sci. 2009;1(4):043–61. [Google Scholar]
- 7. Suresh C, Hema R, Sankarasubramaniam N. A scientometric analysis of the “indian journal of horticulture”(2010-2014). Asia Pac J Res 2015;I (XXXIV).
- 8.Akhondzadeh S, Ebadifar A, Eftekhari MB, Falahat K. Medical science and research in Iran. Arch Iran Med. 2017;20(11):665. [PubMed] [Google Scholar]
- 9.Subramanyam K. Bibliometric studies of research collaboration: A review. J inform Sci. 1983;6(1):33–8. [Google Scholar]
- 10.Da Silva JAT, Memon AR. CiteScore: A cite for sore eyes, or a valuable, transparent metric? Scientometrics. 2017;111(1):553–6. [Google Scholar]
- 11.Moed HF. The Source-Normalized Impact per Paper (SNIP) is a valid and sophisticated indicator of journal citation impact. J Am Soc Inform Sci Technol. 2011;62(1):211–213. [Google Scholar]
- 12.Van Eck N, Waltman L. Software survey: VOSviewer, a computer program for bibliometric mapping. Scientometrics. 2009;84(2):523–38. doi: 10.1007/s11192-009-0146-3. [DOI] [PMC free article] [PubMed] [Google Scholar]
- 13.Geetha S, Thilagavathy N. A Scientometric Study of the Journal of Addictive Behavior. Indian J Inform Sources Serv. 2018;8(2):54–6. [Google Scholar]


