Figure 6.
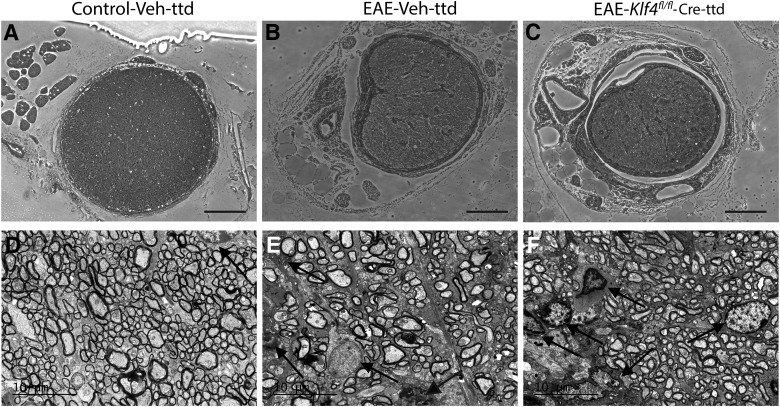
Histopathology and inflammation in EAE mice: A–C, Light microscopic images of the toluidine blue-stained ON sections obtained 18 MPS/9 MPI show normal healthy axons in control-Veh-ttd mice (A), whereas inflammatory infiltration and fibrosis seen in EAE-Veh-ttd (B), and EAE-Klf4fl/fl-Cre-ttd mice. D–F, Representative transmission electron micrographs show minimal to no cellular infiltration in control-Veh-ttd mice (D), whereas infiltration of astroglial cells was more evident in EAE-Veh-ttd (E) and EAE-Klf4fl/fl-Cre-ttd (F) mice ONs. Scale bars: 100 μm (light micrographs) and 10 μm (TEM images).Figure Contributions: Venu Talla and Rajeshwari Koilkonda acquired the images. Venu Talla generated the figure.

