Short abstract
Objective
It has been reported that 80% of all breast carcinoma cases are invasive ductal carcinoma (IDC), and 45% to 78% of invasive breast carcinoma cases are associated with ductal carcinoma in situ (DCIS). Therefore, it is important to gain insights into transcriptome changes that occur during DCIS progression to IDC.
Methods
We downloaded Gene Expression Omnibus databases GSE21422 and GSE3893, and performed differentially expressed gene (DEG) analysis and cluster analysis, followed by pathway enrichment analysis and Oncomine analysis.
Results
Twenty-six conserved DEGs were identified in both GSE21422 and GSE3893. These genes are mainly enriched in intermediate filament-based processes, immune responses, Staphylococcus aureus infection response, and phagosomes. Among them, FCGR2A, HLA-DRA, C3AR1, and FYB were reported to be involved in DCIS progression to IDC. High expression of HLA-DRA, C3AR1, and FYB in different types of breast cancer was validated using different Oncomine datasets. Moreover, elevated HLA-DRA and FYB levels were associated with breast cancer recurrence. Importantly, the overexpression of FYB was correlated with breast cancer metastasis.
Conclusions
This study revealed the molecular characteristics associated with progression from DCIS to IDC. It also identified potential biomarkers for DCIS progression to IDC, which will aid breast cancer diagnosis and prevention.
Keywords: Ductal carcinoma in situ, invasive ductal carcinoma, breast cancer, differentially expressed genes, Oncomine analysis, metastasis, recurrence
Introduction
Invasive ductal carcinoma (IDC), the most common type of breast cancer, accounts for 80% of breast cancer cases.1 Around 45% to 78% of invasive breast cancers are associated with ductal carcinoma in situ (DCIS), which is a subtype of breast cancer that proliferates within mammary ducts and lobules without stromal invasion.2,3 However, the importance of DCIS in malignant progression remains unclear. It was previously thought that DCIS was an early step from normal breast tissue to invasive breast cancer,4 but recent studies reported similarities between DCIS and invasive cancer at the genomic level.5–7 Proliferation and apoptosis-related proteins, including estrogen receptor (ER) and progesterone receptor (PR), share similar expression patterns in the in situ and invasive components of DCIS and IDC samples, suggesting that they may play a role in the transition process.8,9 Additionally, the same tumor suppressor genes located on chromosome 11 can be mutated or deficient in these two breast cancers.10,11
A long-term follow up study12,13 reported likely changes at the molecular level in the progression from DCIS to IDC given that 50% of high-grade DCIS progressed to IDC over 3 years. These changes are not only thought to involve proliferation and apoptosis-related proteins, but also invasion and progression-related genes and tumor suppressor genes. The matrix metalloproteinase 11 gene (MMP11), which is associated with breast cancer invasion, is a key factor for tumor development, and is highly expressed in IDC compared with matched DCIS.14 Importantly, high levels of MMP11 expression are associated with the invasion of multiple human carcinomas (including breast cancer) and poor clinical outcome for patients.15 MMP11 plays a role in the paracrine anti-apoptotic function, which benefits cancer survival.16 Therefore, investigating the molecular changes that occur in DCIS and in its transition to IDC may benefit our understanding of breast tumor invasion and progression by identifying possible target genes and biological processes and pathways.
Schuetz et al. previously identified several progression-specific candidate genes such as GREM1, SART2, and LRRC15 by analyzing the gene expression profiling of tumor samples between matched DCIS and IDC samples, combined with laser capture microdissection and oligonucleotide microarray analysis.14 Additionally, Kim et al. identified associated genomic alterations from DCIS to IDC by performing whole-exome sequencing and copy number profiling.17 They found several well-known mutations including those in TP53, PIK3CA, and AKT1, and copy number alterations (CNAs) in pure DCIS; however, significantly fewer driver genes and co-occurrences of mutations and CNAs were detected than in synchronous DCIS-IDC. The present study aimed to investigate gene alterations leading to the progression from DCIS to IDC by analyzing the gene profiles of DCIS and IDC from Gene Expression Omnibus (GEO) datasets GSE21422 and GSE3893.
Materials and methods
Gene expression data collection and processing
The gene expression profile of GSE21422, including nine DCIS and five IDC samples, was obtained from the GEO (http://www.ncbi.nlm.nih.gov/geo/) dataset. Samples were tumor grade 2 and 3 (six DCIS and three IDC at grade 3, and three DCIS and two IDC at grade 2); all patients were free of distant metastasis.18 The GPL570 Affymetrix Human Genome U133 Plus 2.0 Array platform was used in this dataset. Gene expression data based on the GPL570 platform in GSE3893 was also downloaded from the GEO dataset. This dataset contains seven breast tumors, which were diagnosed to contain both DCIS and IDC, of histological grades 2 and 3.14 Seven DCIS samples and seven IDC samples were isolated from the seven tumors with significant DCIS and IDC components. Two of the seven tumors were stratified into a homogenous ER-negative tumor cluster, and the others were ER-positive. Four of the seven tumors were PR-negative, and the others were PR-positive. Four of the seven tumors were human epidermal growth factor receptor (HER)2-negative, and the others were HER2-positive.
Gene expression data from each sample were extracted and downloaded from Series Matrix File(s). Probes were mapped to genes using Perl,19 and R was performed to pre-process the data via background correction and quantile normalization. Then, an “impute” package20 was applied to complement the missing expression by using its adjacent value. Finally, a data file containing available Entrez Gene identifiers and their corresponding expression values was obtained. The need for approval by an ethics review committee was waived because all gene expression data were downloaded from the GEO dataset.
Identification of differentially expressed genes (DEGs)
R was also adopted to screen DEGs. Log2 (fold changes) in gene expression were calculated and used in the analysis. The Limma package was employed to identify DEGs in each comparison using the empirical Bayes method.21 To correct for multiple testing, P values were adjusted using the ‘fdr’ function, which uses the Benjamini–Hochberg method to control the false discovery rate. The threshold to screen out DEGs was |log2(fold change)| > 0.3 and P < 0.05. Subsequently, we identified the common genes altered in both datasets with consistent up-or down-regulation for further analysis.
Pathway enrichment analysis
The common DEGs consistently altered in both datasets were annotated for protein function. R package-GO.db,22 KEGG.db,23 and KEGGREST24 were used to analyze functional enrichment. The statistical significance of the gene ontology (GO) term was evaluated with a threshold of P < 0.05. Common DEGs were further classified into different biological pathways. Similar to GO terms, the threshold for significant Kyoto Encyclopedia of Genes and Genomes (KEGG) pathways was also set as P < 0.05.
Oncomine database analysis
Oncomine is a cancer microarray database and web-based data mining platform that aims to facilitate discovery from genome-wide expression analyses.25 The Oncomine microarray database (http://www.oncomine.org) was used to detect gene expression levels of major histocompatibility complex, class II, DR alpha (HLA-DRA), complement C3a receptor 1 (C3AR1), and FYN binding protein (FYB) in different types of breast tumor samples. First, we compared clinical samples of cancer with healthy control datasets, and used a Students’ t-test to generate P values. We also focused on clinical specimens of high grade vs. low grade, recurrence at 3 years vs. no recurrence at 3 years, and metastasis at 3 years vs. no metastasis at 3 years. Associations between these genes in different types of breast cancer and different studies were also observed.
Results
Screening DEGs between DCIS and IDC in each GEO dataset and cluster analysis
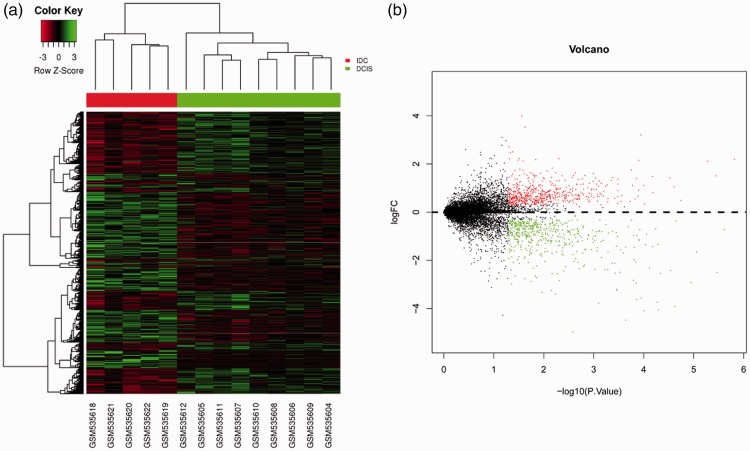
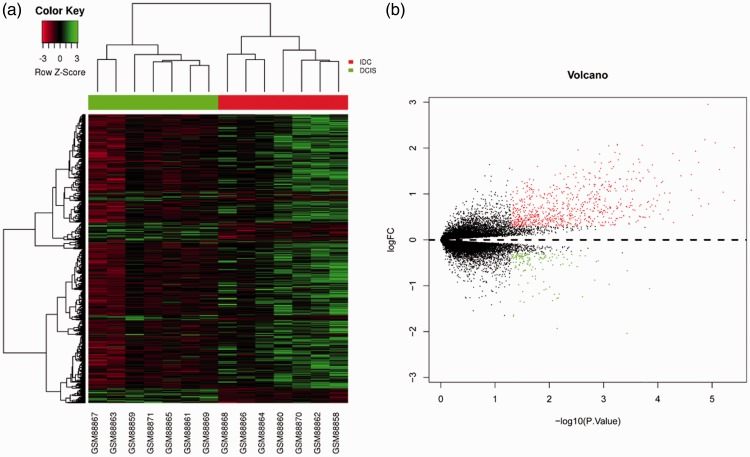
Gene expression data for each sample were downloaded from GSE21422 and GSE3893. GSE21422 included nine DCIS samples and five IDC samples, and GSE3893 consisted of seven DCIS samples and seven IDC samples. Hierarchical clustering and volcano plots revealed 1078 DEGs (|log2(fold change)| > 0.3 and P < 0.05) in IDC compared with DCIS from GSE21422 as shown in Figure 1, including 585 up-regulations. A total of 862 DEGs were identified in IDC from GSE3893 with 720 upregulated genes (Figure 2, P < 0.05).
Figure 1.
Identification of DEGs from the GSE21422 dataset. (a) Hierarchical clustering heat map of DCIS and IDC. Horizontal axis indicates the DEGs, vertical axis indicates the sample. Green represents downregulated genes, red represents upregulated genes. (b) Volcano plot of DCIS and IDC. Green represents downregulated DEGs, red represents upregulated DEGs.
Figure 2.
Identification of DEGs from the GSE3893 dataset. (a) Hierarchical clustering heat map of DCIS and IDC. Horizontal axis indicates the DEGs, vertical axis indicates the sample. Green represents downregulated genes, red represents upregulated genes. (b) Volcano plot of DCIS and IDC. Green represents downregulated DEGs, red represents upregulated DEGs.
Identification of conserved genes and pathway enrichment analysis
To identify conserved genes, we overlapped the DEGs in the two datasets. A total of 26 genes were common to both datasets (Table 1, P < 0.05). Among these, MMP11, KRT14, KRT17, and RGS1 were all upregulated in our analysis, and have been reported to be correlated with breast tumor invasion or poor prognosis.
Table 1.
Twenty-six common differentially expressed genes with consistent up- and down-regulation in both Gene Expression Omnibus datasets.
| Gene |
GSE21422 |
GSE3893 |
||
|---|---|---|---|---|
| Log2FC | P value | Log2FC | P value | |
| TAGAP | 0.37 | 0.0265 | 0.46 | 0.0059 |
| PIK3AP1 | 0.47 | 0.0124 | 0.42 | 0.0006 |
| ST8SIA4 | 0.32 | 0.0389 | 0.65 | 0.0003 |
| GPRIN3 | 0.58 | 0.0384 | 0.39 | 0.0026 |
| LAIR1 | 0.73 | 0.0020 | 0.33 | 0.0007 |
| NGFR | –0.56 | 0.0276 | –0.50 | 0.0038 |
| PLXNC1 | 0.70 | 0.0109 | 0.42 | 0.0020 |
| TAP2 | 0.79 | 0.0371 | 0.38 | 0.0150 |
| FCGR2A | 0.75 | 0.0288 | 0.42 | 0.0002 |
| MYH11 | –1.64 | 0.0022 | –0.31 | 0.0056 |
| MMP11 | 1.38 | 0.0370 | 0.39 | 0.0002 |
| SAMSN1 | 0.95 | 0.0449 | 0.59 | 0.0025 |
| C3AR1 | 0.77 | 0.0452 | 0.74 | 0.0001 |
| FYB | 1.42 | 0.0099 | 0.40 | 0.0015 |
| TFEC | 1.58 | 0.0415 | 0.50 | 0.0154 |
| ADORA3 | 1.51 | 0.0139 | 0.65 | 0.0001 |
| RGS1 | 1.52 | 0.0298 | 0.76 | 0.0133 |
| DSC3 | –1.17 | 0.0006 | –1.18 | 0.0065 |
| DST | –3.24 | 0.0069 | –0.46 | 0.0012 |
| HLA-DRA | 1.11 | 0.0063 | 1.45 | 0.0018 |
| EPYC | 2.71 | 0.0485 | 0.85 | 0.0333 |
| FCGR3B | 3.21 | 0.0001 | 0.80 | 0.0015 |
| ACTG2 | –4.06 | 0.0000 | –1.06 | 0.0001 |
| ANXA8L1 | –3.74 | 0.0001 | –1.19 | 0.0080 |
| KRT17 | –3.57 | 0.0001 | –1.93 | 0.0071 |
| KRT14 | –5.84 | 0.0012 | –3.10 | 0.0002 |
These 26 conserved genes were next used to perform pathway analysis, which identified 78 GO processes and eight KEGG pathways. The conserved genes were mainly enriched in intermediate filament-based processes, the immune response, the Staphylococcus aureus infection response, and phagosomes. In the top 20 significant GO processes and all KEGG pathways, FCGR2A was associated with 10 GO processes and five KEGG pathways; HLA-DRA was involved in six GO processes and five KEGG pathways; and C3AR1 and FYB were associated with 10 GO terms. Importantly, these genes were all involved with the immune response. These findings suggest that FCGR2A, HLA-DRA, C3AR1, and FYB might play crucial roles in the progression of DCIS to IDC, so were worthy of further investigation.
Validation for the expression of HLA-DRA, C3AR1 and FYB by Oncomine analysis
Oncomine gene expression array datasets (www.oncomine.org), an online cancer microarray database, facilitate discovery from genome-wide expression analyses.25 No study has reported the association of breast cancer with HLA-DRA, C3AR1, or FYB; therefore, we extracted their expression data from the Oncomine database for breast carcinoma, focusing on the clinical samples of patients with cancer vs. healthy controls, high grade vs. low grade, recurrence at 3 years vs. no recurrence at 3 years, and metastasis at 3 years vs. no metastasis at 3 years.
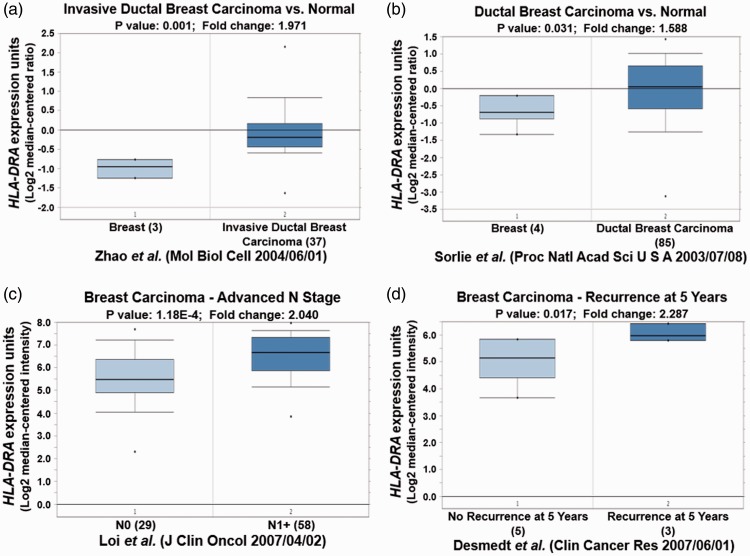
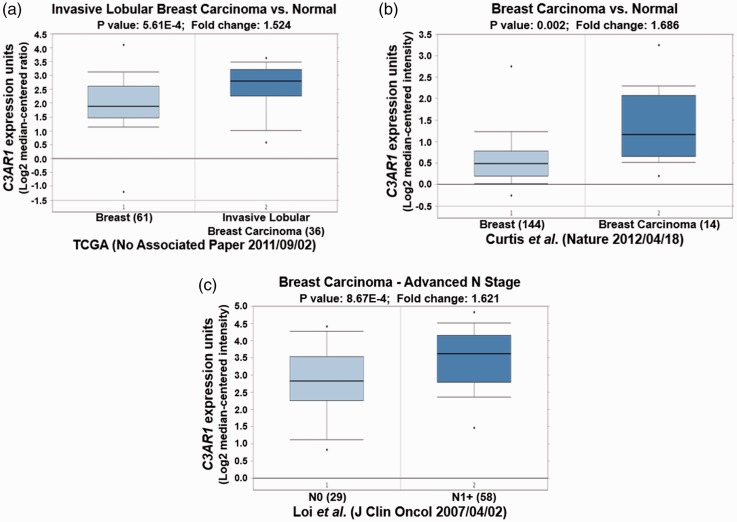
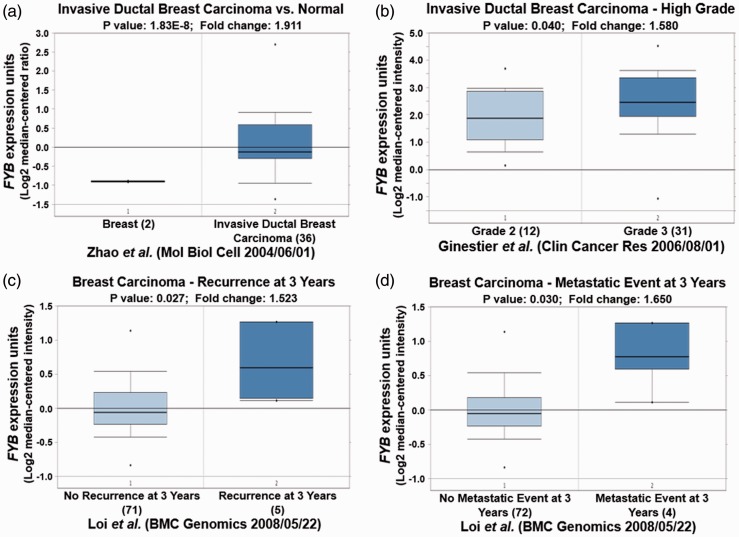
Different Oncomine datasets revealed that HLA-DRA was significantly overexpressed in IDC and ductal breast carcinoma (Table 2, P < 0.05; Figure 3a and 3b, P < 0.05). High expression of HLA-DRA was also observed in N1+ stage breast carcinoma compared with N0 stage (Figure 3c, P < 0.01). Importantly, elevated HLA-DRA levels were also associated with breast carcinoma recurrence after 5 years (Figure 3d, P < 0.05). Similar to HLA-DRA, C3AR1 was also increased in different types of breast carcinoma in different datasets, and its overexpression was also observed in N1+ stage breast carcinoma (Table 2, Figure 4, P < 0.05). Moreover, FYB up-regulation was also correlated with high grade IDC, breast carcinoma recurrence, and metastasis (Table 2, Figure 5, P < 0.05).
Table 2.
Changes in HLA-DRA, C3AR1, and FYB expression in breast cancer
| Gene | P value | Fold-change | Dataset (reference) | Number of samples | |
|---|---|---|---|---|---|
| HLA-DRA | Tumor vs. normal | 0.009 | 1.633 | 28 | 39 |
| 4.64E-05 | 3.101 | 29 | 22 | ||
| 0.031 | 1.588 | 30 | 89 | ||
| 0.001 | 1.967 | 31 | 154 | ||
| 0.001 | 1.971 | 32 | 40 | ||
| 1.25E-24 | 11.785 | 33 | 59 | ||
| High grade vs. low grade | 1.18E-04 | 2.04 | 34 | 87 | |
| Recurrence vs. no recurrence | 0.017 | 2.287 | 35 | 8 | |
| C3AR1 | Tumor vs. normal | 5.53E-22 | 2.237 | 33 | 59 |
| 0.007 | 2.378 | 36 | 23 | ||
| 0.003 | 2.295 | 36 | 25 | ||
| 0.002 | 1.686 | 31 | 158 | ||
| 5.61E-04 | 1.524 | TCGA (No Associated Paper 2011/09/02) | 97 | ||
| 1.85E-06 | 4.758 | 29 | 22 | ||
| High grade vs. low grade | 0.035 | 3.373 | 36 | 9 | |
| 8.67E-04 | 1.621 | 34 | 87 | ||
| FYB | Tumor vs. normal | 1.83E-08 | 1.911 | 32 | 38 |
| 0.022 | 2.158 | 37 | 38 | ||
| 1.17E-12 | 2.633 | 33 | 59 | ||
| 9.28E-06 | 1.557 | TCGA (No Associated Paper 2011/09/02) | 137 | ||
| 1.81E-06 | 3.882 | 29 | 22 | ||
| High grade vs. low grade | 0.009 | 1.531 | 36 | 9 | |
| 0.038 | 1.635 | 38 | 31 | ||
| 0.04 | 1.58 | 39 | 43 | ||
| 0.041 | 2.052 | 28 | 13 | ||
| Recurrence vs. no recurrence | 0.027 | 1.523 | 34 | 76 | |
| Metastasis vs. no metastasis | 0.03 | 1.65 | 34 | 76 |
Figure 3.
HLA-DRA expression validation in different types of breast cancer from different Oncomine databases. (a) and (b) High expression of HLA-DRA is observed in breast cancer compared with healthy breast samples. (c) HLA-DRA is overexpressed in N1+ stage breast carcinoma compared with N0 stage. (d) HLA-DRA is upregulated in breast carcinoma with recurrence at 5 years.
Figure 4.
C3AR1 expression validation in different types of breast cancer from different Oncomine databases. (a) and (b) C3AR1 expression is increased in breast cancer. (c) Elevated expression of C3AR1 is found in N1+ stage breast carcinoma compared with N0 stage.
Figure 5.
FYB expression validation in different types of breast cancer from different Oncomine databases. (a) FYB is upregulated in breast cancer. (b) FYB is highly expressed in grade 3 compared with grade 2 breast cancer. (c) Overexpression of FYB is observed in breast carcinoma with recurrence at 3 years. (d) FYB is overexpressed in breast carcinoma metastasis.
These Oncomine results emphasized the importance of the expression of HLA-DRA, C3AR1, and FYB during breast cancer progression and prognosis.
Discussion
This study aimed to gain insights into the molecular changes involved in the progression of DCIS to IDC, and to identify novel targets for tumor development or invasion. To address this issue, we download and analyzed two GEO datasets: GSE21422 and GSE3893. Each dataset included gene expression profiles of DCIS and IDC samples.
To identify genes that were conserved in DCIS progression to IDC, we overlapped all DEGs identified from the two datasets to ascertain those that were common to both. A total of 26 genes were common to both datasets, including MMP11, KRT14, KRT175, and RGS1, and were previously reported to be correlated with breast tumor invasion or poor prognosis. For example, elevated MMP11 expression was previously associated with breast cancer invasion and poor clinical outcome,15 while KRT14 and KRT17 were reported to be markers of poor prognosis in breast cancer.26 Moreover, RGS1 inhibition was hypothesized to activate CXCR4 and further inhibit breast cancer cell survival.27 GO term and KEGG pathway analyses further showed that FCGR2A, HLA-DRA, C3AR1, and FYB were involved in most of the top 20 significant GO processes and all KEGG pathways, such as the immune response, suggesting they might play critical roles in DCIS progression. The FCGR2A H131R polymorphism is known to be associated with the clinical outcome of patients with breast cancer treated with the sequential adjuvant administration of trastuzumab.28 However, no studies have reported the roles of HLA-DRA, C3AR1, or FYB in breast cancer. In our study, these genes were all upregulated in IDC compared with DCIS.
HLA-DRA, an interferon (IFN)-stimulated gene, is highly expressed in MDA MB 435 breast cancer cells within 24 h of IFN-γ stimulation,29 while C3AR1 expression is increased in basal-like breast malignancies, suggesting it might be associated with immune activation and inflammatory response.30 Moreover, the immune cell-specific adaptor protein FYB, also known as adhesion and degranulation-promoting adapter protein, positively mediates T cell receptor (TCR)-dependent as well as integrin-mediated adhesion, and is involved in pathways downstream of the TCR that may cause T cell activation.31
Our findings showed high expression of HLA-DRA, C3AR1, and FYB in DCIS progression to IDC, but their other characteristics in breast cancer are still unknown. Further support was provided by our Oncomine analysis. Significant levels of HLA-DRA, C3AR1, and FYB overexpression were detected in high-grade relative to low-grade breast carcinoma, and high levels of HLA-DRA and FYB were correlated with breast carcinoma recurrence, suggesting that HLA-DRA and FYB expression might be linked to cancer prognosis. This supports an earlier study by Diederichsen et al. which found that increased HLA-DR expression was associated with poor prognosis.32 Although no study has yet reported a role for FYB expression in cancer prognosis, FYN was demonstrated to be a prognostic biomarker for colorectal cancer.33 Additionally, our Oncomine results suggested that elevated levels of FYB are related to breast cancer metastasis, further confirming the association between FYB and poor prognosis.
Our study has a number of limitations. First, the sample size is limited and the use of larger databases may better explain the molecular characteristics of DCIS progression to IDC, although we nevertheless identified significant DEGs and pathways. Second, while Oncomine analysis successfully validated the expression levels of potential targets in breast cancer, animal work or experimental studies involving human tissues are needed to confirm these findings. In particular, future investigations should determine the roles of HLA-DRA and FYB in breast cancer prognosis.
In conclusion, our study identified 26 DEGs that may lead to the progression of DCIS to IDC. Among them, HLA-DRA, C3AR1, and FYB appear to be novel key genes involved in the immune response during breast cancer progression. Additionally, C3AR1 and FYB could be associated with breast cancer prognosis. This study identified potential biomarkers for the progression from DCIS to IDC that may be used for breast cancer diagnosis and prevention.
Declaration of conflicting interest
The authors declare that there is no conflict of interest.
Funding
The study was supported by the Educational Department of Sichuan Province Research Projects (grant numbers 17ZA0175, 17ZA0176, and 16ZA0242) and Nanchong Science and Technology Bureau Research Projects (grant numbers NSMC20170460, NSMC20170410, and 15A0035).
References
- 1.Badowska-Kozakiewicz AM, Liszcz A, Sobol M, et al. Retrospective evaluation of histopathological examinations in invasive ductal breast cancer of no special type: an analysis of 691 patients. Arch Med Sci 2017; 13: 1408–1415. [DOI] [PMC free article] [PubMed] [Google Scholar]
- 2.Meng L, Xu Y, Xu C, et al. Biomarker discovery to improve prediction of breast cancer survival: using gene expression profiling, meta-analysis, and tissue validation. Onco Targets Ther 2016; 9: 6177–6185. [DOI] [PMC free article] [PubMed] [Google Scholar]
- 3.Burstein HJ, Polyak K, Wong JS, et al. Ductal carcinoma in situ of the breast. N Engl J Med 2004; 350: 1430–1441. [DOI] [PubMed] [Google Scholar]
- 4.Yeong J, Thike AA, Tan PH, et al. Identifying progression predictors of breast ductal carcinoma in situ. J Clin Pathol 2017; 70: 102–118. [DOI] [PubMed] [Google Scholar]
- 5.Doebar SC, van den Broek EC, Koppert LB, et al. Extent of ductal carcinoma in situ according to breast cancer subtypes: a population-based cohort study. Breast Cancer Res Treat 2016; 158: 179–187. [DOI] [PMC free article] [PubMed] [Google Scholar]
- 6.Carraro DM, Elias EV, Andrade VP. Ductal carcinoma in situ of the breast: morphological and molecular features implicated in progression. Biosci Rep 2014; 34: e00090. [DOI] [PMC free article] [PubMed] [Google Scholar]
- 7.Johnson CE, Gorringe KL, Thompson ER, et al. Identification of copy number alterations associated with the progression of DCIS to invasive ductal carcinoma. Breast Cancer Res Treat 2012; 133: 889–898. [DOI] [PubMed] [Google Scholar]
- 8.Zagouri F, Sergentanis TN, Zografos GC. Precursors and preinvasive lesions of the breast: the role of molecular prognostic markers in the diagnostic and therapeutic dilemma. World J Surg Oncol 2007; 5: 57. [DOI] [PMC free article] [PubMed] [Google Scholar]
- 9.Mommers EC, Leonhart AM, Falix F, et al. Similarity in expression of cell cycle proteins between in situ and invasive ductal breast lesions of same differentiation grade. J Pathol 2001; 194: 327–333. [DOI] [PubMed] [Google Scholar]
- 10.Holzman D. Scientists show that invasive breast cancer develops from early cancer cells. J Natl Cancer Inst 1995; 87: 710–711. [DOI] [PubMed] [Google Scholar]
- 11.Ko H, Shin J, Lee JE, et al. Comparison of the association of mammographic density and clinical factors with ductal carcinoma in situ versus invasive ductal breast cancer in Korean women. BMC Cancer 2017; 17: 821. [DOI] [PMC free article] [PubMed] [Google Scholar]
- 12.Collins LC, Tamimi RM, Baer HJ, et al. Outcome of patients with ductal carcinoma in situ untreated after diagnostic biopsy: results from the Nurses' Health Study. Cancer 2005; 103: 1778–1784. [DOI] [PubMed] [Google Scholar]
- 13.Casasent AK, Edgerton M, Navin NE. Genome evolution in ductal carcinoma in situ: invasion of the clones. J Pathol 2017; 241: 208–218. [DOI] [PMC free article] [PubMed] [Google Scholar]
- 14.Schuetz CS, Bonin M, Clare SE, et al. Progression-specific genes identified by expression profiling of matched ductal carcinomas in situ and invasive breast tumors, combining laser capture microdissection and oligonucleotide microarray analysis. Cancer Res 2006; 66: 5278–5286. [DOI] [PubMed] [Google Scholar]
- 15.Basset P, Okada A, Chenard MP, et al. Matrix metalloproteinases as stromal effectors of human carcinoma progression: therapeutic implications. Matrix Biol 1997; 15: 535–541. [DOI] [PubMed] [Google Scholar]
- 16.Andarawewa KL, Motrescu ER, Chenard MP, et al. Stromelysin-3 is a potent negative regulator of adipogenesis participating to cancer cell-adipocyte interaction/crosstalk at the tumor invasive front. Cancer Res 2005; 65: 10862–10871. [DOI] [PubMed] [Google Scholar]
- 17.Kim SY, Jung SH, Kim MS, et al. Genomic differences between pure ductal carcinoma in situ and synchronous ductal carcinoma in situ with invasive breast cancer. Oncotarget 2015; 6: 7597–7607. [DOI] [PMC free article] [PubMed] [Google Scholar]
- 18.Kretschmer C, Conradi A, Kemmner W, et al. Latent transforming growth factor binding protein 4 (LTBP4) is downregulated in mouse and human DCIS and mammary carcinomas. Cell Oncol (Dordr) 2011; 34: 419–434. [DOI] [PMC free article] [PubMed] [Google Scholar]
- 19.Stajich JE, Block D, Boulez K, et al. The Bioperl toolkit: perl modules for the life sciences. Genome Res 2002; 12: 1611–1618. [DOI] [PMC free article] [PubMed] [Google Scholar]
- 20.Hastie T, Tibshirani R, Narasimhan B, et al. Impute: imputation for microarray data. Oral History Review 2011: 128–130. [Google Scholar]
- 21.Smyth GK. limma: linear models for microarray data In: Gentleman R, Carey VJ, Huber W, Irizarry RA, Dudoit S. (eds) Bioinformatics & Computational Biology Solutions Using R & Bioconductor New York: Springer, 2005: pp. 397–420. [Google Scholar]
- 22.Harris MA, Clark J, Ireland A, et al. The Gene Ontology (GO) database and informatics resource. Nucleic Acids Res 2004; 32: D258–D261. [DOI] [PMC free article] [PubMed] [Google Scholar]
- 23.Organizer GB, Goode JA. The KEGG database Chichester: John Wiley & Sons, Ltd, 2008, pp.91–103. [Google Scholar]
- 24.Smoot ME, Ono K, Ruscheinski J, et al. Cytoscape 2.8: new features for data integration and network visualization. Bioinformatics 2011; 27: 431–432. [DOI] [PMC free article] [PubMed] [Google Scholar]
- 25.Rhodes DR, Yu J, Shanker K, et al. ONCOMINE: a cancer microarray database and integrated data-mining platform. Neoplasia 2004; 6: 1–6. [DOI] [PMC free article] [PubMed] [Google Scholar]
- 26.Pluciennik E, Krol M, Nowakowska M, et al. Breast cancer relapse prediction based on multi-gene RT-PCR algorithm. Med Sci Monit 2010; 16: Cr132–Cr136. [PubMed] [Google Scholar]
- 27.Bjarnadottir O, Kimbung S, Johansson I, et al. Global transcriptional changes following statin treatment in breast cancer. Clin Cancer Res 2015; 21: 3402–3411. [DOI] [PubMed] [Google Scholar]
- 28.Perou CM, Sorlie T, Eisen MB, et al. Molecular portraits of human breast tumours. Nature 2000; 406: 747–752. [DOI] [PubMed] [Google Scholar]
- 29.Karnoub AE, Dash AB, Vo AP, et al. Mesenchymal stem cells within tumour stroma promote breast cancer metastasis. Nature 2007; 449: 557–563. [DOI] [PubMed] [Google Scholar]
- 30.Sorlie T, Tibshirani R, Parker J, et al. Repeated observation of breast tumor subtypes in independent gene expression data sets. Proceedings of the National Academy of Sciences of the United States of America 2003; 100: 8418–8423. [DOI] [PMC free article] [PubMed] [Google Scholar]
- 31.Curtis C, Shah SP, Chin SF, et al. The genomic and transcriptomic architecture of 2,000 breast tumours reveals novel subgroups. Nature 2012; 486: 346–352. [DOI] [PMC free article] [PubMed] [Google Scholar]
- 32.Zhao H, Langerod A, Ji Y, et al. Different gene expression patterns in invasive lobular and ductal carcinomas of the breast. Molecular biology of the cell 2004; 15: 2523–2536. [DOI] [PMC free article] [PubMed] [Google Scholar]
- 33.Finak G, Bertos N, Pepin F, et al. Stromal gene expression predicts clinical outcome in breast cancer. Nature medicine 2008; 14: 518–527. [DOI] [PubMed] [Google Scholar]
- 34.Loi S, Haibe-Kains B, Desmedt C, et al. Definition of clinically distinct molecular subtypes in estrogen receptor-positive breast carcinomas through genomic grade. Journal of clinical oncology : official journal of the American Society of Clinical Oncology 2007; 25: 1239–1246. [DOI] [PubMed] [Google Scholar]
- 35.Desmedt C, Piette F, Loi S, et al. Strong time dependence of the 76-gene prognostic signature for node-negative breast cancer patients in the TRANSBIG multicenter independent validation series. Clinical cancer research : an official journal of the American Association for Cancer Research 2007; 13: 3207–3214. [DOI] [PubMed] [Google Scholar]
- 36.Ma XJ, Dahiya S, Richardson E, Erlander M, Sgroi DC. Gene expression profiling of the tumor microenvironment during breast cancer progression. Breast cancer research : BCR 2009; 11: R7. [DOI] [PMC free article] [PubMed] [Google Scholar]
- 37.Radvanyi L, Singh-Sandhu D, Gallichan S, et al. The gene associated with trichorhinophalangeal syndrome in humans is overexpressed in breast cancer. Proceedings of the National Academy of Sciences of the United States of America 2005; 102: 11005–11010. [DOI] [PMC free article] [PubMed] [Google Scholar]
- 38.Stickeler E, Pils D, Klar M, et al. Basal-like molecular subtype and HER4 up-regulation and response to neoadjuvant chemotherapy in breast cancer. Oncology reports 2011; 26: 1037–1045. [DOI] [PubMed] [Google Scholar]
- 39.Ginestier C, Cervera N, Finetti P, et al. Prognosis and gene expression profiling of 20q13-amplified breast cancers. Clinical cancer research : an official journal of the American Association for Cancer Research 2006; 12: 4533–4544. [DOI] [PubMed] [Google Scholar]
- 40.Roca L, Dieras V, Roche H, et al. Correlation of HER2, FCGR2A, and FCGR3A gene polymorphisms with trastuzumab related cardiac toxicity and efficacy in a subgroup of patients from UNICANCER-PACS 04 trial. Breast Cancer Res Treat 2013; 139: 789–800. [DOI] [PubMed] [Google Scholar]
- 41.Truax AD, Thakkar M, Greer SF. Dysregulated recruitment of the histone methyltransferase EZH2 to the class II transactivator (CIITA) promoter IV in breast cancer cells. PLoS One 2012; 7: e36013. [DOI] [PMC free article] [PubMed] [Google Scholar]
- 42.Milioli HH, Tishchenko I, Riveros C, Berretta R, Moscato P. Basal-like breast cancer: molecular profiles, clinical features and survival outcomes. BMC Med Genomics 2017; 10: 19. [DOI] [PMC free article] [PubMed] [Google Scholar]
- 43.Mueller KL, Thomas MS, Burbach BJ, Peterson EJ, Shimizu Y. Adhesion and degranulation-promoting adapter protein (ADAP) positively regulates T cell sensitivity to antigen and T cell survival. J Immunol 2007; 179: 3559–3569. [DOI] [PubMed] [Google Scholar]
- 44.Diederichsen AC, Hjelmborg J, Christensen PB, Zeuthen J, Fenger C. Prognostic value of the CD4+/CD8+ ratio of tumour infiltrating lymphocytes in colorectal cancer and HLA-DR expression on tumour cells. Cancer Immunol Immunother 2003; 52: 423–428. [DOI] [PMC free article] [PubMed] [Google Scholar]
- 45.Jiang H, Dong L, Gong F, et al. Inflammatory genes are novel prognostic biomarkers for colorectal cancer. Int J Mol Med 2018; 42: 368–380. [DOI] [PMC free article] [PubMed] [Google Scholar]


