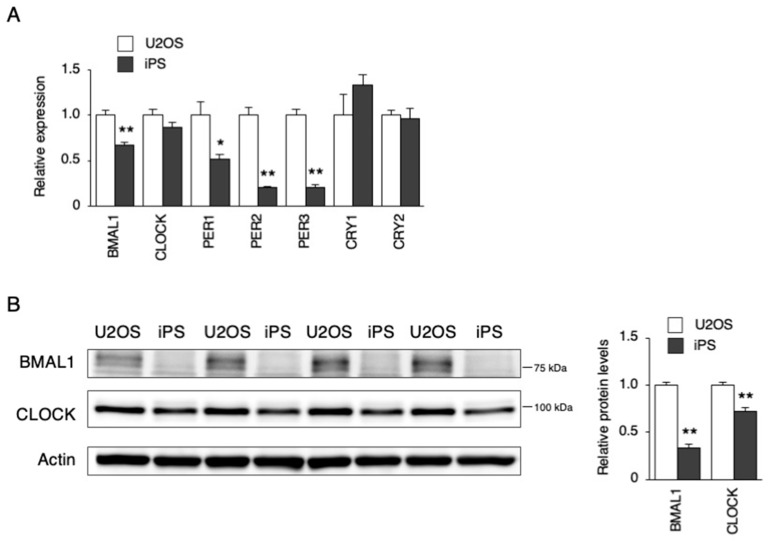
Figure 5.
Expression levels of the clock genes in hiPSCs. (A) The expression levels of clock genes in U2OS cells and hiPSCs. Data are presented as the means ± SEM relative to U2OS; n = 4 for each comparison. * p < 0.05, ** p < 0.01 versus the corresponding control. (B) BMAL1 and CLOCK protein levels in U2OS cells and hiPSCs. Left, representative blot images. Right, the quantification of their blots. Data are presented as the means ± SEM relative to U2OS. n = 4 for each comparison. ** p < 0.01 versus the corresponding control.

