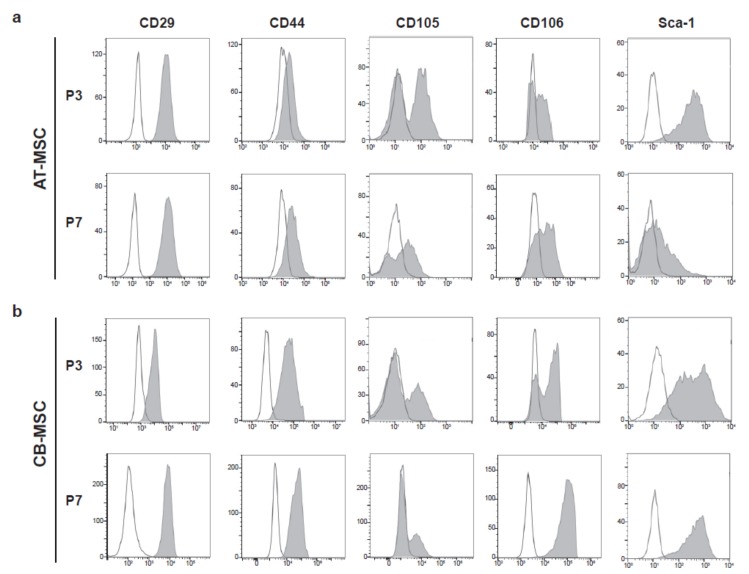
Figure 3.
Immunophenotypes of MSCs. Cell surface markers for MSCs, CD29, CD44, CD105, CD106, and Sca-1 were used to characterize (a) AT-MSC and (b) CB-MSC at passage 3 (P3) and 7 (P7), respectively. Representative flow cytometry patterns were shown. Shaded peaks represent antibody-labeled population; blank peaks represented isotype controls.

