Abstract
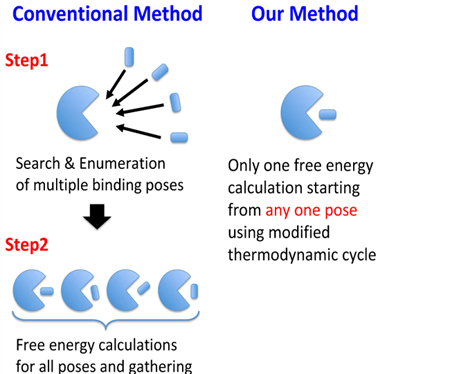
We propose a free energy calculation method for receptor-ligand binding, which have multiple binding poses that avoids exhaustive enumeration of the poses. For systems with multiple binding poses, the standard procedure is to enumerate orientations of the binding poses, restrain the ligand to each orientation, and then, calculate the binding free energies for each binding pose. In this study, we modify a part of the thermodynamic cycle in order to sample a broader conformational space of the ligand in the binding site. This modification leads to the more accurate free energy calculation without performing separate free energy simulations for each binding pose. We applied our modification to simple model host-guest systems as a test, which have only two binding poses, by using a single decoupling method (SDM) in implicit solvent. The results showed that the binding free energies obtained from our method without knowing the two binding poses were in good agreement with the benchmark results obtained by explicit enumeration of the binding poses. Our method is applicable to other alchemical binding free energy calculation methods such as the double decoupling method (DDM) in explicit solvent. We performed a calculation for a protein–ligand system with explicit solvent using our modified thermodynamic path. The results of the free energy simulation along our modified path were in good agreement with the results of conventional DDM which requires a separate binding free energy calculation for each of the binding poses of the example of phenol binding to T4 lysozyme in explicit solvent.
Keywords: Binding free energy, Alchemical, Multiple binding, Molecular simulation, Double decoupling
Graphical Abstract
For systems with multiple binding poses, the standard procedure is to enumerate orientations of the binding poses, restrain the ligand to each orientation, and then, calculate the binding free energies for each binding pose. We propose a free energy calculation method that leads to the more accurate free energy calculation without performing separate free energy simulations for each binding pose.
INTRODUCTION
An understanding of ligand-receptor interactions is valuable for many areas of biophysical and biochemical research and drug discovery1. Alchemical free energy calculation methods are often employed for receptor-ligand binding2–6. The double decoupling method (DDM), which is rigorously derived from the underlying theory of statistical mechanics, is used for explicit solvent3,7,8. DDM is performed using the nonphysical thermodynamic cycle involving the free energies of decoupling the ligand from the solution with and without the presence of the receptor. During the process of decoupling the ligand in the receptor, a restraint potential between the ligand and receptor is applied in order to prevent the ligand from leaving the binding site. In addition, orientational restraints have been used to restrict the orientation of the ligand relative to the receptor in order to accelerate sampling and facilitate convergence of the simulations. Although adding restraints is an important process in the thermodynamic cycle for DDM, if a ligand is likely to bind in multiple orientations (poses) to the binding site, it is necessary to calculate the binding free energies for each binding pose separately and then combine them9–12. Therefore, when a ligand, which may bind in multiple poses, binds to the receptor, we have to enumerate the orientations of each of the binding poses, and then, calculate the binding free energies for each binding pose.
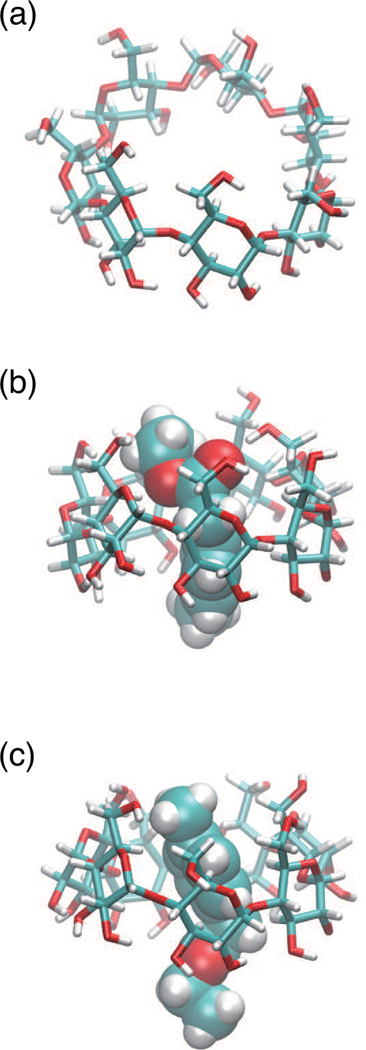
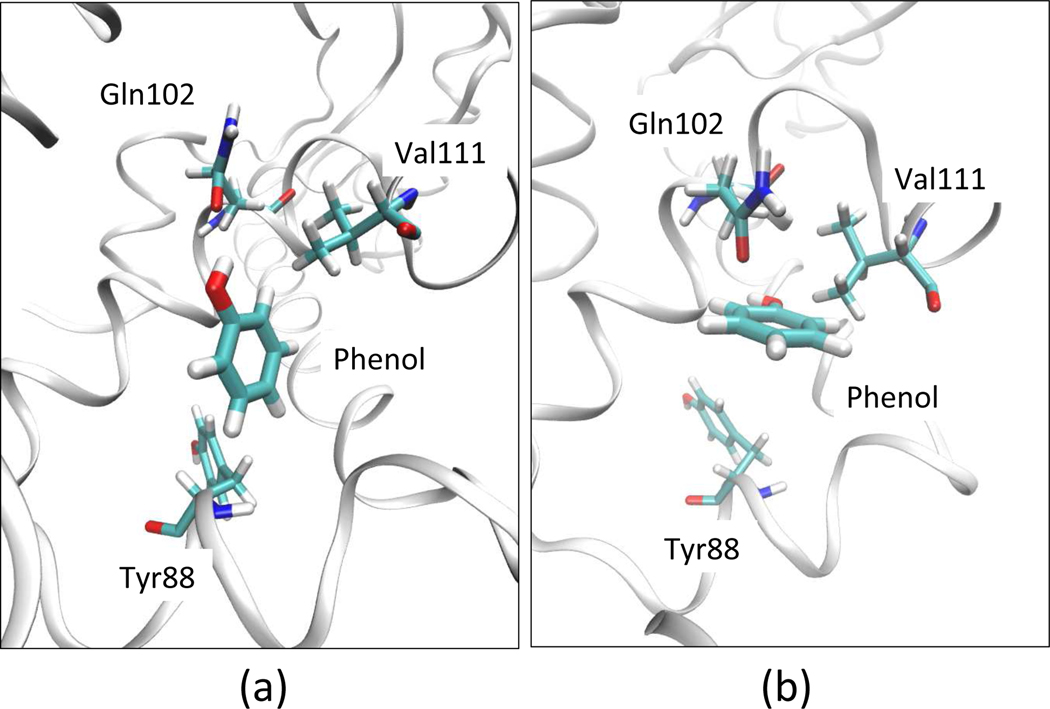
In this study, we propose a modified alchemical binding free energy calculation method for receptor-ligand systems with multiple binding poses. In this method, multiple poses of the ligand can be sampled in the binding site from one free energy calculation. Thus, we can estimate the binding free energy from one free energy calculation even though the ligand may bind in multiple poses. In addition, we can choose an arbitrary pose from the multiple poses without depending on the stability of the binding pose for the restraint. As an example, we apply this method to the single decoupling method (SDM). SDM is a simpler method based on an implicit solvation model which occupies a niche between docking and DDM in explicit solvent. It is noted that the meaning of the term SDM we described is different from that of Kilburg and Gallicchio13. In this paper, the SDM means the binding free energy calculation method with orientational restraints in implicit solvent. We perform SDM and our modified SDM (MSDM) to four systems, consisting of the combination of four ligands and two receptors as test simulations, and compare with the benchmark results, which are calculated by using the binding energy distribution analysis method (BEDAM)14–16. BEDAM is an alchemical binding free energy method, which employs a flat bottomed restraint that defines the effective binding site volume Vsite (details are described at “Methods” section). As a first example, we selected β-cyclodextrin (βCD) as the receptor (see Figure 3(a)). βCD is a popular model system for studying molecular recognition17–24 and the ligand clearly have two poses, which we label as UP state and DOWN state (see Figures 3(b) and (c)). Additionally, we applied our modified thermodynamic path to DDM in explicit solvent using the T4 lysozyme–phenol system. T4 lysozyme is also a popular model system for studying molecular recognition2,3,5,9,25–29. We estimated the binding free energies by modified DDM (MDDM) using two binding modes, one is the stable state27 and another is one of metastable conformations9 obtained from equilibrium simulations at 200K. These two binding modes are shown in Figure 13.
Figure 3:
Structures of β-cyclodextrin (a) studied in this work. The examples of complex of UP-state (b) and DOWN-state (c) of β-cyclodextrin and Ethyl p-tolylacetate.
Figure 13:
Two binding modes of T4 lysozyme–phenol system. State A (a) is determined based on X-ray structure27. State B (b) is determined from the low temperature simulation, which is initiated from an orientation referenced from Mobley et al. paper9.
METHODOLOGY
Alchemical binding free energy calculation
The binding process of a ligand to a protein is shown by the following reaction
where R and L stand for a receptor and ligand, respectively. RL means a complex state of the receptor and the ligand. R, L, and RL are fully solvated. is the binding free energy for forming the complex. DDM is one of popular calculation methods for the binding free energy. In this study, we begin with a single decoupling method SDM based on an implicit solvent model as a simpler example. The binding free energy is expressed using the binding constant KRL as
| (1) |
where,
| (2) |
Here, kB is the Bolzmann constant, T is the absolute temperature and Co is the inverse of the standard volume 3,
| (3) |
is the configurational partition function of the RL complex, and (3)
| (4) |
and
| (5) |
are, respectively, the configurational partition functions of the ligand L and the receptor R in solution7. Here, is and and are the internal coordinates of the receptor and ligand, respectively. is the six external coordinates of the ligand relative to the receptor. U is the potential energy function and W is the solvent potential of mean force30, which describes solvent-mediated interactions. is the Jacobian corresponding to the external coordinates of the ligand relative to the receptor, and is a step indicator function, which defines the complexed state of the system. When the ligand is within the binding site, , otherwise, . The binding site is defined by an effective binding site volume Vsite7,14 as follows,
| (6) |
Thus, the binding free energy can be written as
| (7) |
where the first term is the entropic work that the ligand transfers from a solution of concentration Co to the binding site region of complex14. The second free energy term is defined as
| (8) |
where u is the effective binding energy is,
| (9) |
and is an ensemble average with the ligand located within Vsite but not interacting with the receptor. ΔG is the work for turning on interactions between the ligand and the receptor while the ligand is sequestered within the binding site region.
Single decoupling method (SDM)
In SDM or DDM, we estimate the binding free energy by using an alchemical path connecting the bound and unbound states in Eq (1). In the case of SDM, is computed as
| (10) |
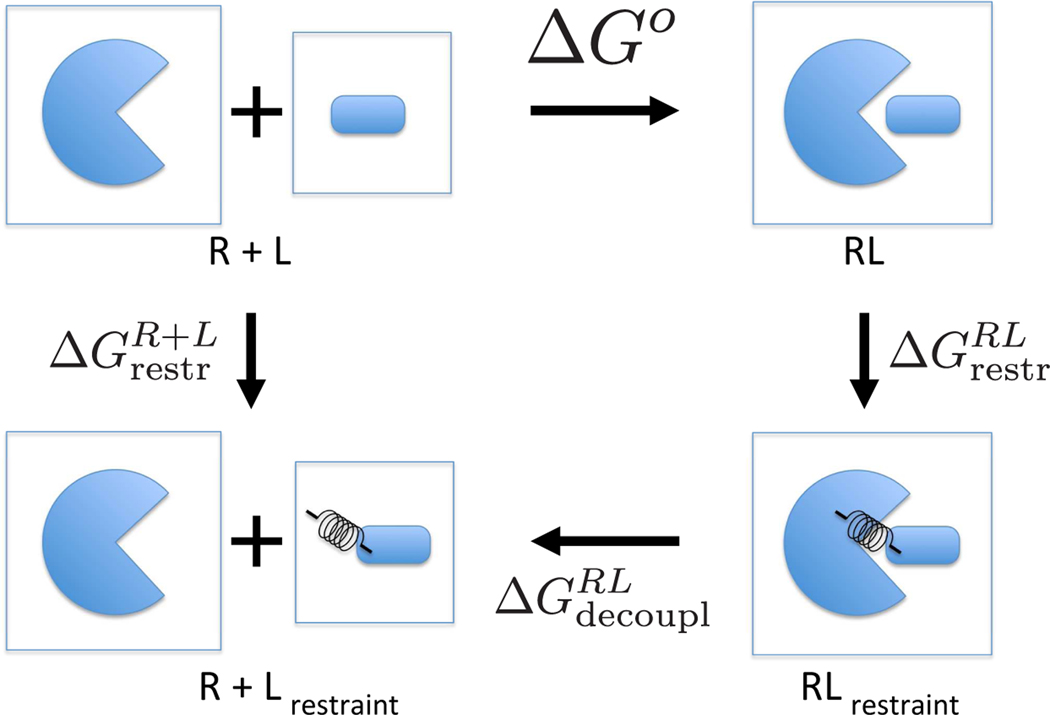
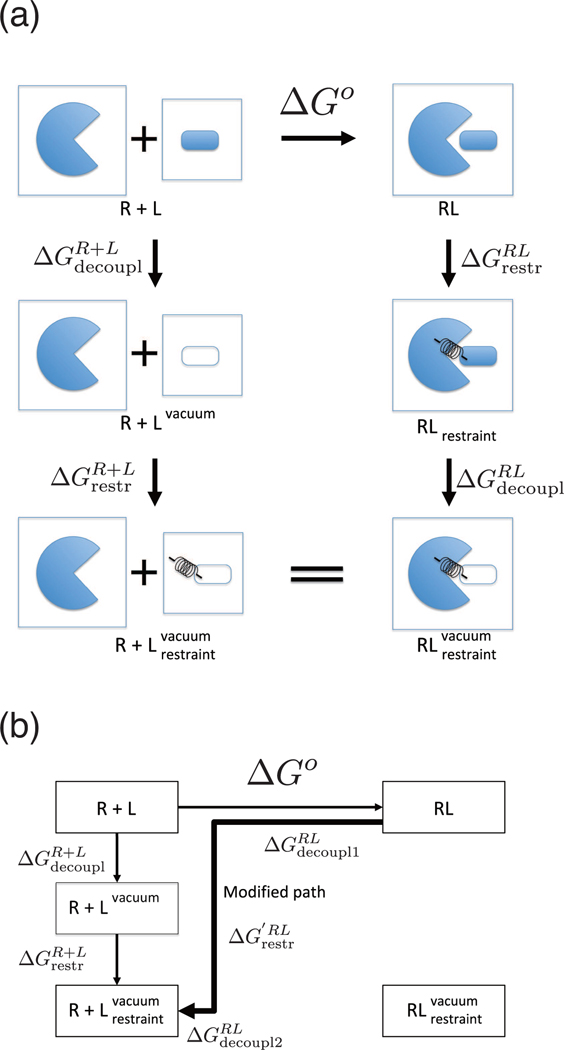
from the thermodynamic cycle in Figure 1. is the free energy of restraining the ligand in the binding site of the receptor when the ligand and the receptor are fully coupled. We used a set of harmonic restraints proposed by Boresch et al3, which has six harmonic potentials, one distance, two bond angles, and three dihedral angles (hereinafter, referred to as BK restraint). is the decoupling process, which turns off the effective binding energy u defined in Eq. (9) between the ligand and the receptor. is the free energy of turning off the restraint between the ligand and the receptor without the nonbonded interactions. These free energy differences can be estimated by free energy perturbation (FEP)31–33 or thermodynamic integration (TI) methods34. See the details for the calculation of in the Appendix and Supporting Information. Note that the values of and depend on the choice of the restraint potentials, but the binding free energy does not depend on the restraint potentials.
Figure 1:
Schematic diagram of the thermodynamic cycle for the single decoupling method. The binding free energy between receptor R and ligand L stands for ΔGo. The binding free energy is calculated by . The binding free energy is calculated by. .
Binding energy distribution analysis method (BEDAM)
In BEDAM, we estimate the binding free energy by using Eq (7) directly. The first term in Eq (7) is the entropic work and does not depend on any specific energetic property of the receptor and the ligand. The second term in Eq (8) can be calculated from a set of binding energies sampled from Hamiltonian Replica-Exchange molecular dynamics (HREMD) simulations29,35–40. The binding energy is a λ-dependent effective potential energy function with implicit solvation, which is defined by
| (11) |
where λ is the free energy progress parameter, u is the effective binding energy in Eq (9), and
| (12) |
is the potential energy of the complex when the receptor and the ligand are dissociated. U and W in Eq.(12) are the potential energy function and the solvent potential of mean force, respectively. If λ = 0, Vλ=0 is the effective potential energy of the bound complex and if λ = 1, Vλ=1 is the state in which the receptor and the ligand are not interacting. Intermediate values of λ trace an alchemical thermodynamic path connecting these two states. We employ a “soft-core” potential energy function near λ = 0 to improve the convergence of the free energy calculations.
Binding free energy calculation for systems with multiple binding poses systems
When SDM is applied to a receptor-ligand system, which has several stable poses of the ligand in the binding site region, it is difficult to determine the restraining position and orientation of the ligand. Namely, if the ligand is restrained to only one conformation, the sampling distribution obtained from the simulation does not fully include configurations of other poses. Therefore, in order to estimate the accurate binding free energy, in the presence of orientational restraints on the fully coupled receptor–ligand complex, it is necessary to calculate the binding free energy independently for each of the poses, which are listed in advance, and then the overall binding free energy can be computed from the separate binding free energy calculations as follows9,11,12,
| (13) |
where Nb is the number of multiple poses. Note that each restrained binding orientation of the ligand does not interconvert with other binding orientations. It can be shown that the equilibrium population pi and pj of binding poses i and j are related to their intrinsic binding free energies
| (14) |
The form of Eq. (13) also suggests that when there are multiple binding poses, the total binding free energy is largely determined by the intrinsic binding free energy of the top pose and the presence of other poses contributes at most a term −kBT lnn to the where n is the number of binding poses. To see this, simply rearrange the terms in the logarithm from the right side of Eq. (13), i.e.
| (15) |
When n = 2, the top pose binding free energy and the true binding free energy differs by ≤ −0.41 kcal/mol. Therefore, in order to accurately estimate the absolute binding free energy, it is of paramount importance to include the top binding pose in the free energy simulation, and missing the remaining weaker poses is of only secondary importance. It is also of interest to consider a related scenario where the ligand binds with multiple conformational macrostates of the receptor, such as the open and closed states of HIV-1 protease flap region41 (see Supporting Information).
Modification of alchemical thermodynamic path
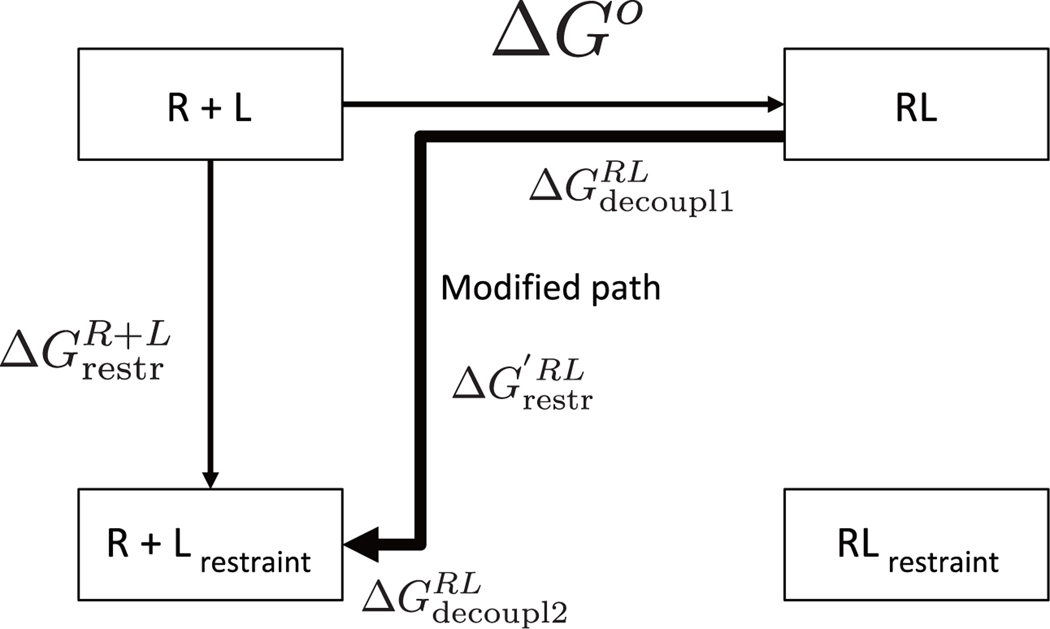
On the other hand, in our MSDM described below, the alchemical thermodynamic path of SDM is changed. The path of the conventional SDM goes through the decoupling process after the restraining process in Figure 1. By contrast, our modified path proceeds through the restraining process during the decoupling process in Figure 2. In the case of the modified path, ΔGo is computed as
| (16) |
Figure 2:
The modified thermodynamic path of SDM. The binding free energy is calculated by .
Here, is the free energy of restraining the ligand in the binding site of the receptor at an intermediate state between RL state and state. and are the decoupling processes before and after restraining the ligand in the binding site of the receptor, respectively. In other words, in this path the λ = 0 fully coupled state and some intermediate decoupling states do not have a restraining potential applied. This enables the sampling distribution to include not only the ensemble of configurations of the restrained pose but also a broader distribution including all the poses. This thermodynamic path allows the binding free energy to be estimated without listing multiple poses and calculating the separate binding free energies as in Eq (13).
Host–Guest binding systems
Host-guest systems serve as highly simplified models for the binding of ligands to protein receptors. The binding of small molecules to cyclodextrins has been widely studied in this regard17–24. In the present study we use β-cyclodextrin (βCD) as a model receptor. The structure is provided in Figure 3(a). The receptor is a frustum-cone-shaped cyclic polymer with a hydrophobic interior core. The narrow opening of the receptor is laced with primary hydroxyls, and the wider opening is laced with secondary hydroxyls. When a polar ligand binds to the receptors, usually there is a possibility to bind in two orientations. We define the bound state, for which the primary hydroxyl groups in βCD forms hydrogen bonds with a carbonyl group of a ligand, as the “UP” state and the bound state, for which the secondary hydroxyl groups of βCD form hydrogen bonds with a carbonyl group of a ligand, as the “DOWN” state. The ligands we employed for the binding systems are Ethyl p-tolylacetate, R-(−)-Mandelic acid and Methyl 2-anilinoacetate, see Figure 4. All the ligands are compounds that contain the carbonyl group as a polar functional group.
Figure 4:
Ligands used in this study. (a) Ethyl p-tolylacetate, (b) R-(−)-Mandelic acid and (c) Methyl 2-anilinoacetate bind to βCD
Protein Receptor–Ligand model binding systems
Our modified thermodynamic path can also be applied to protein–ligand systems with explicit solvent by using DDM. Compared with SDM, the ligand hydration free energy is added to the thermodynamic cycle and the binding free energy of DDM is computed as
| (17) |
in Figure 11(a). Here, is equal to the ligand hydration free energy. The MDDM is similarly computed as
| (18) |
in Figure 11(b).
Figure 11:
(a) Schematic diagram of the thermodynamic cycle for DDM. The binding free energy between receptor R and ligand L stands for . The binding free energy is calculated by . (b) The modified thermodynamic path of DDM. The binding free energy is calculated by .
We applied our modified thermodynamic cycle to a protein–ligand system, phenol binding to T4 lysozymel, with explicit solvent. This protein–ligand complex has served as a model in prior studies of ligand binding involving multiple binding poses9. The protein coordinates were taken from the X-ray apo structure of the T4 lysozyme engineered double-mutant L99A/M102Q (PDB accession code 1LGU)27.
Simulation details
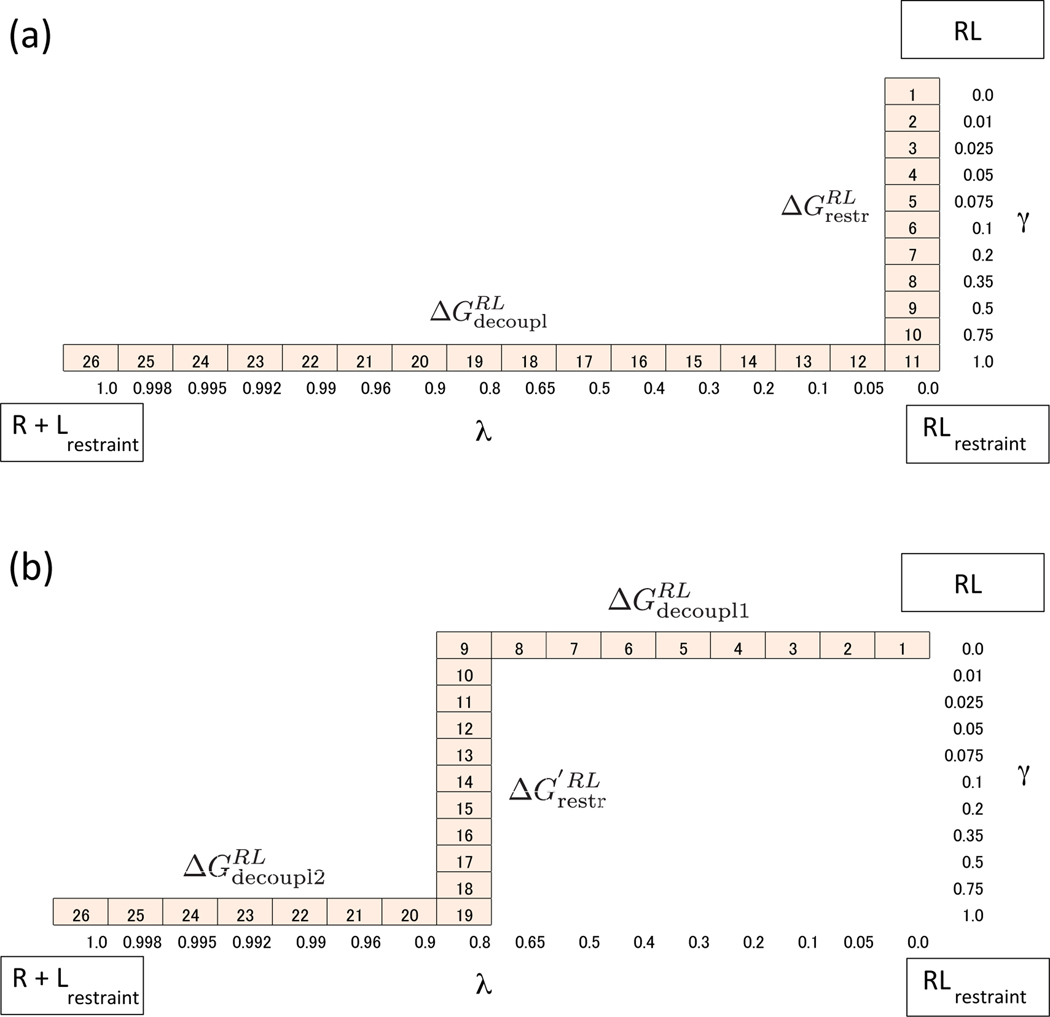
We implemented SDM and MSDM for our binding free energy simulations within the IMPACT program42. H-REMD were performed for the part of the path between the bound RL state and the unbound state, which includes both the restraining and decoupling processes between the ligand and the receptor. We also calculated the binding free energy by using BEDAM14 as a benchmark for comparison with SDM and MSDM. The binding free energies were obtained using the OPLS-AA force field43,44 and the AGBNP245,46 implicit solvent model, which is based on a parameter-free analytical implementation of the pairwise descreening scheme of the generalized Born model47. Bond lengths with hydrogen atoms were constrained using SHAKE48. The mass of hydrogen atoms was set to 5 amu. A 12 Å residue-based cutoff was imposed on both direct and generalized Born pair interactions. In SDM, we need two coupling parameters for the restraint potential and nonbonded interaction referred to as γ and λ, respectively. Eleven values of γ were used, with simulations conducted at γ = { 0.0, 0.01, 0.025, 0.05, 0.075, 0.1, 0.2, 0.35, 0.5, 0.75, 1 } and 16 values of λ were used, with simulations conducted at λ = { 0.0, 0.05, 0.1, 0.2, 0.3, 0.4, 0.5, 0.65, 0.8, 0.9, 0.96, 0.99, 0.992, 0.995, 0.998, 1.0 }. It is noted that restraint potential Urst is scaled as on the other hand, the interaction potential energy is scaled by (1 − λ). We performed H-REMD between the RL state and the state including two coupling parameters γ and λ. The total number of replicas is 26 because the state γ = 1.0 and the state λ = 0.0 are overlapped. The details of the parameter list are shown in Figure 5. All simulations were performed for 6 ns at 300 K, and the last 4 ns of data were used for analysis. We calculated the binding free energies using the unbinned weighted histogram analysis method (UWHAM)49. For the UWHAM analysis, we employed the code provided by Bin W. Zhang (https://ronlevygroup.cst.temple.edu/software/UWHAM_and_SWHAM_webpage/index.html)50. The uncertainties were computed using the bootstrap method.
Figure 5:
Scaling parameters of γ and λ for SDM (a) and MSDM (b). Each cell stands for one state (replica) of H-REMD simulation. The number in the cells is the label of the state.
In this study, we modified thermodynamic paths at the λ = 0.8 state. It should be noted that this specific choice may not necessarily be optimal for other systems. Instead, the specific cases studied here serve to demonstrate that by suitably modifying the standard thermodynamic path in the original SDM or DDM, the sampling of multiple poses can be achieved. For a general procedure to determine the optimal lambda to apply the restraining potential, see the section “Search for the optimal lambda-state to apply restraints in MSDM and MDDM”.
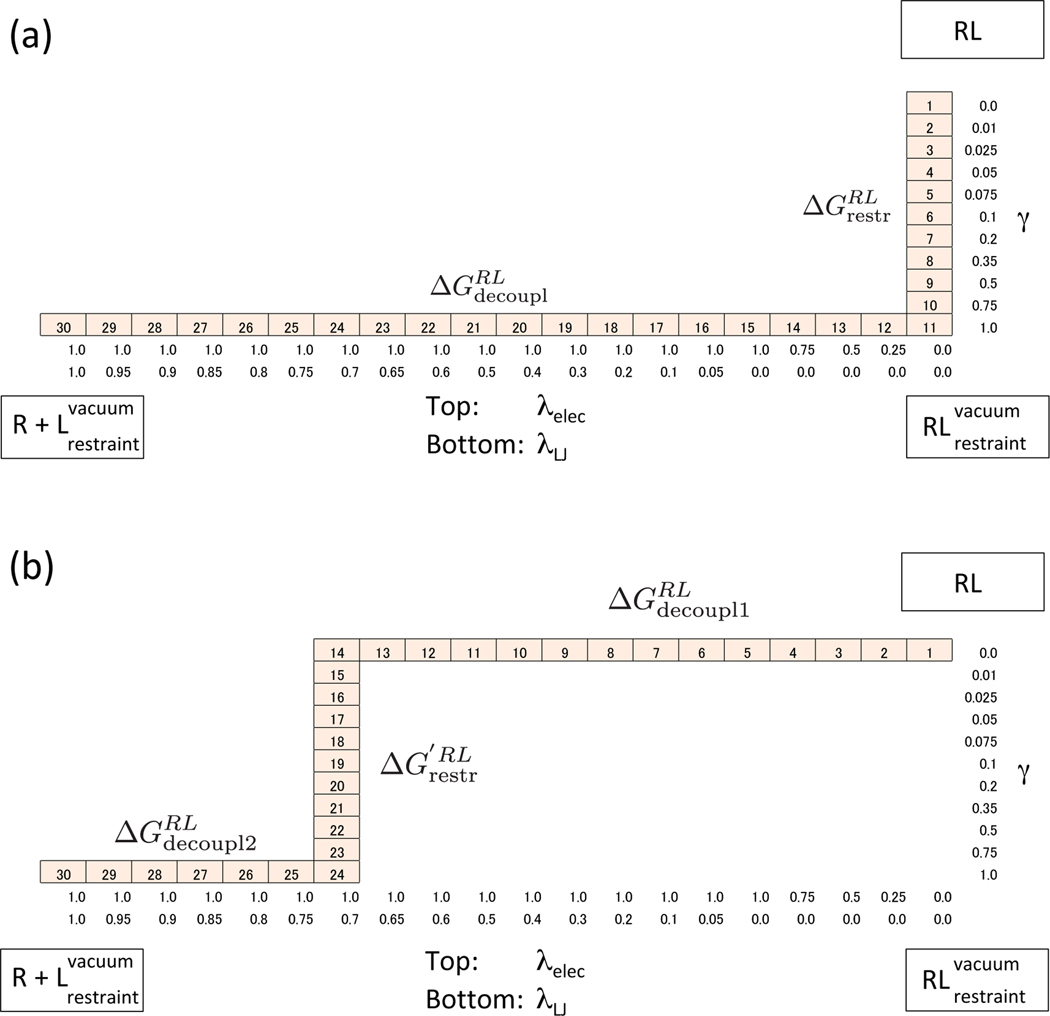
For DDM of the T4 lysozyme–phenol system, we used the GROMACS 2016 program package51. The binding free energies were obtained using the AMBER parm96 force field52 for T4 lysozyme and the TIP3P solvent model53 for the water molecules. Phenol was assigned parameters from the general AMBER force field (GAFF)54 and the partial charges were obtained by the AM1-CM2 method55 computed using AMSOL version 7.156. In order to add the flat bottom restraint potential for Vsite, we employed the pull code, which is implemented in the gmx mdrun program of the GROMACS package. The total number of atoms is 33,870. Short-range interactions were evaluated using a neighbor list of 10 Å updated every ten steps. Electrostatic and Lennard-Jones interactions were evaluated with the particle mesh Ewald (PME) method57. The cut-off distance of 10.0 Å was used for the direct space sum of PME for both interactions. Before the production run, we performed minimization and the equilibrium simulations with NVT and NPT ensemble. For the minimization, the steepest descent algorithm was employed for 5,000 steps. After that, a short equilibrium simulation using stochastic leap-frog integrator with NVT ensemble for 10ps at 300K was performed. All bonds to hydrogen were constrained with LINCS58 and a time step of 2 fs was used for dynamics. Finally, the equilibrium simulation with NPT ensamble for 100ps using the Berendsen barostat59 was performed. After equilibration, we performed H-REMD simulations for the all states in the thermodynamic cycle for 5ns using Parrinello-Rahman barostat60 as the production run. In DDM, we need three coupling parameters, for the restraint potential, the electrostatic interaction and the Lennard-Jones interaction referred to as γ, λelec and λLJ, respectively. Eleven values of γ were used, with simulations conducted at γ = { 0.0, 0.01, 0.025, 0.05, 0.075, 0.1, 0.2, 0.35, 0.5, 0.75, 1 }, five values of λelec were used, with simulations conducted at λelec = { 0.0, 0.25, 0.5, 0.75, 1.0 } and 15 values of λLJ were used, with simulations conducted at λLJ = { 0.0, 0.05, 0.1, 0.2, 0.3, 0.4 0.5, 0.6, 0.65, 0.7, 0.75, 0.8, 0.85, 0.9, 0.95, 1.0 }.
This decoupling notation follows the definition of the GROMACS program. We performed H-REMD between the bound RL state and the unbound state including three coupling parameters γ, λelec and λLJ. The total number of states (replicas) is 30. The details of the parameter list are shown in Figure 12. The binding free energies and the uncertainties were computed using Bennett acceptance ratio method (BAR)61 by the gmx bar program in the GROMACS package.
Figure 12:
Scaling parameters of γ, λelec and λLJ for DDM (a) and MDDM (b). Each cell stands for one state (replica) of H-REMD simulation. The number in the cells is the label of the state. It is noted that λelec and λLJ are scaled by (1-λelec) and (1-λLJ) for each potential energy. Namely, in the case of 0.0, the ligand is fully charged and in the case of 1.0, the ligand has no interaction with itself or its environment. This is the reverse of the case of SDM (IMPACT program) and follows the definition of GROMACS program.
RESULTS AND DISCUSSION
In this section, we calculate binding free energies using our modified thermodynamic path (Figure 5(b)) and compare with the conventional SDM and BEDAM results. Moreover, we also applied our modification to DDM for a protein–ligand system, the results are presented bellow.
BEDAM as benchmark
In this paper, we used BEDAM results as the benchmark for βCD-ligand systems. In BEDAM calculations, only a flat bottom potential restraint, namely, a distance restraint is applied between the receptor and the ligands. However, several investigators have shown that the use of orientational restraints significantly decreases the required length of simulations to obtain converged binding free energy estimates in explicit solvent.9 Therefore, we applied both distance restraints and orientational restraints in SDM, MSDM, DDM, and MDDM simulations when searching the best thermodynamic path for binding affinity calculations.
Simple restraint model
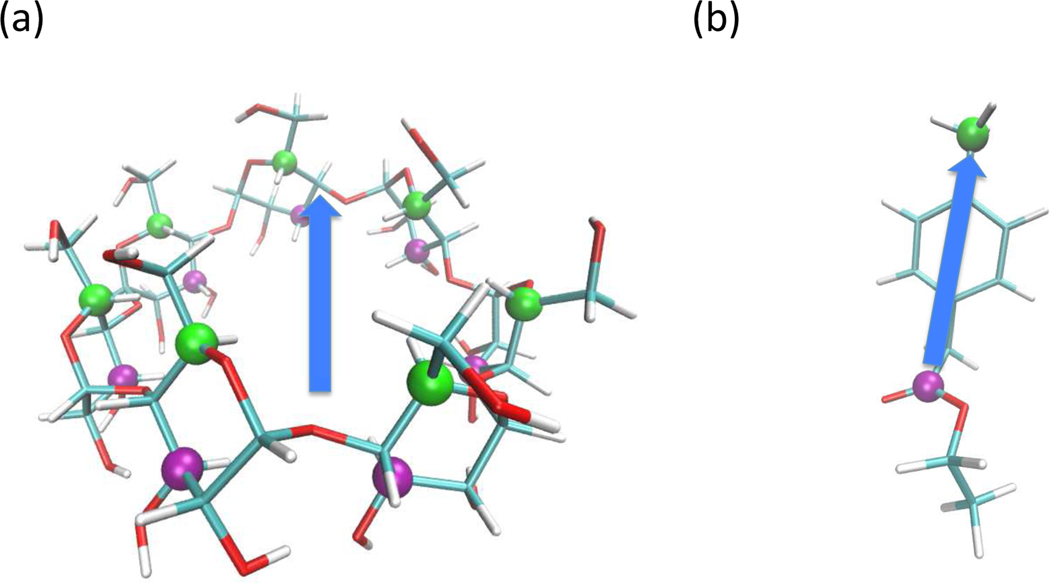
Before using BK restraints for SDM and MSDM, we employed a simple restraint potential more suitable for βCD. The simple restraint has two flat bottom potentials for a distance and an angle. The distance is defined between the center of mass of a ligand and a receptor, and the angle is defined between two vectors, one defined in the host coordinate system and the other the guest, which determine the relative orientation of the ligand in the receptor. In this study, the receptor is βCD, which is composed of 7 α-D-glucopyranoside units. Thus, the vector of the receptor is defined between the mean position of C5 atoms and that of the C3 atoms as shown in the units in Figure 6(a). The vector in the ligand coordinate system is defined by two atoms which sandwich an aromatic ring. The two atoms depend on the kinds of ligands in Figure 6(b). The values of parameters are summarized in Table 5.
Figure 6:
Example of two vectors for the simple restraint potential. One is defined between a mean position of C5 atoms ( green ) and that of C3 atoms ( purple ) for each sugar molecule in β-cyclodextrin (a). Another is defined between two separated atoms ( green and purple ) in Ethyl p-tolylacetate (b).
Table 5:
Parameters for the simple restraint flat bottom potential. System1, system2 and system3 are βCD–Ethyl p-tolylacetate, βCD–R-(−)-Mandelic acid and βCD–Methyl 2anilinoacetate systems, respectively. δ is a tolerance (Å ) for the flat bottom potential of the distance between the receptor and the ligand for center of mass. The force constant kr is 5.0 kcal/(mol Å2) for all systems. δθ is a tolerance (degree) for the flat bottom potential of the angle is defined between two vectors, which indicate orientations of a ligand and a receptor The force constant kθ is 5.0 kcal/(mol rad2). The vectors of Ethyl p-tolylacetate and R-(−)-Mandelic acid, Methyl 2-anilinoacetate are defined by C11→C10, C11→C8 and C11→C10, respectively.
| System1 | System2 | System3 | |
|---|---|---|---|
| δ | 2.609 | 3.408 | 3.195 |
| δθ | 22.805 | 17.719 | 14.069 |
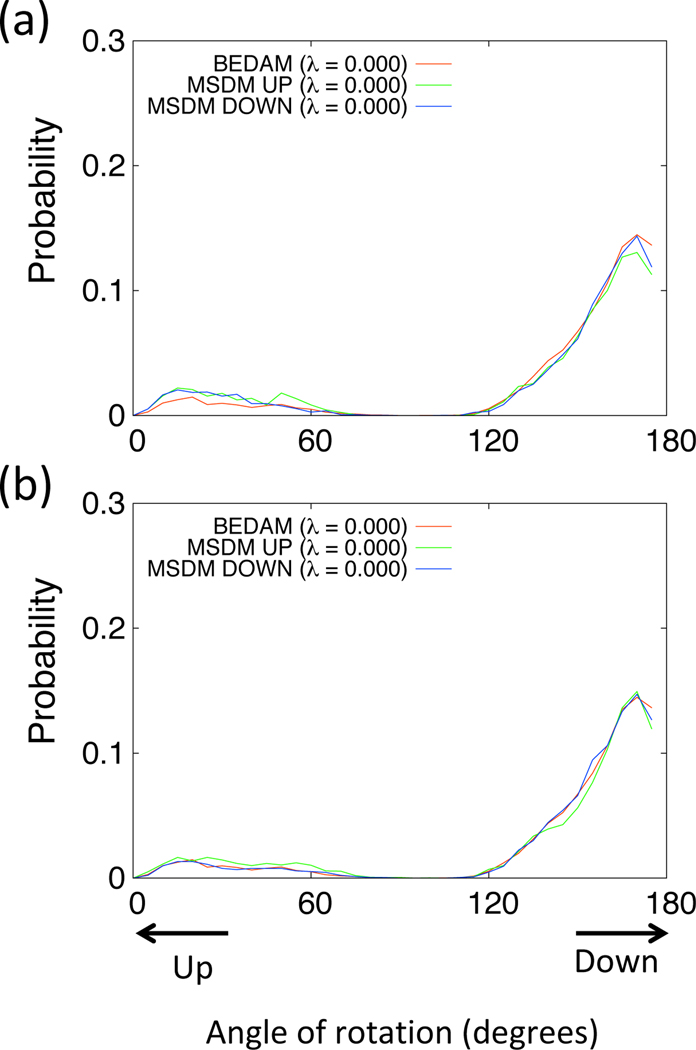
In Table 1, the binding free energies of βCD–Ethyl p-tolylacetate system obtained from BEDAM, SDM, and MSDM are listed. From the results of SDM, we can observe the difference of the binding free energies between the UP state and DOWN state (∼ 1.37 kcal/mol), the DOWN state is more stable than UP state. The final value of the binding free energy is calculated from these two binding free energies by using Eq (13), and is in good agreement with the result of BEDAM. Although the binding free energy of the DOWN state is also similar to that of BEDAM, we consider that DOWN state is much more stable than the other conformations in the case of βCD–Ethyl p-tolylacetate system. On the other hand, the two binding free energies of both DOWN state and UP state obtained from the MSDM are similar to that of BEDAM. Even though the restraint potential is applied to the conformation of the UP state, the binding free energy is in agreement with that of BEDAM. We can see that this tendency is similar in the other systems studied: βCD–R-(−)-Mandelic acid (Table 2) and βCD–Methyl 2-anilinoacetate (Table 3). In Figure 8(a), we plotted the probabilities of the angle of rotation of the ligand obtained from BEDAM and MSDM (UP and DOWN states) at the fully coupled state (λ = 0.0). The two probabilities from MSDMs are in good agreement with that of the benchmark BEDAM.
Table 1:
Binding free energies of Ethyl p-tolylacetate calculated from BEDAM, SDM, and MSDM. “Total” in SDM is calculated by Eq (13).
| ΔGo | |||
|---|---|---|---|
| BEDAM | −2.412 ± 0.04 | ||
| Simple restraint | BK restraint | ||
| SDM | ΔGo UP state | −1.069 ± 0.04 | −0.778 ± 0.07 |
| ΔGo DOWN state | −2.435 ± 0.04 | −2.246 ± 0.07 | |
| Total (Eq.13) | −2.492 ± 0.03 | −2.294 ± 0.06 | |
| MSDM (starting from UP state) | −2.269 ± 0.06 | −2.310 ± 0.08 | |
| MSDM (starting from DOWN state) | −2.234 ± 0.05 | −2.219 ± 0.08 | |
Table 2:
Binding free energies of R-(−)-Mandelic acid calculated from BEDAM, SDM, and MSDM. “Total” in SDM is calculated by Eq (13).
| ΔGo | |||
|---|---|---|---|
| BEDAM | −1.246 ± 0.04 | ||
| Simple restraint | BK restraint | ||
| SDM | ΔGo UP state | −0.233 ± 0.05 | −0.574 ± 0.10 |
| ΔGo DOWN state | −1.331 ± 0.05 | −1.021 ± 0.07 | |
| Total (Eq.13) | −1.419 ± 0.04 | −1.252 ± 0.06 | |
| MSDM (starting from UP state) | −1.059 ± 0.06 | −1.370 ± 0.07 | |
| MSDM (starting from DOWN state) | −1.284 ± 0.06 | −1.298 ± 0.05 | |
Table 3:
Binding free energies of Methyl 2-anilinoacetate calculated from BEDAM, SDM, and MSDM. “Total” in SDM is calculated by Eq (13).
| ΔGo | |||
|---|---|---|---|
| BEDAM | −2.421 ± 0.03 | ||
| Simple restraint | BK restraint | ||
| SDM | ΔGo UP state | −1.359 ± 0.04 | −1.632 ± 0.07 |
| ΔGo DOWN state | −2.298 ± 0.07 | −2.630 ± 0.07 | |
| Total (Eq.13) | −2.410 ± 0.05 | −2.732 ± 0.05 | |
| MSDM (starting from UP state) | −2.541 ± 0.05 | −2.548 ± 0.07 | |
| MSDM (starting from DOWN state) | −2.477 ± 0.05 | −2.415 ± 0.08 | |
Figure 8:
Probabilities of the rotation of Ethyl p-tolylacetate for β-cyclodextrin from BEDAM (red) and MSDM (green and blue) at λ = 0.0. The green and blue indicate from MSDM using the simple restraint potential (a) and BK potential (b) for UP state and DOWN state, respectively.
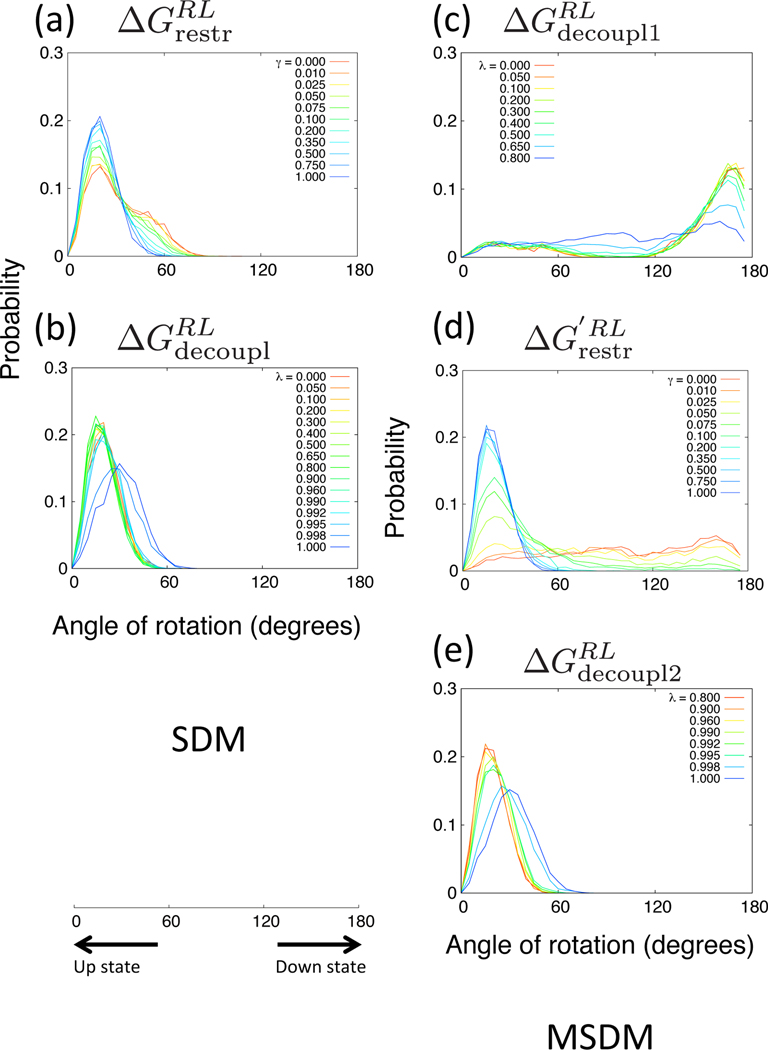
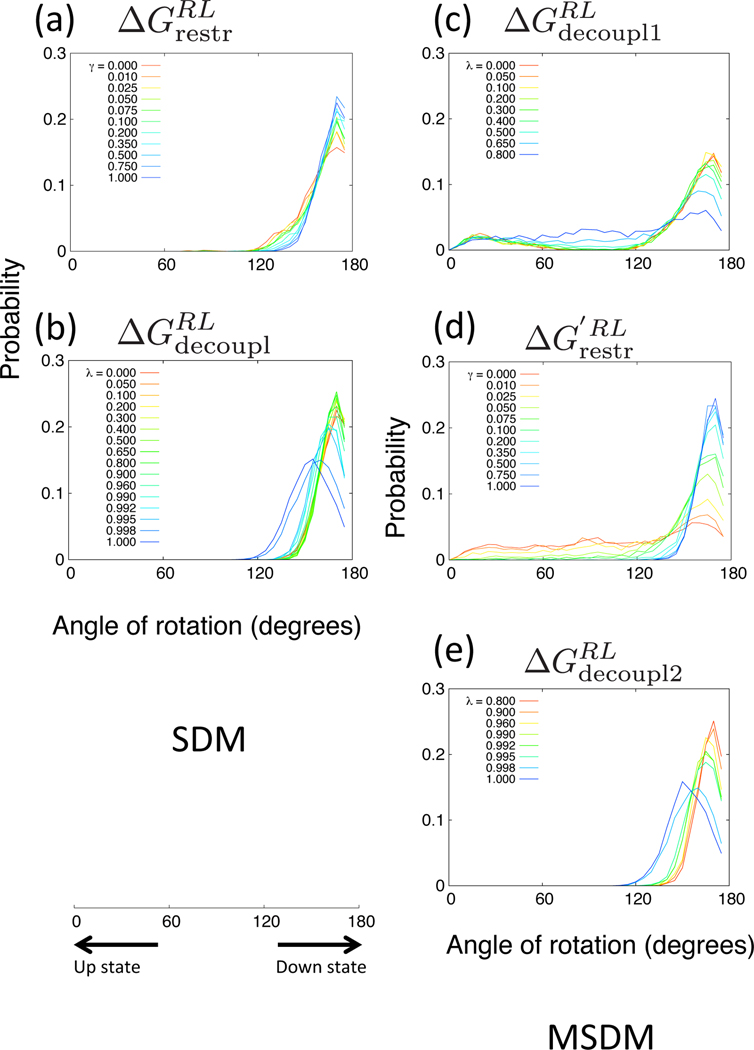
In order to examine the configurations between RL and states, we plotted the probabilities of the angle of rotation of the ligand for each thermodynamic process. In Figures 9 and 10, the probabilities obtained from SDM and MSDM of βCD–Ethyl p-tolylacetate system with the restraints of UP-state and DOWN-state are plotted, respectively. We can see that in the case of SDM, the probabilities of all thermodynamic processes of and are biased in only one direction, UP or DOWN. On the other hand, in the case of MSDM, the several probability distributions in the processes of and span both UP and DOWN states. Thus, MSDM can explore broader configuration space than does SDM. In the case of process with UP-state restraint in Figure 9(c), despite the initial state is UP, many states of the λ states have the peaks at the angle of DOWN state, and then, in the case of process in Figure 9(d), as γ values become larger, the peaks shift to UP state. Consequently, the MSDM can sample the configurations of the DOWN state although the method has the restraint potential applied to the UP state at an intermediated decoupled state (see Figure 5(b) about specific decoupling parameters). In the case of process with DOWN-state restraint in Figure 10(c), when λ values are low (close to 0.2), the distributions become broad. In addition, when γ values are low (close to zero) in the case of process in Figure 10(d), the distributions also become broad. The point of the MSDM is to sample a broad distribution of positions and orientations of the ligand by decreasing the interaction between the ligand and the receptor before restraining the orientation. Thus, the MSDM can obtain the configurations of various orientations of the ligand for multiple posed systems.
Figure 9:
Probabilities of the rotation of Ethyl p-tolylacetate for β-cyclodextrin. The thermodynamic processes (a) and (b) are in SDM. The processes (c), (d) and (e) are in MSDM. The simple restraint potential is used and the stable and initial conformations are UP state.
Figure 10:
Probabilities of the rotation of Ethyl p-tolylacetate for β-cyclodextrin. The thermodynamic processes (a) and (b) are in SDM. The processes (c), (d) and (e) are in MSDM. The simple restraint potential is used and the stable and initial conformations are DOWN state.
When the λ values increase from 0.995 to 1, the peaks of the distribution shift about 10 degrees smaller or larger in Figure 9(b), (e) or Figure 10(b), (e), respectively. These shifts are due to the overlaps between the ligand and βCD because the interactions between these two molecules are nearly or totally turned off at these Hamiltonian states.
BK restraint model
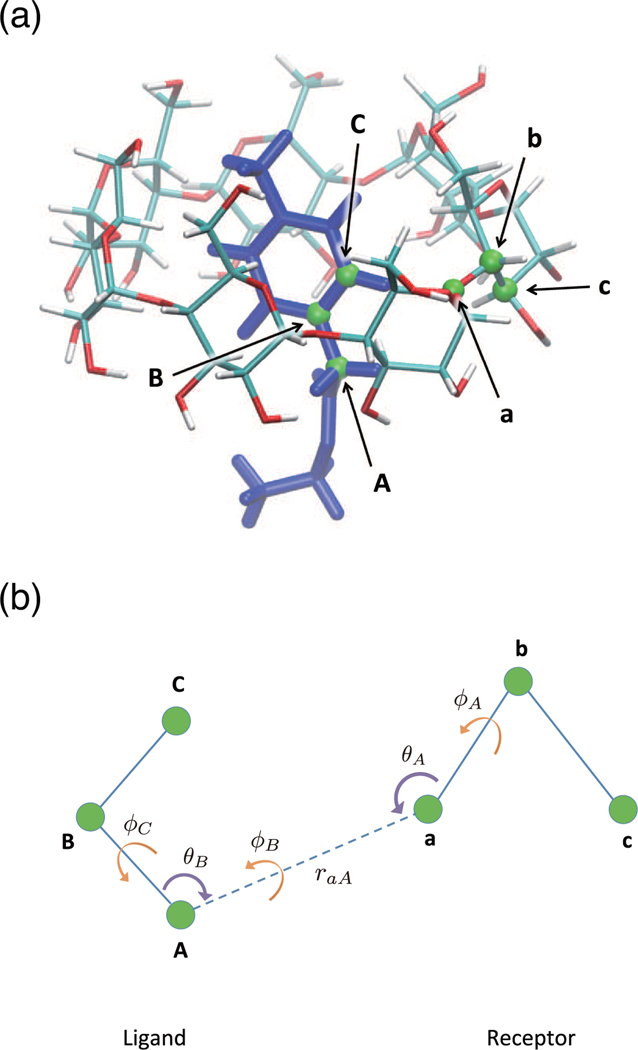
We also employed the BK restraint potential for SDM and MSDM. The BK restraint model has wide usage for not only βCD–ligand systems but also general receptor-ligand systems. It has six harmonic potentials, which are defined by three atoms of a receptor and three atoms of a ligand in Figure 7. These six harmonic potentials are defined by , , , , , and. Here, raA is a distance between atom A in the ligand and atom a in the receptor, θA is a bond angle between atom A in the ligand, atoms a and b in the receptor, θB is a bond angle between atoms B and A in the ligand and atom a in the receptor, is a dihedral angle between atom A in the ligand, atoms a, b and c in the receptor, is a dihedral angle between atoms A and B in the ligand, atoms a and b in the receptor and is a dihedral angle between atoms C, B and A in the ligand, atom a in the receptor. and are the equilibrium positions of the above variables. and are force constants corresponding to the above harmonic potentials. The values of parameters are summarized in Table 6.
Figure 7:
Example of selected atoms for BK restraint. (a) A conformation of Ethyl ptolylacetate - β-cyclodextrin system. Green atoms stand for the six selected atoms for BK restraint. Each character is corresponding to the character in the schematic picture (b), which shows the six degrees of freedom of the restraint, one distance raA, two bond angles θA and θB, and three dihedral angles , and .
Table 6:
Parameters for the BK restraint potential. S1, S2 and S3 are βCD–Ethyl ptolylacetate, βCD–R-(−)-Mandelic acid and βCD–Methyl 2-anilinoacetate systems, respectively. UP and DOWN stand for the restraint position of UP state and DOWN state, respectively. All distances are in angstroms and all angles are in degrees. The all force constants, kraA, kθA, kθB, kφA, kφB and kφC, are 5.0 kcal/(mol Å2) and 5.0 kcal/(mol rad2), respectively. These parameters are used for six harmonic potentials in Subsection “BK restraint model”.
| S1 (UP) | S1 (DOWN) | S2 (UP) | S2 (DOWN) | S3 (UP) | S3 (DOWN) | |
|---|---|---|---|---|---|---|
| raA,0 | 4.433 | 6.000 | 5.194 | 6.741 | 5.039 | 5.956 |
| θA,0 | 78.972 | 54.029 | 66.925 | 58.042 | 61.105 | 48.285 |
| θB,0 | 110.527 | 128.413 | 109.115 | 115.112 | 106.634 | 115.733 |
| ϕA,0 | 114.986 | −36.844 | 157.447 | 8.617 | 46.294 | −65.854 |
| ϕB,0 | 111.075 | −52.454 | 127.122 | −97.071 | 74.013 | −85.353 |
| ϕC,0 | −104.163 | −53.823 | −101.645 | −11.673 | −70.201 | −52.658 |
In Tables 1–3, the binding free energies of the four systems obtained by using BK restraint potential are also listed. The results show that the tendencies of the binding free energies are the same as those of simple restraint potential. In Figure 8(b), we plotted the probabilities of the angle of rotation of the ligand obtained from BEDAM and MSDM (UP and DOWN states) with BK restraint potential at the fully coupled state (λ = 0.0). The two probabilities from MSDMs are also in good agreement with that of the benchmark BEDAM. In addition, the probabilities of the angle of rotation of the ligand also are similar to those of simple restraint potential (see Figures S1 and S2). Thus, we consider that the MSDM is effective for the calculation of the binding free energy regardless of the kinds of restraint potentials employed.
Application to a protein system with explicit solvent
We applied MDDM to the T4 lysozyme–phenol system as an example using two binding modes. One is a stable state from X-ray experiment27 and another is one of the metastable conformations obtained from equilibrium simulations at 200K. We refer to the stable state and one of the states of local minima as state A and state B, respectively. In Figure 13, the binding modes of both states are shown. The six atoms defined by BK restraint potential, atom a, atom b, atom c, atom A, atom B and atom C, correspond to and , respectively. The values of parameters for BK restraint potential are summarized in Table 7. In addition, a symmetry number correction is applied to correct the computed free energy for the phenol9. The symmetry number is 2 and we applied the symmetry correction to the binding free energy .
Table 7:
Parameters for the BK restraint potential for T4 lysozyme–phenol system. All distances are in angstroms and all angles are in degrees. The all force constants, kraA, kθA, kθB, kφA, kφB and kφC, are 10.0 kcal/(mol Å2) and 10.0 kcal/(mol rad2), respectively. These parameters are used for six harmonic potentials in Subsection “BK restraint model”.
| State A | State B | |
|---|---|---|
| raA,0 | 4.94 | 6.000 |
| θA,0 | 88.1 | 54.029 |
| θB,0 | 144.1 | 128.413 |
| ϕA,0 | −50.2 | −36.844 |
| ϕB,0 | −47.3 | −52.454 |
| ϕC,0 | 162.3 | −53.823 |
In Table 4, the binding free energies of the system obtained from DDM and SDDM are listed. From the results of DDM, we can observe the difference of the binding free energies between the state A and state B (∼ 1.66 kcal/mol). The total binding free energy calculated from these two binding modes is −4.844 kcal/mol. In the case of MDDM, both binding free energies calculated from these two binding modes are −4.691 and −5.033 kcal/mol. The average of these values is −4.862 kcal/mol, which is very close to the total binding free energy of DDM (= −4.844 kcal/mol) calculated using Eq. (13). We consider that our modification is also efficient for DDM using protein–ligand system with explicit solvent.
Table 4:
Binding free energies of T4 lysozyme–phenol system calculated from DDM and MDDM. “Total” in DDM is calculated by Eq (13).
| ΔGo | ||
|---|---|---|
| DDM | ΔGo state A | −4.808 ± 0.33 |
| ΔGo state B | −3.147 ± 0.64 | |
| Total (Eq.13) | −4.844 ± 0.32 | |
| MDDM (starting from state A) | −4.691 ± 0.21 | |
| MDDM (starting from state B) | −5.033 ± 0.29 | |
Search for the optimal λ-state to apply restraints in MSDM and MDDM
The following procedure is a possible approach to search for the optimal λ-state to apply restraints in MSDM and MDDM. We first run a short BEDAM-like Hamiltonian replica exchange (RE) simulation to identify binding poses. In this RE simulation, the interactions between the receptor and ligand are controlled by the free energy progress parameter λ. A flat bottom restraint that defines the effective binding site volume Vsite is employed. However, no orientation restraints are used to restrict the orientation of the ligand relative to the receptor. Then we examine the trajectory generated in the fully coupled state to look for multiple binding poses. If multiple binding poses are observed, the binding affinity will be estimated by using MSDM or MDDM.
An optimal intermediate λ for applying the orientation restraints in MSDM or MDDM serves two purposes: (1) to be able to sample the multiple poses reversibly in a number of λ-states including the fully coupled state; (2) to confine the system into a narrow range of orientations in as many thermodynamic states as possible to accelerate the convergence. Applying the orientation restraints at a λ-state at which the receptor-ligand coupling is too strong is not useful, because at such states the system only explores the neighborhood of the initial pose, the same as in the standard SDM or DDM methods. On the other hand, the MSDM or MDDM simulations are difficult to converge if applying the orientation restraints at a λ-state where the coupling between the receptor and the ligand are too weak. In the convention adopted in this study, the receptor-ligand coupling increases with decreasing values of λ, i.e. λ=1 corresponds to the decoupled state while λ=0 corresponds to the fully coupled state. Therefore, we run trial simulations to search for the states at which multiple binding poses are sampled and then choose the state with the smallest λ value to apply the orientation restraints in MSDM or MDDM.
CONCLUSIONS
We proposed a modified alchemical absolute binding free energy calculation method, which changes part of the thermodynamic path (see Figure 2). In the conventional path, the orientation of the ligand is always restrained to a predetermined state relative to the receptor during the thermodynamic path. On the other hand, in the modified SDM, the orientation is initially unrestrained when the interaction between the ligand and the receptor decreases before finally restraining the orientation of the ligand. This method results in broader distribution of the configurational space of ligands in the binding site, when it is fully coupled than that of the original method allows. Thus, even though the restrained orientation may not correspond to the most stable configuration of the system, the binding free energy can be accurately estimated.
We performed modified SDM simulations for three model systems, and compared the binding free energies with those of the SDM and BEDAM. In this study, the binding free energies obtained from the BEDAM simulation are used as benchmarks. We also used two kinds of restraint potentials. One is a simple restraint potential, which represents the UP state and DOWN state of the systems by using two vectors defined by the orientations of the ligand and receptor. Another is the BK restraint potential, which represents a set of six harmonic potentials, and is often applied for the general method3,9. The results showed that the all the binding free energies obtained from the modified SDM are very close to those of the benchmark BEDAM results without depending on the choice of the restrained orientation to UP or DOWN states, whereas the standard SDM calculations without using Eq. (13) to explicitly enumerate the multiple binding poses does not give the correct binding free energy values. In addition, the tendencies are the same for both the simple restraint and BK restraint.
The probabilities of the angle of orientations of the ligand depict that the thermodynamic processes of and of the modified SDM have broad probabilities of both the UP and DOWN states. Thus, when the restraint potential is weak or zero and the interaction between the ligand and receptor are weakened by λ, the ligands are able to cross the reduced barrier between the UP and DOWN states. And coupled with the Hamiltonian Replica Exchange process, these results in broad sampling even in the fully decoupled states. We have also applied our modification to DDM using T4 lysozyme–phenol system with explicit solvent as an example. The result showed that the binding free energies obtained from two binding modes using modified DDM were in good agreement with that of DDM when the two binding modes are explicitly considered.
In summary, we have shown that our new method provides a more robust solution to absolute binding free energy calculation for receptor–ligand systems with multiple binding poses. For such systems the original SDM and DDM methods that restrain the ligand orientation to a specific pose in order to accelerate convergence requires the knowledge of the precise orientations of the different binding modes. In practice, these traditional methods could be at risk of missing the strongest binding mode, which as we have shown in this report would lead to significant errors in the estimated binding free energy. In the new method described here the orientations of each of the binding modes do not need to be precisely known, instead, a modified thermodynamic path is used to facilitate broader sampling of the configuration space of receptor-ligand without sacrificing the efficiency of the original SDM or DDM.
Supplementary Material
ACKNOWLEDGMENTS
This work has been supported by grants from the NIH, GM30580 and S10-OD020095–01, and by an NSF XSEDE grant TG-MCB100145.
APPENDIX: Parameters of restraint potentials
In this study, we used two kinds of restraint potentials: the simple restraint and the BK restraint. For the three βCD–ligand systems with the simple restraint, we employed the two flat bottom potentials for the distance and angle. The details of the parameters are listed in Table 5. For the three βCD–ligand systems with the BK restraint, we employed the six harmonic potentials. The details of the parameters are listed in Table 6. For the T4 lysozyme–phenol system with the BK restraint, the details of the parameters are listed in Table 7.
References
- 1.Jorgensen WL, Science 303, 1813 (2004). [DOI] [PubMed] [Google Scholar]
- 2.Hermans J and Wang L, J Am Chem Soc 119, 2707 (1997). [Google Scholar]
- 3.Boresch S, Tettinger F, Leitgeb M, and Karplus M, J Phys Chem B 107, 9535 (2003). [Google Scholar]
- 4.Fujitani H, Tanida Y, Ito M, Jayachandran G, Snow CD, Shirts MR, Sorin EJ,and S PV, J Chem Phys 123, 084108 (2005). [DOI] [PubMed] [Google Scholar]
- 5.Mobley DL, Graves AP, Chodera JD, McReynolds AC, Shoichet BK, and Dill KA, J Mol Biol 371, 1118 (2007). [DOI] [PMC free article] [PubMed] [Google Scholar]
- 6.Boyce SE, Mobley DL, Rocklin GJ, Graves AP, Dill KA, and Shoichet BK, J Mol Biol 394, 747 (2009). [DOI] [PMC free article] [PubMed] [Google Scholar]
- 7.Gilson MK, Given JA, Bush BL, and J MA, Biophys J 72, 1047 (1997). [DOI] [PMC free article] [PubMed] [Google Scholar]
- 8.Deng N, Zhang P, Cieplak P, and Lai L, J Phys Chem B 115, 11902 (2011). [DOI] [PMC free article] [PubMed] [Google Scholar]
- 9.Mobley D, Chodera J, and Dill K, J Chem Phys 125, 084902 (2006). [DOI] [PMC free article] [PubMed] [Google Scholar]
- 10.Wang K, Chodera JD, Yang Y, and Shirts MR, J Comput Aided Mol Des 27, 989 (2013). [DOI] [PMC free article] [PubMed] [Google Scholar]
- 11.Henriksen NM, Fenley AT, and Gilson MK, J Chem Theory Comput 11, 4377 (2015). [DOI] [PMC free article] [PubMed] [Google Scholar]
- 12.Kaus JW, Harder E, Lin T, Abel R, McCammon JA, and Wang L, J Chem Theory Cumput 11, 2670 (2015). [DOI] [PMC free article] [PubMed] [Google Scholar]
- 13.Kilburg D and Gallicchio E, Front Mol Biosci 5, 1 (2018). [DOI] [PMC free article] [PubMed] [Google Scholar]
- 14.Gallicchio E, Lapelosa M, and Levy RM, J Chem Theory Comput 6, 2961 (2010). [DOI] [PMC free article] [PubMed] [Google Scholar]
- 15.Gallicchio E and Levy R, J Comput Aided Mol Des 25, 505 (2012). [DOI] [PMC free article] [PubMed] [Google Scholar]
- 16.Wickstrom L, He P, Gallicchio E, and Levy RM, J Chem Theory Comput 9, 3136 (2013). [DOI] [PMC free article] [PubMed] [Google Scholar]
- 17.Chen W, Chang C, and Gilson MK, Biophys J 87, 3035 (2004). [DOI] [PMC free article] [PubMed] [Google Scholar]
- 18.Rekharsky M and Inoue Y, Chem Rev 98, 1875 (1998). [DOI] [PubMed] [Google Scholar]
- 19.Rekharsky M and Inoue Y, J Am Chem Soc 122, 4418 (2000). [Google Scholar]
- 20.Rekharsky M and I. Y. of the Chemical, J Am Chem Soc 124, 12361 (2002). [DOI] [PubMed] [Google Scholar]
- 21.Szejtli J, Chem Rev 98, 1743 (1998). [DOI] [PubMed] [Google Scholar]
- 22.Del Valle E, Process biochemistry 39, 1033 (2004). [Google Scholar]
- 23.Wickstrom L, He P, Gallicchio E, and Levy RM, J Chem Theory Cumput 9, 3136 (2013). [DOI] [PMC free article] [PubMed] [Google Scholar]
- 24.Wickstrom L, Deng N, He P, Mentes A, Nguyen C, Gilson MK, Kurtzman T,Gallicchio E, and Levy RM, J Mol Recognit 29, 10 (2016). [DOI] [PMC free article] [PubMed] [Google Scholar]
- 25.Eriksson A, Baase W, Wozniak J, and Matthews B, Nature 355, 371 (1992). [DOI] [PubMed] [Google Scholar]
- 26.Morton A, Baase W, and Matthews B, Biochemistry 34, 8564 (1995). [DOI] [PubMed] [Google Scholar]
- 27.Wei BQ, Baase WA, Weaver LH, Matthews BW, and Shoichet BK, J MolBiol 322, 339 (2002). [DOI] [PubMed] [Google Scholar]
- 28.Deng Y, of, and Roux B, J Chem Theory Comput 2, 1255 (2006). [DOI] [PubMed] [Google Scholar]
- 29.Jiang W and Roux B, J Chem Theory Comput 6, 2559 (2010). [DOI] [PMC free article] [PubMed] [Google Scholar]
- 30.Roux B and Simonson T, Biophys. Chem 78, 1 (1999). [DOI] [PubMed] [Google Scholar]
- 31.Zwanzig RW, J Chem Phys 22, 1420 (1954). [Google Scholar]
- 32.Lybrand TP, McCammon JA, and Wipff G, Proc Natl Acad Sci USA 83, 833 (1986). [DOI] [PMC free article] [PubMed] [Google Scholar]
- 33.Jorgensen WL and Ravimohan C, J Chem Phys 83, 3050 (1985). [Google Scholar]
- 34.Kirkwood GJ, J Chem Phys 3, 300 (1935). [Google Scholar]
- 35.Woods C, Essex J, and King M, J Phys Chem B 107, 13703 (2003). [Google Scholar]
- 36.Woods C, Essex J, and King M, J Phys Chem B 107, 13711 (2003). [Google Scholar]
- 37.Min D, Li H, Li G, Bitetti-Putzer R, and Yang W, J Chem Phys 126, 144109(12pages) (2007). [DOI] [PubMed] [Google Scholar]
- 38.Jiang W, Hodoscek M, and Roux B, J Chem Theory Comput 5, 2583 (2009). [DOI] [PMC free article] [PubMed] [Google Scholar]
- 39.Meng Y, Dashti DS, and Roitberg AE, J Chem Theory Comput 7, 2721 (2011). [DOI] [PMC free article] [PubMed] [Google Scholar]
- 40.Gallicchio E and Levy R, Curr Opin Struct Biol 21, 161 (2011). [DOI] [PMC free article] [PubMed] [Google Scholar]
- 41.Deng N, Zheng W, Gallicchio E, and Levy RM, J Am Chem Soc 133(24), 9387 (2011). [DOI] [PMC free article] [PubMed] [Google Scholar]
- 42.Banks JL, Beard HS, Cao Y, Cho AE, Damm W, Farid R, Felts AK, Halgren TA, Mainz DT, Maple JR, et al. , J Comput Chem 26, 1752 (2005). [DOI] [PMC free article] [PubMed] [Google Scholar]
- 43.Jorgensen WL, Maxwell DS, and Tirado-Rives J, J. Am. Chem. Soc. 118, 11225 (1996). [Google Scholar]
- 44.Kaminski GA, Friesner RA, Tirado-Rives J, and Jorgensen WL, J. Phys. Chem. B 105, 6474 (2001). [Google Scholar]
- 45.Gallicchio E and Levy RM, J Comput Chem 25, 479 (2004). [DOI] [PubMed] [Google Scholar]
- 46.Gallicchio E, Paris K, and Levy RM, J. Chem. Theory Comput. 5, 2544 (2009). [DOI] [PMC free article] [PubMed] [Google Scholar]
- 47.Feig M and Brooks CL, Curr Opin Struct Biol 14, 217 (2004). [DOI] [PubMed] [Google Scholar]
- 48.Ryckaert J, Ciccotti G, and Berendsen HJ, J Comput Phys 23, 327 (1977). [Google Scholar]
- 49.Tan Z, Gallicchio E, Lapelosa M, and Levy RM, J Chem Phys 136, 144102 (2012). [DOI] [PMC free article] [PubMed] [Google Scholar]
- 50.Zhang BW, Arasteh S, and Levy RM, Sci Rep 9, 2803 (9pages) (2019). [DOI] [PMC free article] [PubMed] [Google Scholar]
- 51.Abraham MJ, van der Spoel D, Lindahl E, Hess B, and the GROMACS development team, Gromacs user manual version 2016.3, www.gromacs.org (2017).
- 52.Kollman P, Acc Chem Res 29, 461 (1996). [Google Scholar]
- 53.Jorgensen WL, Chandrasekhar J, Madura JD, Impey RW, and Klein ML, J.Chem. Phys. 79, 926 (1983). [Google Scholar]
- 54.Wang J, Wolf RM, Caldwell JW, Kollman PA, and Case DA, J Comput Chem 25, 1157 (2004). [DOI] [PubMed] [Google Scholar]
- 55.Li J, Zhu T, Cramer CJ, and Truhlar DG, J Phys Chem A 102, 1820 (1998). [Google Scholar]
- 56.Hawkins GD, Giesen DJ, Lynch GC, Chambers CC, Rossi I, Storer JW, Li J, Thompson JD, Winget P, Lynch BJ, et al. , Amsol, https://comp.chem.umn.edu/amsol/.
- 57.Essmann U, Perera L, Berkowitz ML, Darden T, Lee H, and Pedersen LG, J Chem Phys 103, 8577 (1995). [Google Scholar]
- 58.Hess B, Bekker H, Berendsen HJC, and Fraaije JGEM, J Comput Chem 18, 1463 (1997). [Google Scholar]
- 59.Berendsen HJC, Postma JPM, van Gunsteren WF, DiNola A, and Haak JR, J Chem Phys 81, 3684 (1984). [Google Scholar]
- 60.Parrinello M and R. A. of physics, J Appl Phys 52, 7182 (1981). [Google Scholar]
- 61.Bennett CH, J Comput Phys 22, 245 (1976). [Google Scholar]
Associated Data
This section collects any data citations, data availability statements, or supplementary materials included in this article.


