PLOS ONE logoLink to PLOS ONE
. 2020 Apr 8;15(4):e0230858. doi: 10.1371/journal.pone.0230858

Therapeutic turnaround times for common laboratory tests in a tertiary hospital in Kenya

Thomas Mwogi 1,2,7,*, Tim Mercer 8, Dan N (Tina) Tran 9, Ronald Tonui 3,4, Thorkild Tylleskar 1, Martin C Were 5,6,7
Editor: Helena Kuivaniemi10
PMCID: PMC7141613  PMID: 32267844

Abstract

Access to efficient laboratory services is critical to patient care. Turnaround Time (TAT) is one of the most important measures when judging the efficiency of any laboratory and care system. Few studies on TAT exist for inpatient care settings within low- and middle-income countries (LMICs).

Methods

We evaluated therapeutic TAT for a tertiary hospital in Western Kenya, using a time-motion study focusing specifically on common hematology and biochemistry orders. The aim was to determine significant bottlenecks in diagnostic testing processes at the institution.

Results

A total of 356 (155 hematology and 201 biochemistry) laboratory tests were fully tracked from the time of ordering to availability of results to care providers. The total therapeutic TAT for all tests was 21.5 ± 0.249 hours (95% CI). The therapeutic TAT for hematology was 20.3 ± 0.331 hours (95% CI) while that for biochemistry tests was 22.2 ± 0.346 hours (95% CI). Printing, sorting and dispatch of the printed results emerged as the most significant bottlenecks, accounting for up to 8 hours of delay (Hematology—8.3 ± 1.29 hours (95% CI), Biochemistry—8.5 ± 1.18 hours (95% CI)). Time of test orders affected TAT, with orders made early in the morning and those in the afternoon experiencing the most delays in TAT.

Conclusion

Significant inefficiencies exist at multiple steps in the turnaround times for routine laboratory tests at a large referral hospital within an LMIC setting. Multiple opportunities exist to improve TAT and streamline processes around diagnostic testing in this and other similar settings.

Introduction

A functional and accessible clinical laboratory infrastructure plays a crucial role in determining the diagnosis and treatment of communicable and non-communicable diseases alike. [1] Literature has shown the importance of clinical laboratories in facilitating clinical decision-making processes in a range of clinical diseases. [24] Inadequate access to quality-assured laboratory results often leads to further wastage of limited resources and potential harm to patients. [5]

Access to well-equipped diagnostic testing is limited in low- and middle-income countries (LMICs), especially in Sub-Saharan Africa (SSA). [6, 7] Barriers to reliable laboratory testing include: inadequate health-care infrastructure to support laboratory capacity, poor quality of laboratory facilities, low availability of equipment and supplies, lack of implementation of standardized operating procedures, and lack of adequate personnel. Without diagnostic testing support, misdiagnosis (i.e. under- or over-diagnosis) based on clinical signs and symptoms occur frequently. [7] While improving access to diagnostic equipment and laboratory resources represents a crucial step to improving health outcomes in LMICs, other opportunities exist to ensure that quality diagnostic testing is done in a timely, cost-effective and efficient manner. [8, 9]

An opportunity to improve diagnostic testing relies on identification of laboratory workflow to identify bottlenecks in turnaround time (TAT). Workflow evaluation helps in rethinking of processes and can help clinical laboratories do more with less. [10] Improving workflow efficiency in the laboratory is a cost-effective approach to maximizing health benefits for patients despite limited resources being available. [10] Quality improvement efforts geared towards improving the workflow have shown improved efficiency in hospital care settings within LMICs. [1113] Human error, communication system breakdowns, redundant work steps and slow TAT all contribute to reduced workflow efficiency. [14] Redundant steps in the laboratory testing workflow are particularly common in LMIC settings, which commonly use paper-based laboratory service requests and results reporting. Such redundancies include filling entry and exit logs, and signing in and out samples and laboratory results. Lost paper requests and laboratory reports often mean another set of documentation. All these deficiencies further increase the TAT for results, with poor health consequences downstream. [1517]

Quality has been defined as the ability of a service or product to satisfy the needs of a customer. [18] Clinical laboratories have traditionally focused on imprecision and inaccuracy to define the quality of results. This is a restrictive definition that focuses only on the technical aspect. Comprehensive laboratory result quality to the clinician encompasses precision, accuracy, availability, cost, relevance and timeliness. [19] Timeliness is considered to be one of the most crucial measures as it has a significant impact on patient care and satisfaction. It is for this reason that we are seeing increased use of point of care (POC) testing instruments. [19] Timeliness for diagnostic testing is commonly measured using the TAT.

To various stakeholders, TAT is often variably defined. However, for care providers who order the tests, TAT has most relevance in its definition as the time from the ordering of the test to the time when the result is available to the clinician. Delays relating to pre and post analytic phases are estimated to be responsible for up to 96% of total TAT, and a simple intra-laboratory definition of TAT risks grossly underestimating clinically-relevant TAT. [20]

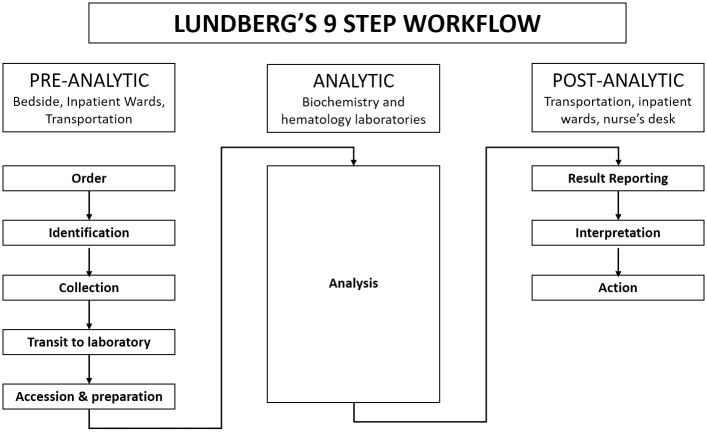
Lundberg first outlined the activities involved in the performance of a laboratory test as a series of nine steps, namely: ordering, collection, identification, transportation, preparation, analysis, reporting, interpretation and action. [21] He defined the TAT that involves all the nine steps as the brain to brain TAT or the “therapeutic TAT”. [21] The therapeutic TAT is the most comprehensive measure of timeliness of a clinical laboratory.

In LMICs like in other settings, many tests are ordered with need for timely access to results to help with critical care decisions. The aim of this study was to measure the therapeutic TAT for common hematological and biochemical analyses at a national referral hospital and to identify processes and factors that contribute most to delays in TAT.

Methods

Setting

This was a prospective, descriptive, single-center study of therapeutic TAT for common laboratory tests at a tertiary hospital in Kenya. The hospital has achieved ISO accreditation in Quality Management Systems (ISO 9001:2015 Standard) and Medical Laboratory Standard (ISO 15189:2012 Standard). The study took place at the adult medicine wards of the hospital. The hospital has 11 clinical laboratories, namely: hematology, biochemistry, microbiology, tuberculosis, immunology, histology/pathology, parasitology, blood bank, blood transfusion unit, private wing and children’s unit. The laboratories operate 24/7 and testing is run continuously although samples are received in batches. There are no point of care tests done at the hematology and biochemistry laboratories although some point of care tests occur at the wards e.g. random blood sugar tests. These point of care tests were excluded from this study. None of the laboratories had a laboratory information system (LIS) at the time of the study. The laboratories operate daily with a total of 6 pathologists (1 full-time and 5 part-time) and 146 laboratory technologists under employment.

Quantifying turnaround time

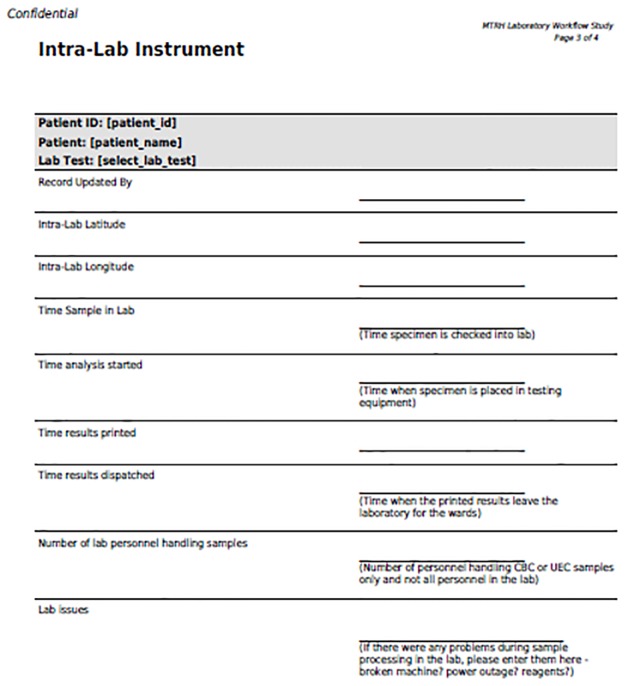
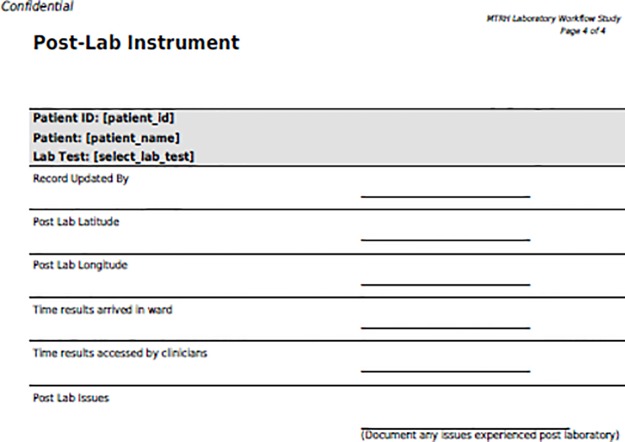
The Lundberg definition of TAT was used in this paper. [21] This means that the pre-analytical TAT used was from the point of order of tests to the receipt of samples at the laboratory. Similarly, the post-analytic phase started from the time results were available at the laboratory to the point where clinicians could access it for action. The Therapuetic TAT was quantified using a time motion analysis approach. During the study period, a trained research assistant (RAs) rounded daily with the Inpatient ward team, and followed the relevant laboratory tests ordered throughout all processing steps over a 24-hour period. Over a seven-week period, RAs tracked the two most commonly ordered tests, namely full hemogram (FHG) hematology tests and the Urea, Electrolyte and Creatinine (UEC) biochemistry tests—hematology and biochemistry tests are used subsequently to describe these tests in this paper. The first week of data collection was discarded to compensate for the Hawthorne effect, as clinician or laboratory staff behavior might change when they were initially being observed. [22] Standardized data collection forms were developed for data entry using REDCap tool (Figs 14), and these were loaded onto mobile devices for use by the RAs. During rounds, the RAs equipped with a mobile device with the REDCap data collection tool, recorded the time of test order, and then followed those tests throughout the laboratory workflow process, assigning a time stamp at each of the steps outlined below (Fig 5). The RAs also collected relevant laboratory time-stamps from the laboratory computers system, as time-stamps were generated when the laboratory test was both analyzed and when the results were printed.

Fig 1. Laboratory workflow process.

Fig 1

The figure shows the complete brain to brain workflow processes involved between the order of the common laboratory tests and the availability of the results to clinicians.

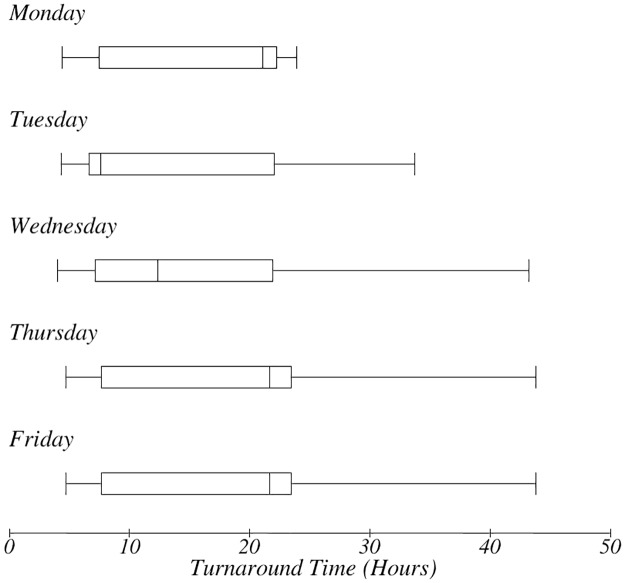
Fig 4. TAT for day of order.

Fig 4

The box-plot shows the day of the week when the test was ordered and impact on TAT.

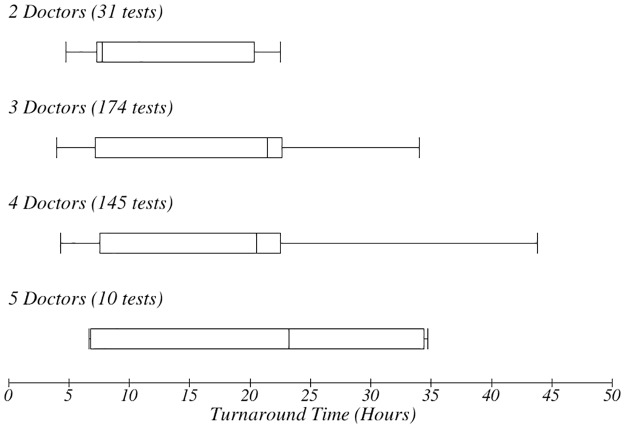
Fig 5. Number of doctors and impact on TAT.

Fig 5

The box-plot shows the number of doctors present when the test was ordered and impact on TAT.

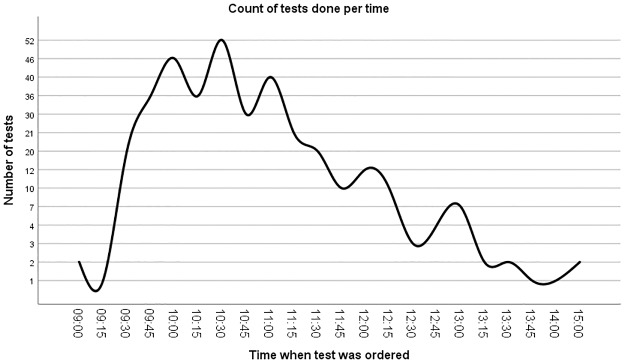
Fig 2. Tests per time.

Fig 2

The figure shows the number of tests done per time of the day.

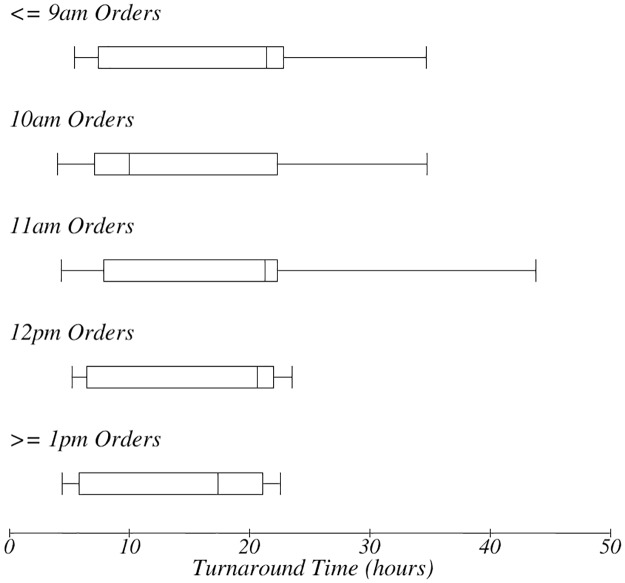
Fig 3. TAT for time of order.

Fig 3

The box-plot shows the time the test was ordered and impact on TAT.

In addition to laboratory workflow time-stamp data, we also collected other data to help in further evaluating the TAT times observed. These additional data collected included: number of clinicians, laboratory personnel, nurses and phlebotomists present at the time each laboratory test was being tracked. We also documented challenges noted by RAs during tracking of laboratory tests using a standardized coded list of items. Coded list of challenges included: (1) Misplaced laboratory order inaccessible to phlebotomist, (2) Patient declined sample to be taken, (3) Patient unavailable for sample collection, (4) Sample collected but misplaced before leaving the ward, (5) Sample left ward but was not received in the laboratory, (6) Sample was clotted, (7) Sample volume was insufficient for analysis, (8) Sample received in laboratory but misplaced, (9) Analysis was done but result was not printed, and (10) Result printed but then misplaced.

Patient-level data with patient-identifiers were also collected temporarily to track the TAT of labs during a 24-hour period. The RAs needed to collect the patient’s name, identification number, and location on the ward in order to locate the patient’s laboratory test. These patient-level data were stored securely on a password-protected device. At the end of each 24-hour period, the patient-level data and protected health information were permanently destroyed. The study was approved by the Institutional Review and Ethics Committee at Moi University.

Sample size determination

For tests with long TAT as was expected in the setting of this study, sample sizes between 100 and 500 are recommended in order to give reproducible means for TAT. Given that the inpatient units chosen for this study typically sent orders for around 15 to 20 samples each of hematology or biochemistry tests per day, we chose a consecutive sampling approach. [14]

Data analysis

The collected study data were extracted from the REDCap database and patient identifying information were removed as outlined above. Study personnel scanned these data for any inconsistencies in timestamps recorded, missing or invalid timestamps. The data were transferred to Microsoft Excel spreadsheets, with one spreadsheet each for hematology and biochemistry tests. The timestamps were then separated in columns in keeping with the Lundbergs nine-step workflow as shown in (Fig 5). [21] For each laboratory test record, time difference between one step and the subsequent step was calculated and recorded. For each time difference for every step, three calculations of TAT were done: Mean, Median and 90% completion time. These three measures are among four recommended by Steindel and Novis as being adequate and comprehensive measures of TAT. [23]

Given the long therapeutic TAT, the mean was used primarily as it is regarded to be a more objective measure in long TAT. This is based on a recommendation by Hawkins et al. [14] Boxplots were used to show the relationships of the TAT and the number of personnel present during the workflow process.

Results

Overall

A total of 460 laboratory tests (200 hematology and 260 biochemistry) belonging to 239 unique patients were tracked during a seven-week period between July and September 2018. To minimize the Hawthorne effect, the 42 laboratory tests that were tracked in the first week of the study were not included in the final analysis. Of the remaining 418 (180 hematology and 238 biochemistry) laboratory tests that were tracked, 62 (13.5%) were not fully processed and these included 26 (5.7%) hematology and 36, (7.8%) biochemistry), with the results never making it back to the clinical team that ordered the test. Reasons leading to non-completion of the tests are outlined in Table 1.

Table 1. List of tests misplaced in the workflow.

Reason for the test not getting to the clinician Hematology Biochemistry Total
# # # (% of Total)
Misplaced laboratory order inaccessible to phelobotomist 3 4 7 (1.5)
Patient declined sample to be taken 0 1 1 (0.2)
Patient unavailable for sample collection 4 3 7 (1.5)
Sample collected but misplaced before leaving the ward 2 5 7 (1.5)
Sample left ward but was not received in the laboratory 4 6 19 (4.1)
Sample was clotted 3 2 2 (0.4)
Sample volume was insufficient for analysis 0 1 1 (0.2)
Sample received in laboratory then misplaced 2 2 4 (0.9)
Analysis was done but result was not printed 5 5 10 (2.2)
Result printed but then misplaced 3 7 10 (2.2)
Total 26 36 62 (13.5)

Therapeutic TAT

The remaining 356 out of 418 tests (85.2%), made of 155 hematology and 201 electrolyte tests, went through the whole work-flow process. Table 2 summarizes the therapeutic TAT for hematology and electrolyte tests. The average therapeutic TAT for hematology was 20.3 ± 0.331 hours (95% CI) while that for biochemistry was 22.2 ± 0.346 hours (95% CI). The processing step that caused the biggest delay in TAT was ‘Printing, sorting and dispatch’ of results. The mean time taken by this step for hematology and biochemistry was 8.3 ± 1.29 hours (95% CI) and 8.5 ± 1.18 hours (95% CI) respectively. In both cases, the distribution was heavily skewed to the left resulting in the large standard deviation observed. Transportation of samples was the most efficient process with the mean transportation time for both hematology and biochemistry tests being around 10 minutes. Analysis took significantly longer with biochemistry when compared with hematology, which was the primary contributor to the significantly longer TAT overall for biochemistry compared with hematology tests (Table 2).

Table 2. Turnaround time for specific time intervals of the workflow process.

Hematology Biochemistry
Mean Median 90th Perc Mean Median 90th Perc p-value
Hrs (SD) Hrs Hrs Hrs (SD) Hrs Hrs (Mean)
Order to Sample collection 2.18 (2.2) 2.08 3.3 2.1 (1.2) 2.15 3.24 0.6616
Sample collection to transport 1.24 (0.7) 1.16 2.19 1.25 (0.7) 1.17 2.17 0.8938
Transport to received in laboratory 0.15 (0.2) 0.08 0.42 0.16 (0.3) 0.1 0.42 0.7205
Pre-analytic period 0.71 (0.5) 0.63 1.24 0.72 (1.6) 0.5 1.22 0.9402
Analysis 1.06 (2.1) 0.85 1.73 2.06 (2.5) 1.55 3.17 0.0001
Printing sorting and dispatch 8.25 (8.2) 2.33 17.36 8.47 (7.9) 2.55 16.25 0.7979
Transport to received in the ward 2.30 (5.4) 0.22 15.07 2.07(6.3) 0.17 9.87 0.7167
Received in ward to access by clinician 7.99 (8.0) 1.67 16.17 7.46 (8.8) 1 16.2 0.5583
Overall turnaround Time 20.3 (2.1) 9.02 22.2 (2.5) 9.19 0.0001

A majority of orders were done between 9:30am and 12:00pm with a peak at 10:30am (Fig 6). Orders done during peak times experienced the longest TAT (Fig 7). Orders done in the morning hours (up to 11am) experienced longer TAT when compared with orders done after 12pm (Fig 7).

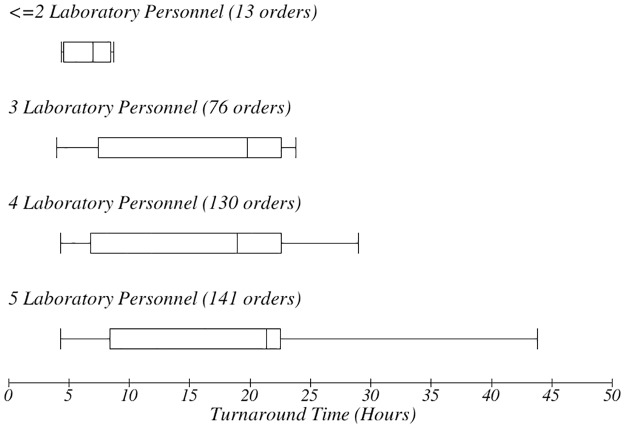
Fig 6. TAT for time of order.

Fig 6

The box-plot shows the number of laboratory personnel present when the test was processed and impact on TAT.

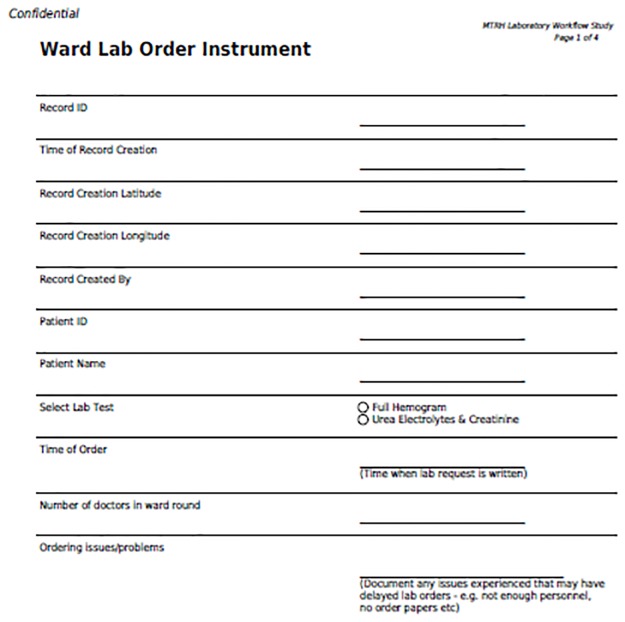
Fig 7. Ward to laboratory order instrument.

Fig 7

Instrument used to record initial laboratory order.

There was a variation in the TAT based on the day of the week in which orders were made (Fig 8). Orders for tests done later in the week had longer TAT. There was no apparent relationship between the number of personnel present during the workflow process and the therapeutic TAT (Fig 9). However, it emerged that the more personnel were present, the longer the TAT (Fig 10). The more the number of orders, the more the number of personnel that were deployed to process the orders as well.

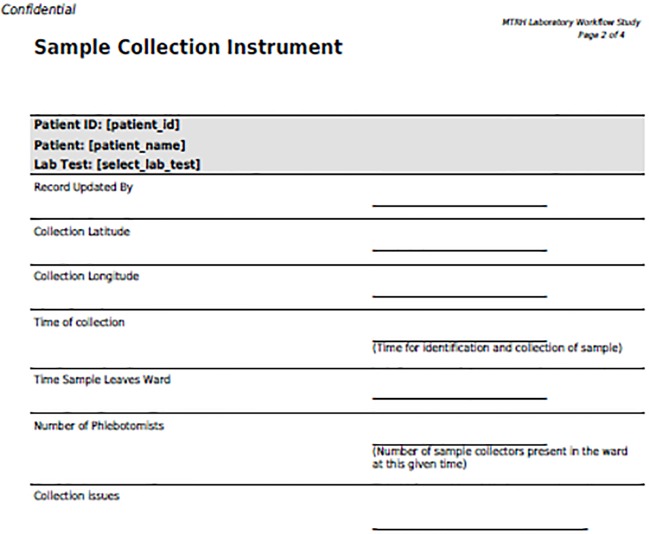
Fig 8. Sample collection instrument.

Fig 8

Instrument used to record data during sample collection.

Fig 9. Intra laboratory instrument.

Fig 9

Instrument used to record data during the analytical stage.

Fig 10. Post laboratory instrument.

Fig 10

Instrument used to record data during the post analytical phase.

Discussion

In essence, our study demonstrated that test results that had been analysed and were available for care could not be accessed by clinicians for another 18 hours. Our findings further add to the evidence that pre-analytical and post-analytical phases of laboratory processing contribute up to 96% of total TAT. [24]

Steindel and Novis identified four measures that can be used to adequately represent TAT. [23] These are the mean, median, 90th percentile and proportion of acceptable tests or outliers. In this study we used a combination of the mean, median and the 90th percentile in order to capture a comprehensive picture of TAT (Table 2).

Consolidated data available through external quality control programs like the CAP robes and Q-Track remain the reference point for laboratory TAT. A 2001 Q-Probes study concluded that the optimal time from order to reporting for biochemistry tests was 47 minutes while that for hematology was 35 minutes. [25] While comparisons with other studies is difficult because of varied definitions of TAT, it is still clear that the TAT in our study was significantly prolonged compared to recommended TAT for the tracked tests.

A time motion study done at the John Radcliffe Hospital (JRH), Oxford, UK in comparison determine that the TAT for hematology results was 1 hour 6 minutes (95% CI: 29 minutes to 2 hours 13 minutes) and that for biochemistry was 1 hour 42 minutes (95% CI: 1 hour 1 minute to 4 hours 21 minutes). [26] This was in a setting where result were immediately available to clinicians after analysis through electronic medical record systems. These and other observations demonstrate the importance of automating laboratory result delivery process, a step that was missing in our study setting as all steps were manual and paper-based.

In our study setting, printed results were batched for as long as 8.2 hours and 7.9 hours for CBC and UECs respectively. Printing and paper result delivery is not necessary in setups where computerized provider order entry (CPOE), laboratory information systems (LIS) and electronic medical record (EMR) systems have been implemented. Studies have shown that EMR and CPOE systems reduces both intra-laboratory and total TAT. [27] The impact of CPOE in our setting will probably be more significant given that up to 30% of analyzed results got misplaced—with half of the misplaced results being those that were analyzed but not printed, while the other half were printed and the paper result were untraceable.

Steindel and Novis suggest that 30 minutes as a reasonable time pre-analytic time, within which laboratory results should be received and verified. [23] In our study, for both hematology and biochemistry tests, the pre-analytic period lasted more than 30 minutes. This long pre-analytic time was partly a result of the manual recording processes needed to detail ordered tests in a paper register before being verified and received for processing.

Batching of the orders, of the collected samples and of results also contributed to the long overall TAT. Orders made early in the morning had a longer TAT as they were batched and had to wait for all orders before phlebotomy began (Fig 7). Orders done later in the day missed the batch and sometime could not get to the laboratory in time for analysis with the days’ earlier batch. Pneumatic transportation systems eliminate the need for batching and ensure consistently low TAT regardless of the time of order. [28] In the study setting, pneumatic transport systems, and use of point of care tests where relevant, could serve to reduce increased TAT related to batching. [2, 9, 29]

It was observed that orders done later in the week took significantly longer to process. This may be associated with increased numbers of samples that needed to be processed as the week progressed (Fig 8).

It surprisingly emerged that when more personnel were present during the processing of orders, the overall TAT was longer (Figs 9 and 10). However, this could simply be a reflection of the fact that more personnel are deployed in times of crisis or when the ward is busiest, when TAT was already longer. This is an interesting finding that may need further exploration.

Limitations of our study include the fact that it was done within one referral hospital setting that might not be reflecting of other clinical settings even within other LMICs. Further, our assessment only involved hematology and biochemistry tests which were also all handled within the facility. TAT will likely be different for other tests and for send out tests. However, through this study, we provide a clear demonstration of the need to analyze TAT systematically within clinical settings in LMICs, and to implement mechanisms to mitigate long TAT. Another limitation of the study is that it only considered printed laboratory results. In cases where critical results were communicated either verbally or via text message, the study may overestimate TAT. However the number of communicated critical results are low in this setting.

There is need to streamline the steps involved in delivery of common laboratory results in the tertiary hospital. As the next step, we hope to implement technology-based solutions to help in quick processing of orders using computerized order entry approaches, and interfaces that allow results to be availed immediately to providers. Such a solution will have to be tailored for resource-limited settings that might have limited technological infrastructure and financial resources. An approach that uses a mobile-based solution tethered to laboratory information system could help address many of these challenges, and also help with timely data collection to ensure real-time tracking of deficiencies in TAT.

Conclusion

This time motion study in a tertiary hospital in Kenya demonstrated that there are significant delays in delivery of hematology and biochemistry test results to clinicians in time. Despite efficient analysis of results, the post analytic period contributed the most delay resulting in more than 20 hours of therapeutic TAT. Printing, sorting and dispatch of results emerged as the greatest bottleneck in the process. Transportation was the most efficient process but this was in the context of batching of results before transport. There was a biphasic elongation of TAT with early morning and afternoon orders bearing the most delay. The results of this study elucidate specific bottlenecks and targets for interventions that could improve the efficiency of the laboratory workflow process ultimately improving clinical care.

Acknowledgments

We acknowledge the immense support received from the hospital management and more specifically by the Chief Executive Officer, the head of the department of laboratory services Ms. Florence Tum and the deputy of the same department Mr. Philemon Chebii. We thank the research assistants: Carolyne Songok, Millicent Tanui and Olympia Cheruiyot for their dedication and attention to detail as well as going beyond their call of duty to ensure work done was as perfect as humanly possible.

Data Availability

All relevant data are within the paper and its Supporting Information files.

Funding Statement

This work was supported by the Norwegian Programme for Capacity Development in Higher Education and Research for Development (NORHED) (Norad: Project QZA-0484) and the Moi Teaching and Referral Hospital. The funders had no role in study design, data collection and analysis, decision to publish, or preparation of the manuscript.

References

  • 1. Elbireer AM, Jackson JB, Sendagire H, Opio A, Bagenda D, Amukele TK. The good, the bad, and the unknown: quality of clinical laboratories in Kampala, Uganda. PLoS One. 2013;8(5):e64661 10.1371/journal.pone.0064661 [DOI] [PMC free article] [PubMed] [Google Scholar]
  • 2. Sokhna C, Mediannikov O, Fenollar F, Bassene H, Diatta G, Tall A, et al. Point-of-care laboratory of pathogen diagnosis in rural Senegal. PLoS Negl Trop Dis. 2013;7(1):e1999 10.1371/journal.pntd.0001999 [DOI] [PMC free article] [PubMed] [Google Scholar]
  • 3. Wilson D, Howell V, Toppozini C, Dong K, Clark M, Hurtado R. Against all odds: diagnosing tuberculosis in South Africa. J Infect Dis. 2011;204 Suppl:1102–9. 10.1093/infdis/jir453 [DOI] [PubMed] [Google Scholar]
  • 4. Wilson ML. Laboratory diagnosis of malaria: conventional and rapid diagnostic methods. Arch Pathol Lab Med. 2013;137(6):805–811. 10.5858/arpa.2011-0602-RA [DOI] [PubMed] [Google Scholar]
  • 5. Driessen J Limula H GOJ. Informatics solutions for bridging the gap between clinical and laboratory services in a low-resource setting. Afr J Lab Med. 2015;4(1):7. [DOI] [PMC free article] [PubMed] [Google Scholar]
  • 6. Abreha T, Alemayehu B, Tadesse Y, Gebresillassie S, Tadesse A, Demeke L, et al. Malaria diagnostic capacity in health facilities in Ethiopia. Malar J. 2014;13:292 10.1186/1475-2875-13-292 [DOI] [PMC free article] [PubMed] [Google Scholar]
  • 7. Petti CA, Polage CR, Quinn TC, Ronald AR, Sande MA. Laboratory medicine in Africa: a barrier to effective health care. Clin Infect Dis. 2006;42(3):377–382. 10.1086/499363 [DOI] [PubMed] [Google Scholar]
  • 8. Mabey D, Peeling RW, Ustianowski A, Perkins MD. Diagnostics for the developing world. Nat Rev Microbiol. 2004;2(3):231–240. 10.1038/nrmicro841 [DOI] [PubMed] [Google Scholar]
  • 9. McNerney R, Daley P. Towards a point-of-care test for active tuberculosis: obstacles and opportunities. Nat Rev Microbiol. 2011;9(3):204–213. 10.1038/nrmicro2521 [DOI] [PubMed] [Google Scholar]
  • 10. Litvak E, Bisognano M. More patients, less payment: increasing hospital efficiency in the aftermath of health reform. Health Aff (Millwood). 2011;30(1):76–80. 10.1377/hlthaff.2010.1114 [DOI] [PubMed] [Google Scholar]
  • 11. Wong R, Hathi S, Linnander EL, El Banna A, El Maraghi M, El Din RZ, et al. Building hospital management capacity to improve patient flow for cardiac catheterization at a cardiovascular hospital in Egypt. Jt Comm J Qual Patient Saf. 2012;38(4):147–153. 10.1016/s1553-7250(12)38019-7 [DOI] [PMC free article] [PubMed] [Google Scholar]
  • 12. Liu C, Babigumira J, Chiunda A, Katamba A, Litvak I, Miller L, et al. Finding the best examples of healthcare quality improvement in Sub-Saharan Africa. Qual Saf Health Care. 2010;19(5):416–419. 10.1136/qshc.2008.028548 [DOI] [PubMed] [Google Scholar]
  • 13. Bradley E, Hartwig KA, Rowe LA, Cherlin EJ, Pashman J, Wong R, et al. Hospital quality improvement in Ethiopia: a partnership-mentoring model. Int J Qual Health Care. 2008;20(6):392–399. 10.1093/intqhc/mzn042 [DOI] [PubMed] [Google Scholar]
  • 14. Hawkins RC. Laboratory turnaround time. Clin Biochem Rev. 2007;28(4):179–194. [PMC free article] [PubMed] [Google Scholar]
  • 15. Khan K. Root Cause Analysis (RCA) of Prolonged Laboratory Turnaround Time in a Tertiary Care Set up. Journal Of Clinical And Diagnostic Research. 2014. 10.7860/JCDR/2014/7269.4255 [DOI] [PMC free article] [PubMed] [Google Scholar]
  • 16. Goswami B, Singh B, Chawla R, Gupta VK, Mallika V. Turn Around Time (TAT) as a Benchmark of Laboratory Performance. Indian J Clin Biochem. 2010;25(4):376–379. 10.1007/s12291-010-0056-4 [DOI] [PMC free article] [PubMed] [Google Scholar]
  • 17. Chauhan KP, Trivedi AP, Patel D, Gami B, Haridas N. Monitoring and root cause analysis of clinical biochemistry turn around time at an academic hospital. Indian J Clin Biochem. 2014;29(4):505–509. 10.1007/s12291-013-0397-x [DOI] [PMC free article] [PubMed] [Google Scholar]
  • 18. Bergman B K B. Quality: from customer needs to customer satisfaction. McGraw-Hill; 1994. [Google Scholar]
  • 19. Watts NB. Reproducibility (precision) in alternate site testing. A clinician’s perspective. Arch Pathol Lab Med. 1995;119(10):914–917. [PubMed] [Google Scholar]
  • 20. Steindel SJ, Howanitz PJ. Changes in emergency department turnaround time performance from 1990 to 1993. A comparison of two College of American Pathologists Q-probes studies. Arch Pathol Lab Med. 1997;121(10):1031–1041. [PubMed] [Google Scholar]
  • 21. Lundberg GD. Acting on significant laboratory results. JAMA. 1981;245(17):1762–1763. 10.1001/jama.1981.03310420052033 [DOI] [PubMed] [Google Scholar]
  • 22. Sedgwick P, Greenwood N. Understanding the Hawthorne effect. BMJ (Clinical research ed). 2015;351:h4672. [DOI] [PubMed] [Google Scholar]
  • 23. Steindel SJ, Novis DA. Using outlier events to monitor test turnaround time. Archives of pathology & laboratory medicine. 1999;123(7):607–614. [DOI] [PubMed] [Google Scholar]
  • 24. Manor PG. Turnaround times in the laboratory: a review of the literature. Clin Lab Sci. 1999;12(2):85–89. [PubMed] [Google Scholar]
  • 25. JH H, PJ H. Laboratory results. Timeliness as a quality attribute and strategy. Am J Clin Pathol. 2001;116:311–5. 10.1309/H0DY-6VTW-NB36-U3L6 [DOI] [PubMed] [Google Scholar]
  • 26. Gill D, Galvin S, Ponsford M, Bruce D, Reicher J, Preston L, et al. Laboratory sample turnaround times: do they cause delays in the ED? Journal of Evaluation in Clinical Practice. 2012;18(1):121–127. 10.1111/j.1365-2753.2010.01545.x [DOI] [PubMed] [Google Scholar]
  • 27. Georgiou A, Williamson M, Westbrook JI, Ray S. The impact of computerised physician order entry systems on pathology services: a systematic review. International journal of medical informatics. 2007;76(7):514–529. 10.1016/j.ijmedinf.2006.02.004 [DOI] [PubMed] [Google Scholar]
  • 28. Toth J, Lenkey A, Olah VA, Koteles J, Kissne Sziraki V, Kerenyi A, et al. [Pneumatic tube system for transport of laboratory samples: preanalytical aspects]. Orvosi hetilap. 2014;155(28):1113–1120. 10.1556/OH.2014.29895 [DOI] [PubMed] [Google Scholar]
  • 29. Lee-Lewandrowski E, Corboy D, Lewandrowski K, Sinclair J, McDermot S, Benzer TI. Implementation of a point-of-care satellite laboratory in the emergency department of an academic medical center. Impact on test turnaround time and patient emergency department length of stay. Archives of pathology & laboratory medicine. 2003;127(4):456–460. [DOI] [PubMed] [Google Scholar]

Decision Letter 0

Helena Kuivaniemi

Transfer Alert

This paper was transferred from another journal. As a result, its full editorial history (including decision letters, peer reviews and author responses) may not be present.

19 Nov 2019

PONE-D-19-21599

Therapeutic turnaround times for common laboratory tests in a tertiary hospital in Kenya

PLOS ONE

Dear Dr Mwogi,

Thank you for submitting your manuscript to PLOS ONE. After careful consideration based on three expert reviewers we think that it has merit but does not fully meet PLOS ONE’s publication criteria as it currently stands. Therefore, we invite you to submit a revised version of the manuscript that addresses all the points raised during the review process.

Please make sure that you provide a detailed response to each comment. Your response should include the revised text as well as the location of the revision (page number and line numbers) in the text where that specific change can be found. This will facilitate the re-review of your manuscript.

We would appreciate receiving your revised manuscript by Jan 03 2020 11:59PM. When you are ready to submit your revision, log on to https://www.editorialmanager.com/pone/ and select the 'Submissions Needing Revision' folder to locate your manuscript file.

If you would like to make changes to your financial disclosure, please include your updated statement in your cover letter.

To enhance the reproducibility of your results, we recommend that if applicable you deposit your laboratory protocols in protocols.io, where a protocol can be assigned its own identifier (DOI) such that it can be cited independently in the future. For instructions see: http://journals.plos.org/plosone/s/submission-guidelines#loc-laboratory-protocols

Please include the following items when submitting your revised manuscript:

  • A rebuttal letter that responds to each point raised by the academic editor and reviewer(s). This letter should be uploaded as separate file and labeled 'Response to Reviewers'.

  • A marked-up copy of your manuscript that highlights changes made to the original version. This file should be uploaded as separate file and labeled 'Revised Manuscript with Track Changes'.

  • An unmarked version of your revised paper without tracked changes. This file should be uploaded as separate file and labeled 'Manuscript'.

Please note while forming your response, if your article is accepted, you may have the opportunity to make the peer review history publicly available. The record will include editor decision letters (with reviews) and your responses to reviewer comments. If eligible, we will contact you to opt in or out.

We look forward to receiving your revised manuscript.

Kind regards,

Helena Kuivaniemi, MD, PhD

Academic Editor

PLOS ONE

Journal Requirements:

1. When submitting your revision, we need you to address these additional requirements.

Please ensure that your manuscript meets PLOS ONE's style requirements, including those for file naming. The PLOS ONE style templates can be found at

http://www.journals.plos.org/plosone/s/file?id=wjVg/PLOSOne_formatting_sample_main_body.pdf and http://www.journals.plos.org/plosone/s/file?id=ba62/PLOSOne_formatting_sample_title_authors_affiliations.pdf

2. Please ensure that you refer to Figures 4-7 in your text as, if accepted, production will need this reference to link the reader to the figure.

3.  We note that you have indicated that data from this study are available upon request. PLOS only allows data to be available upon request if there are legal or ethical restrictions on sharing data publicly. For information on unacceptable data access restrictions, please see http://journals.plos.org/plosone/s/data-availability#loc-unacceptable-data-access-restrictions.

In your revised cover letter, please address the following prompts:

a) If there are ethical or legal restrictions on sharing a de-identified data set, please explain them in detail (e.g., data contain potentially identifying or sensitive patient information) and who has imposed them (e.g., an ethics committee). Please also provide contact information for a data access committee, ethics committee, or other institutional body to which data requests may be sent.

b) If there are no restrictions, please upload the minimal anonymized data set necessary to replicate your study findings as either Supporting Information files or to a stable, public repository and provide us with the relevant URLs, DOIs, or accession numbers. Please see http://www.bmj.com/content/340/bmj.c181.long for guidelines on how to de-identify and prepare clinical data for publication. For a list of acceptable repositories, please see http://journals.plos.org/plosone/s/data-availability#loc-recommended-repositories.

We will update your Data Availability statement on your behalf to reflect the information you provide.

[Note: HTML markup is below. Please do not edit.]

Reviewers' comments:

Reviewer's Responses to Questions

Comments to the Author

1. Is the manuscript technically sound, and do the data support the conclusions?

The manuscript must describe a technically sound piece of scientific research with data that supports the conclusions. Experiments must have been conducted rigorously, with appropriate controls, replication, and sample sizes. The conclusions must be drawn appropriately based on the data presented.

Reviewer #1: Partly

Reviewer #2: Yes

Reviewer #3: Partly

**********

2. Has the statistical analysis been performed appropriately and rigorously?

Reviewer #1: Yes

Reviewer #2: No

Reviewer #3: No

**********

3. Have the authors made all data underlying the findings in their manuscript fully available?

The PLOS Data policy requires authors to make all data underlying the findings described in their manuscript fully available without restriction, with rare exception (please refer to the Data Availability Statement in the manuscript PDF file). The data should be provided as part of the manuscript or its supporting information, or deposited to a public repository. For example, in addition to summary statistics, the data points behind means, medians and variance measures should be available. If there are restrictions on publicly sharing data—e.g. participant privacy or use of data from a third party—those must be specified.

Reviewer #1: Yes

Reviewer #2: Yes

Reviewer #3: Yes

**********

4. Is the manuscript presented in an intelligible fashion and written in standard English?

PLOS ONE does not copyedit accepted manuscripts, so the language in submitted articles must be clear, correct, and unambiguous. Any typographical or grammatical errors should be corrected at revision, so please note any specific errors here.

Reviewer #1: Yes

Reviewer #2: Yes

Reviewer #3: Yes

**********

5. Review Comments to the Author

Please use the space provided to explain your answers to the questions above. You may also include additional comments for the author, including concerns about dual publication, research ethics, or publication ethics. (Please upload your review as an attachment if it exceeds 20,000 characters)

Reviewer #1: The manuscript by Mwogi is a useful evaluation of the time involved in the generation of a routine lab report from time of test order through to result availability to clinicians. The comments below are minor, but deserve to be addressed by the authors

- This does not appear to have an author from the laboratory which seems inappropriate. If laboratory management was not involved in this study, that is an indictment of the difficulty that clinical laboratories often face. They are held to certain standards, but not always included in decision-making processes. The manuscript often has a negative tone that seems to impugn the efforts of the laboratory when in fact this type of evaluation is a necessary and useful part of laboratory quality improvement. One would hope that this was a collaborative and affirming research endeavor and the authors should mention this aspect in a revised manuscript

- The authors state on line 43 of page 3 that “timeliness… is the most crucial” aspect of laboratory performance. This is patently untrue as result accuracy is far more important to patient safety and management. Timeliness is AN important factor, but receiving inaccurate results quickly is useless. The authors should revise this statement.

- The meaning of lines 49-51 is unclear – please reword this section

- There is no description of the organization of the laboratory. Is this a 24/7 operation or is it day-shift only? Are assays run in batches or continuously? Is there a STAT process that has different turnaround characteristics? Does the laboratory have a lab information system (LIS)?

- The authors sometimes use “biochemistry” and other times use “electrolytes”. Please be consistent throughout the manuscript.

- The lab tests chosen are not often needed on a STAT basis. Thus the authors need to discuss the patient implications of receiving a result the same day versus the next day. If these test results are not needed urgently (and in fact is there anyone to receive results if they were issued earlier but in non-peak hours such as 1 am?).

- Were research assistants really working 24 hours continuously to follow samples and testing and results? This seems unlikely.

- It appears that the median is a better measure of central tendency here as there may be some substantial outliers. A histogram of TAT would be useful.

- Lines 169-171 seem contradictory. Please clarify

- Remove the redundant repetition of results from the discussion section. Instead focus on causes and potential solutions which would be helpful for readers to understand.

- The authors seem to be assigning blame to the lab when in fact, this is an excellent opportunity to champion the lab’s needs. Laboratories are often so tightly funded with administrators paying only for reagents and tech time while not taking many of the activities described here into account. Health care organizations need a call to arms to better support excellence in laboratory diagnostics. For example, at some institutions where an LIS is available and can link to an EMR, clinicians refuse to look up results preferring to wait for paper copies. The authors have clearly described dependence on paper reports as a bottleneck, but the solutions cannot come from the lab alone., The authors should engage is the effort of quality improvement by taking a stand on what is needed in order to improve lab services.

Reviewer #2: 1. Please provide a reference for the "Hawthorne effect".

2. Figure 1

Please consider modifying this diagram to include arrows indicating the flow and the role players at each step, i.e. doctors, nurses, porters, laboratory admin personnel, laboratory technicians etc. This will help a general reader to understand the flow practically. Also please indicate where each step takes place - the bedside, the nurses' or admin office in the ward, the receipt area in the laboratory, the analytical areas - again for a general reader who do not work in a hospital to understand the practical flow better.

3. Figure 3

Using 1 boxplot per time slot in this graph will convey more useful information to the reader, like the spread of TAT and where the central 50% lies. Since you state that you are reporting mean and SD according to a recommendation by Hawkins, you may consider displaying the mean and SD in these boxplots, instead of the more common median and IQR.

4. Table 3

Please clarify what comparison the p-value represents - is it Monday vs all the other days, or is it a Kruskal-Wallis test that includes all the days, in which case a significant p-value does not necessarily mean that "early" and "late" differ, but only that day of the week influences the rankings of TAT, giving no clue which day specifically has the greatest influence.

It is also not ideal to show mean and SD next to a p-value for a test that does not compare the means of groups. Reporting the medians and inter-quartile ranges would be more appropriate in combination with such a p-value. As above, I understand that you are following a specific recommendation for the TAT field in reporting the means - if you wish this table to remain consistent with that, then removing the p-values from both table 3 and 4 and creating an additional table for all comparisons with their p-values may be another way to present the p-values without them seeming to represent a difference in means.

I would suggest creating an "early" group Monday-Tuesday and a "late" group Wednesday-Thursday-Friday and just testing those with Kruskal-Wallis so that the p-value corresponds to the question you are interested in. Or trying log-transforming the data and then doing an ANOVA and post-hoc tests, to justify which days are different from the global mean.

It is also an option to do no statistical test, but show the TAT in a separate boxplot per day, so that the readers can see for themselves what the spread per day looks like and how days differ from each other. I do not think the absence of a p-value for the influence of day of the week diminishes your point that it is an important factor to consider when applying an analysis of where and why bottle necks occur.

5. Table 4

As before, it is not ideal to report mean and SD along with a p-value of a test that does not test a difference in means.

5. General comments

Overall, this paper is well written and clear.

Line numbers seem to have accidentally made their way into the text at places - please see lines 165 to 167 where the numbers "158" and "159" appear, as an example. Please check the rest of the text also for these artefacts.

Reviewer #3: Detailed comments on Manuscript number: PONE-D-19-21599

ABSTRACT:

1. Abstract format – does not follow the strict flow of the PLOS1 guidance. Authors must refer to the guidelines and apply them accordingly.

2. Use of SD in abstract – more useful statistical measures such as mean, range, CI and other more informative stats recommended

3. Bold statement made regarding significance but no objective test of outcome significance is mentioned

INTRODUCTION:

1. Generally verbose without communicating any additional or useful facts.

2. The quoting of reference 23 to support the preceding statement is inaccurate as the reference does not say what is stated. Either a better reference is found or the statement modified or removed.

3. The preferred “user” definition of TAT is acceptable with regards to “availability” of results, however, availability must include verbal, telephonic, electronic and social-media modalities of result communication. This omission implies that clinically critical results are not communicated by the foregoing methods. Is this the claim that the authors are making?

****This point must be attended to and clarified unequivocally as it affects the Discussion and other sections of this well-designed study***

4. The inclusion of reference 25 in the middle of a sentence must be rectified.

5. The last statement in the introduction regarding the fact that TAT studies are few in LMIC needs referencing as the reviewer’s impression is that there are such studies in the literature.

METHODS:

1. Under Setting, the number of technologists is stated but not other key staff such as Pathologists. It is important to make the distinction between a technologist vs pathologist-led laboratory.

2. The authors must be commended for an excellent, if labour intensive study design.

3. Note typing error UEC is Urea (not Urine) Electrolyte and Creatinine

4. Use of colloquial terms and abbreviations such as lab for laboratory, must be rectified.

RESULTS:

1. The use of SDs and medians and their contribution to the analysis is questionable. As this affects the overall impact of the paper, the authors are strongly urged to consult their statisticians and only include the most impactful measures. Reviewer recommends, mean, range, CI, 90th percentile, and medians. Consistency is lacking in the statistical measure (s) utilised.

2. Table 2 has a wealth of information, however, there are several errors in the figures stated in the discussion as they do not match those stated on Table 2.

3. Testing for the statistical significance or lack thereof, of the various differences observed is generally lacking. It is only done in the context of Biochemistry versus Haematology.

DISCUSSION:

1. Several mistakes and discrepancies noted between the results shown on Table 2 and those stated in the text. This should be easy to fix.

2. Authors should consider further defining “pre-analytical time”; “time from ordering to receipt in the laboratory”, “time from receipt in the laboratory to time of analysis” are examples of different ways of defining “pre-analytical”. In practical terms these times require different interventions to rectify. For instance time spent within the laboratory before specimen analysis is entirely within the control of the laboratory whereas time before reaching the laboratory is not. In general, “pre-analytical” phase refers to the whole time interval before the specimen is analysed and not as the authors narrowly define it, as “from arrival in the laboratory to start of analysis”

***This is another key area for revision and clarification.

3. The key factual findings that results were “out” in the laboratory but not accessible to the clinicians can only be true if it is confirmed that the telephone and electronic means of communicating results were not used. The authors must expressly state if this is the case.

4. The figure regarding the contribution of the “non-analytical” phase (96%) needs recalculation.

5. Time comparisons of TATs must only be made with similarly defined TATs in order to be meaningful.

6. Speculative aspects of the discussion must be minimised, for instance staff being tired as the week progresses.

7. The findings that TATs were higher with more staff available must be analysed in the context of a meaningful denominator such as number of samples per staff member. This cannot be a simple case of “too many cooks spoil the broth”

END

**********

6. PLOS authors have the option to publish the peer review history of their article (what does this mean?). If published, this will include your full peer review and any attached files.

If you choose “no”, your identity will remain anonymous but your review may still be made public.

Do you want your identity to be public for this peer review? For information about this choice, including consent withdrawal, please see our Privacy Policy.

Reviewer #1: No

Reviewer #2: Yes: Elizna Maasdorp

Reviewer #3: No

[NOTE: If reviewer comments were submitted as an attachment file, they will be attached to this email and accessible via the submission site. Please log into your account, locate the manuscript record, and check for the action link "View Attachments". If this link does not appear, there are no attachment files to be viewed.]

While revising your submission, please upload your figure files to the Preflight Analysis and Conversion Engine (PACE) digital diagnostic tool, https://pacev2.apexcovantage.com/. PACE helps ensure that figures meet PLOS requirements. To use PACE, you must first register as a user. Registration is free. Then, login and navigate to the UPLOAD tab, where you will find detailed instructions on how to use the tool. If you encounter any issues or have any questions when using PACE, please email us at figures@plos.org. Please note that Supporting Information files do not need this step.

PLoS One. 2020 Apr 8;15(4):e0230858. doi: 10.1371/journal.pone.0230858.r002

Author response to Decision Letter 0


13 Feb 2020

RESPONSE TO REVIEWERS

Reviewer #1: The manuscript by Mwogi is a useful evaluation of the time involved in the generation of a routine lab report from time of test order through to result availability to clinicians. The comments below are minor, but deserve to be addressed by the authors

- This does not appear to have an author from the laboratory which seems inappropriate.

The 4th author (RT) is actually the head of laboratory services division in the same institution. We have edited the manuscript to also acknowledge the critical work contributed by other laboratory managers in the institution towards this work. - PAGE 1

If laboratory management was not involved in this study, that is an indictment of the difficulty that clinical laboratories often face. They are held to certain standards, but not always included in decision-making processes. The manuscript often has a negative tone that seems to impugn the efforts of the laboratory when in fact this type of evaluation is a necessary and useful part of laboratory quality improvement. One would hope that this was a collaborative and affirming research endeavor and the authors should mention this aspect in a revised manuscript

This work was partly supported by the same hospital and indeed the laboratory as part of its quality improvement efforts. The parts of the manuscript that may have inadvertently potrayed the laboratory and laboratory staff in bad light were unintentional and have been rectified. We received immense support from every aspect of the hospital in doing this work. Indeed every personnel involved in the chain from ordering of tests to availability of results was intimately involved in the planning and execution of the research. There was a general sense of the capability of the paper to point out weak points for improvement without necessarily apportioning blame. – Lines 262 -267

- The authors state on line 43 of page 3 that “timeliness… is the most crucial” aspect of laboratory performance. This is patently untrue as result accuracy is far more important to patient safety and management. Timeliness is AN important factor, but receiving inaccurate results quickly is useless. The authors should revise this statement.

This was quoted from literature. We agree with the reviewer that indeed timeliness without accuracy is possibly even more harmful to patients. The paragraph has been edited to give equal importance to timeliness and accuracy – Lines 37 -39

- There is no description of the organization of the laboratory. Is this a 24/7 operation or is it day-shift only? Are assays run in batches or continuously?

The setting subheading under methods has been updated and more detail has been added on the organization of the laboratory and a clarification on the specific aspect of the process that was evaluated. For example, STAT processes that co-exist were not evaluated (e.g. Random blood sugar tests). The hospital does not use and laboratory information system. All processes are paper based except billing – Lines 68 -73

- The authors sometimes use “biochemistry” and other times use “electrolytes”. Please be consistent throughout the manuscript.

We have standardized the use of terms in the manuscript for consistency.

- The lab tests chosen are not often needed on a STAT basis. Thus the authors need to discuss the patient implications of receiving a result the same day versus the next day. If these test results are not needed urgently (and in fact is there anyone to receive results if they were issued earlier but in non-peak hours such as 1 am?).

We have updated the discussion and addressed the question of ‘how urgent do these results need to be delivered?’. We indeed agree with the reviewer on this valid question. However, while it may not be necessary to deliver laboratory results STAT, unnecessary delay is of patient safety concern. Additionally, A 2001 Q-Probes study concluded that the optimal time from order to reporting for biochemistry tests was 47 minutes while that for hematology was 35 minutes. Any delay to get the results back to the clinicians longer than these is considered suboptimal – Lines 181 -183

.

- Were research assistants really working 24 hours continuously to follow samples and testing and results? This seems unlikely.

RAs followed the ordering and collection of samples during normal working hours and collected lab related information from equipment time stamps. The RAs also 90 collected relevant lab time-stamps from the laboratory computers system, as time-stamps were generated when the laboratory test was both analyzed and when the results were printed.The research assistants were not working 24 hours. This was not necessary given the setting of the inpatient ward in the hospital. All laboratory tests were ordered during ward rounds in the morning. The phlebotomists would then do sample collection late mornings and deliver all samples to the laboratories by afternoons. Processing and printing of results as well as dispatch was done in a batched manner. There was largely no inpatient laboratory processing activities in the evenings and during the nights. – Lines 80 -82

- It appears that the median is a better measure of central tendency here as there may be some In total agreement with the reviewer. We have changed the tables to boxplots to better reflect the spread of the TAT with more emphasis on the median. – Fig 3 - 5

-Lines 169-171 seem contradictory. Please clarify

We have updated the manuscript to eliminate the contradictory and confusing manner of the two statements. Using the Kruskal Wallis to test for significant difference between the means, we could not find an association between the number of personnel present and the TAT. However, it was noted that in some instances (Number of laboratory personnel for example), the more personnel present, the longer the TAT tended to be. – Lines 168 - 170

- Remove the redundant repetition of results from the discussion section. Instead focus on causes and potential solutions which would be helpful for readers to understand.

This was well noted. The discussion has been reformatted to remove any unnecessary inclusion of items already included in the results. – Lines 172 onwards

- The authors seem to be assigning blame to the lab when in fact, this is an excellent opportunity to champion the lab’s needs. Laboratories are often so tightly funded with administrators paying only for reagents and tech time while not taking many of the activities described here into account. Health care organizations need a call to arms to better support excellence in laboratory diagnostics. For example, at some institutions where an LIS is available and can link to an EMR, clinicians refuse to look up results preferring to wait for paper copies. The authors have clearly described dependence on paper reports as a bottleneck, but the solutions cannot come from the lab alone., The authors should engage is the effort of quality improvement by taking a stand on what is needed in order to improve lab services.

We noted this crucial observation. The paper may have unintentionally set the wrong tone. However, we indeed found that the laboratories process the tests in the shortest time possible (almost close to the acceptable standards). However, there are systemic issues beyond just the laboratory e.g. number of personnel available may not be adequate to deliver individual laboratory results. Instead they are batched and delivered. Clinicians mark all laboratory test orders as ‘urgent’ and contribute to delaying all results as none emerges as urgent to care for example. Generally, what emerged is that there needs to be collaborative efforts as well as systemic changes to improve on the TAT. The biggest changes to improve the TAT is on the pre-analytical and post-analytical stage and not necessarily the laboratory itself.

Reviewer #2: 1. Please provide a reference for the "Hawthorne effect".

A reference has been added – Reference 22 Line 86

2. Figure 1

Please consider modifying this diagram to include arrows indicating the flow and the role players at each step, i.e. doctors, nurses, porters, laboratory admin personnel, laboratory technicians etc. This will help a general reader to understand the flow practically. Also please indicate where each step takes place - the bedside, the nurses' or admin office in the ward, the receipt area in the laboratory, the analytical areas - again for a general reader who do not work in a hospital to understand the practical flow better.

The diagram has been modified appropriately as suggested. Arrows have been added to indicate the flow linking pre-analytical to analytical to post-analytical. The places where these activities take place have also been indicated in the diagram. – Figure 1

3. Figure 3

Using 1 boxplot per time slot in this graph will convey more useful information to the reader, like the spread of TAT and where the central 50% lies. Since you state that you are reporting mean and SD according to a recommendation by Hawkins, you may consider displaying the mean and SD in these boxplots, instead of the more common median and IQR.

Figure 3 has been updated appropriately according to the reviewers recommendation. For each timeslot, boxplot has been used instead. – Figure 3 to 5

4. Table 3

Please clarify what comparison the p-value represents - is it Monday vs all the other days, or is it a Kruskal-Wallis test that includes all the days, in which case a significant p-value does not necessarily mean that "early" and "late" differ, but only that day of the week influences the rankings of TAT, giving no clue which day specifically has the greatest influence.

It is also not ideal to show mean and SD next to a p-value for a test that does not compare the means of groups. Reporting the medians and inter-quartile ranges would be more appropriate in combination with such a p-value. As above, I understand that you are following a specific recommendation for the TAT field in reporting the means - if you wish this table to remain consistent with that, then removing the p-values from both table 3 and 4 and creating an additional table for all comparisons with their p-values may be another way to present the p-values without them seeming to represent a difference in means.

I would suggest creating an "early" group Monday-Tuesday and a "late" group Wednesday-Thursday-Friday and just testing those with Kruskal-Wallis so that the p-value corresponds to the question you are interested in. Or trying log-transforming the data and then doing an ANOVA and post-hoc tests, to justify which days are different from the global mean.

It is also an option to do no statistical test, but show the TAT in a separate boxplot per day, so that the readers can see for themselves what the spread per day looks like and how days differ from each other. I do not think the absence of a p-value for the influence of day of the week diminishes your point that it is an important factor to consider when applying an analysis of where and why bottle necks occur.

5. Table 4

As before, it is not ideal to report mean and SD along with a p-value of a test that does not test a difference in means.

After further discussion with the biostatistician, we agreed with the reviewers last point and we have removed table 3 and table 4 and replaced it with a boxplot that better depicts the spread of the TAT per day and the spread of the TAT for the number of personnel. – Fig 3 - 5

5. General comments

Overall, this paper is well written and clear.

Line numbers seem to have accidentally made their way into the text at places - please see lines 165 to 167 where the numbers "158" and "159" appear, as an example. Please check the rest of the text also for these artefacts.

A further review of the whole manuscript was further done to remove the mixup where line numbers got mixed up in the text during formatting.

Reviewer #3: Detailed comments on Manuscript number: PONE-D-19-21599

ABSTRACT:

1. Abstract format – does not follow the strict flow of the PLOS1 guidance. Authors must refer to the guidelines and apply them accordingly.

Latex template was used and during the conversion from latex to PDF and then to word, the formatting was lost. We have attached a PDF as reference to the structure of the document. We have also rectified the formatting to reflect Plos one guidelines.

2. Use of SD in abstract – more useful statistical measures such as mean, range, CI and other more informative stats recommended

We have changed the statistical measures to use of 95% confidence intervals. This has been standardized throughout the document. – Abstract and Lines 148 - 153

3. Bold statement made regarding significance but no objective test of outcome significance is mentioned

We have removed speculative statements in the document and in the abstract that are not backed by data.

INTRODUCTION:

1. Generally verbose without communicating any additional or useful facts.

We felt that the introduction was crucial in painting the necessary background to justify why a time motion study would be appropriate in understanding workflow processes that influence TAT. We have edited the introduction for clarity and some paragraphs have been removed altogether.

2. The quoting of reference 23 to support the preceding statement is inaccurate as the reference does not say what is stated. Either a better reference is found or the statement modified or removed.

The reference has been updated to the correct one. Ref 19

3. The preferred “user” definition of TAT is acceptable with regards to “availability” of results, however, availability must include verbal, telephonic, electronic and social-media modalities of result communication. This omission implies that clinically critical results are not communicated by the foregoing methods. Is this the claim that the authors are making?

****This point must be attended to and clarified unequivocally as it affects the Discussion and other sections of this well-designed study***

We have edited the methods to explicitly state that we only tracked printed/paper based results. We have added as a limitation of this study that if there were critical results that were communicated via other means, the results may overestimate the TAT. However, from the experience of the authors, very few critical results are communicated. A follow up paper that followed only critical results established this. Lines 66 -73

4. The inclusion of reference 25 in the middle of a sentence must be rectified.

This has been rectified.

5. The last statement in the introduction regarding the fact that TAT studies are few in LMIC needs referencing as the reviewer’s impression is that there are such studies in the literature.

This statement has been removed as it may be deemed speculative.

METHODS:

1. Under Setting, the number of technologists is stated but not other key staff such as Pathologists. It is important to make the distinction between a technologist vs pathologist-led laboratory.

The section has been edited to include other relevant personnel. The management team is led by a technologist with 6 pathologists serving as consultants in the histology laboratory (1 full time and 5 part time) – Lines 71 - 73

2. The authors must be commended for an excellent, if labour intensive study design.

3. Note typing error UEC is Urea (not Urine) Electrolyte and Creatinine

This has been rectified.

4. Use of colloquial terms and abbreviations such as lab for laboratory, must be rectified.

This has been rectified.

RESULTS:

1. The use of SDs and medians and their contribution to the analysis is questionable. As this affects the overall impact of the paper, the authors are strongly urged to consult their statisticians and only include the most impactful measures. Reviewer recommends, mean, range, CI, 90th percentile, and medians. Consistency is lacking in the statistical measure (s) utilised.

The results section has been reworked and for consistency, we have reported the means at 95% confidence intervals. The table 2 also include the 90th Percentile and the median. – Abstract, Results and Discussion section

2. Table 2 has a wealth of information, however, there are several errors in the figures stated in the discussion as they do not match those stated on Table 2.

We have rectified the inconsistencies and matched the figures stated in Table 2 with those in the results section. - Table 2, Results and Discussion

3. Testing for the statistical significance or lack thereof, of the various differences observed is generally lacking. It is only done in the context of Biochemistry versus Haematology.

The calculation of the sample size may not have been powered high enough to detect various differences. We have adopted another reviewer suggestion that we include boxplots that will help readers quickly discern relationships between the various parameters. We have removed Table 3 and 4 and replaced them with boxplots. – Figures 3 - 5

DISCUSSION:

1. Several mistakes and discrepancies noted between the results shown on Table 2 and those stated in the text. This should be easy to fix.

This has been fixed and together with recommendation from another reviewer, we have removed repetitions of results in the discussion section.

2. Authors should consider further defining “pre-analytical time”; “time from ordering to receipt in the laboratory”, “time from receipt in the laboratory to time of analysis” are examples of different ways of defining “pre-analytical”. In practical terms these times require different interventions to rectify. For instance time spent within the laboratory before specimen analysis is entirely within the control of the laboratory whereas time before reaching the laboratory is not. In general, “pre-analytical” phase refers to the whole time interval before the specimen is analysed and not as the authors narrowly define it, as “from arrival in the laboratory to start of analysis”

***This is another key area for revision and clarification.

The methods section has been updated to show the adopted definition based on Lundbergs definition of therapeutic TAT. The pre-analytic TAT was defined as from the point of order of tests to the point of receipt in the laboratory for processing. – Lines 75 - 78

3. The key factual findings that results were “out” in the laboratory but not accessible to the clinicians can only be true if it is confirmed that the telephone and electronic means of communicating results were not used. The authors must expressly state if this is the case.

We have added this as a limitation as we did not track the telephone communications for critical results in this study. Very few critical results are communicated and there is a separate paper that specifically deals with communication of critical results that demonstrated this. However, there are no electronic means of communications of results. – Lines 226 - 235

4. The figure regarding the contribution of the “non-analytical” phase (96%) needs recalculation.

We have re-worded this paragraph so that it is now more clear. The meaning of this is that pre-analytical and post-analytica delays contribute up to 96% prolongation of the therapeutic TAT and indeed the laboratory delays are minimal. – Lines 43 - 46

5. Time comparisons of TATs must only be made with similarly defined TATs in order to be meaningful.

We have stated this as a major challenge that affects all studies that try to do comparisons of TAT as studies differ in the definition of TAT. A standardization of TAT is needed to improve on the comparisons.

6. Speculative aspects of the discussion must be minimised, for instance staff being tired as the week progresses.

We have removed the speculative aspects of the discussion and limited the discussion to only the available results.

7. The findings that TATs were higher with more staff available must be analysed in the context of a meaningful denominator such as number of samples per staff member. This cannot be a simple case of “too many cooks spoil the broth”

We have added a boxplot with the number of samples for each number of staff included in order to aid in interpretation. We have also stated that this is an interesting finding that may require further exploration as we may not have all the data to explain this phenomenon. – Figure 5, Figure 6

Attachment

Submitted filename: Response to comments from reviewers.docx

Decision Letter 1

Helena Kuivaniemi

11 Mar 2020

Therapeutic turnaround times for common laboratory tests in a tertiary hospital in Kenya

PONE-D-19-21599R1

Dear Dr. Mwogi,

We are pleased to inform you that your manuscript has been judged scientifically suitable for publication and will be formally accepted for publication once it complies with all outstanding technical requirements.

Congratulations!

Within one week, you will receive an e-mail containing information on the amendments required prior to publication. When all required modifications have been addressed, you will receive a formal acceptance letter and your manuscript will proceed to our production department and be scheduled for publication.

Shortly after the formal acceptance letter is sent, an invoice for payment will follow. To ensure an efficient production and billing process, please log into Editorial Manager at https://www.editorialmanager.com/pone/, click the "Update My Information" link at the top of the page, and update your user information. If you have any billing related questions, please contact our Author Billing department directly at authorbilling@plos.org.

If your institution or institutions have a press office, please notify them about your upcoming paper to enable them to help maximize its impact. If they will be preparing press materials for this manuscript, you must inform our press team as soon as possible and no later than 48 hours after receiving the formal acceptance. Your manuscript will remain under strict press embargo until 2 pm Eastern Time on the date of publication. For more information, please contact onepress@plos.org.

With kind regards,

Helena Kuivaniemi, MD, PhD

Academic Editor

PLOS ONE

Additional Editor Comments (optional):

Reviewers' comments:

Reviewer's Responses to Questions

Comments to the Author

1. If the authors have adequately addressed your comments raised in a previous round of review and you feel that this manuscript is now acceptable for publication, you may indicate that here to bypass the “Comments to the Author” section, enter your conflict of interest statement in the “Confidential to Editor” section, and submit your "Accept" recommendation.

Reviewer #1: All comments have been addressed

Reviewer #2: All comments have been addressed

Reviewer #3: All comments have been addressed

**********

2. Is the manuscript technically sound, and do the data support the conclusions?

The manuscript must describe a technically sound piece of scientific research with data that supports the conclusions. Experiments must have been conducted rigorously, with appropriate controls, replication, and sample sizes. The conclusions must be drawn appropriately based on the data presented.

Reviewer #1: Yes

Reviewer #2: (No Response)

Reviewer #3: Yes

**********

3. Has the statistical analysis been performed appropriately and rigorously?

Reviewer #1: N/A

Reviewer #2: (No Response)

Reviewer #3: Yes

**********

4. Have the authors made all data underlying the findings in their manuscript fully available?

The PLOS Data policy requires authors to make all data underlying the findings described in their manuscript fully available without restriction, with rare exception (please refer to the Data Availability Statement in the manuscript PDF file). The data should be provided as part of the manuscript or its supporting information, or deposited to a public repository. For example, in addition to summary statistics, the data points behind means, medians and variance measures should be available. If there are restrictions on publicly sharing data—e.g. participant privacy or use of data from a third party—those must be specified.

Reviewer #1: Yes

Reviewer #2: (No Response)

Reviewer #3: Yes

**********

5. Is the manuscript presented in an intelligible fashion and written in standard English?

PLOS ONE does not copyedit accepted manuscripts, so the language in submitted articles must be clear, correct, and unambiguous. Any typographical or grammatical errors should be corrected at revision, so please note any specific errors here.

Reviewer #1: Yes

Reviewer #2: (No Response)

Reviewer #3: Yes

**********

6. Review Comments to the Author

Please use the space provided to explain your answers to the questions above. You may also include additional comments for the author, including concerns about dual publication, research ethics, or publication ethics. (Please upload your review as an attachment if it exceeds 20,000 characters)

Reviewer #1: (No Response)

Reviewer #2: (No Response)

Reviewer #3: All the my comments and suggestions have been adequately addressed.

Congratulations and well done.

**********

7. PLOS authors have the option to publish the peer review history of their article (what does this mean?). If published, this will include your full peer review and any attached files.

If you choose “no”, your identity will remain anonymous but your review may still be made public.

Do you want your identity to be public for this peer review? For information about this choice, including consent withdrawal, please see our Privacy Policy.

Reviewer #1: No

Reviewer #2: Yes: Dr Elizna Maasdorp

Reviewer #3: Yes: Zivanai Cuthbert Chapanduka

Acceptance letter

Helena Kuivaniemi

18 Mar 2020

PONE-D-19-21599R1

Therapeutic turnaround times for common laboratory tests in a tertiary hospital in Kenya

Dear Dr. Mwogi:

I am pleased to inform you that your manuscript has been deemed suitable for publication in PLOS ONE. Congratulations! Your manuscript is now with our production department.

If your institution or institutions have a press office, please notify them about your upcoming paper at this point, to enable them to help maximize its impact. If they will be preparing press materials for this manuscript, please inform our press team within the next 48 hours. Your manuscript will remain under strict press embargo until 2 pm Eastern Time on the date of publication. For more information please contact onepress@plos.org.

For any other questions or concerns, please email plosone@plos.org.

Thank you for submitting your work to PLOS ONE.

With kind regards,

PLOS ONE Editorial Office Staff

on behalf of

Professor Helena Kuivaniemi

Academic Editor

PLOS ONE

Associated Data

    This section collects any data citations, data availability statements, or supplementary materials included in this article.

    Supplementary Materials

    Attachment

    Submitted filename: Response to comments from reviewers.docx

    Data Availability Statement

    All relevant data are within the paper and its Supporting Information files.


    Articles from PLoS ONE are provided here courtesy of PLOS

    RESOURCES