Abstract
Deuterium metabolic imaging, or DMI, is a novel MR-based method to spatially map metabolism of deuterated substrates such as [6,6’-2H2]-glucose in vivo. Compared to traditional 13C-MR-based metabolic studies, the MR sensitivity of DMI is high due to the larger 2H magnetic moment and favorable T1 and T2 relaxation times. Here the magnetic field dependence of DMI sensitivity and transmit efficiency is studied on phantoms and rat brain post mortem at 4 T, 9.4 T and 11.7 T. The sensitivity and spectral resolution on human brain in vivo are investigated at 4 T and 7 T before and after an oral dose of [6,6’-2H2]-glucose. For small animal surface coils (Ø 30 mm), the experimentally measured sensitivity and transmit efficiency scale with the magnetic field to the power +1.75 and −0.30, respectively. These are in excellent agreement with theoretical predictions made from the principle of reciprocity for a coil-noise dominant regime. For larger human surface coils (Ø 80 mm) the sensitivity scales as a +1.65 power. The spectral resolution increases linearly due to near-constant linewidths. With optimal multi-receiver arrays the acquisition of DMI at a nominal 1 mL spatial resolution is feasible at 7 T.
Keywords: Deuterium metabolic imaging, sensitivity, magnetic field dependence, resolution
Graphical Abstract
The magnetic field dependence of Deuterium Metabolic Imaging (DMI) sensitivity and RF efficiency was investigated on phantoms in vitro, rat brain post mortem and human brain in vivo. The sensitivity scaled supralinear, close to the theoretical maximum for all conditions. The enhanced sensitivity at 7 T makes DMI at a nominal 1 mL spatial resolution feasible.
INTRODUCTION
Deuterium metabolic imaging (DMI) is a novel MR-based method to spatially map metabolism (1). DMI falls in the category of stable isotope methods in which an enriched substrate isotope is followed over time as it appears in down-stream metabolic products. Common stable isotope methods include 13C MR spectroscopy (MRS) (2), inverse 1H-[13C] MRS (3) and hyperpolarized 13C MRS (4,5). DMI is characterized by its technical simplicity and robustness as well as the relatively high sensitivity due to the larger magnetic moment and short T1 relaxation time constants. The low natural abundance of 2H of 0.0115% (6) leads to low-intensity water and lipid signals, thus eliminating the need for water and lipid suppression. To maximize sensitivity, the 2H signal is excited by a single RF pulse, after which spatial localization is achieved with short 3D phase encoding blips before FID acquisition. The robustness of DMI is further enhanced by the low sensitivity to magnetic field inhomogeneity due to the low 2H Larmor frequency.
The sensitivity and thereby the utility of MRI and MRS improves at higher magnetic fields, as has previously been demonstrated for 1H (7,8), 17O (9), 23Na (10) and 31P (11) nuclei. The low 2H Larmor frequency, together with the field independent T1 and T2 relaxation constants (1,12), predicts a near-quadratic magnetic field dependence of the SNR in a coil-noise-dominant regime. In this work the magnetic field dependence of DMI is experimentally investigated for a range of magnetic fields and RF coils in order to understand the possibilities of DMI on clinical 3 T magnetic fields and predict the potential gains achievable at 7 T for humans or at ultra-high magnetic fields for animals.
THEORY
Starting from the principle of reciprocity (13,14) it can be derived that the SNR of an NMR experiment has a strong dependence on the magnetic field strength, and thus the Larmor frequency ω, according to
| [1] |
where R equals the total resistance, including coil (Rcoil) and sample (Rsample) contributions. Q represents the coil quality factor given by
| [2] |
At RF frequencies where the coil conductor radius is much larger than the RF skin depth, the coil resistance, Rcoil, is proportional to ω1/2. The sample resistance, Rsample, is dominated by inductive losses from sample-induced eddy currents. In addition to a dependence on the sample size and sample conductivity, Rsample has an ω2 dependence on the Larmor frequency when neglecting the frequency dependence of tissue conductivity. For a coil noise dominant condition (Rcoil >> Rsample) the SNR thus becomes proportional to ω7/4, whereas for a sample noise dominant condition (Rsample >> Rcoil) the SNR increases linearly with ω.
The transmit RF field amplitude B1+ for unit power has a dependence on the Larmor frequency according to
| [3] |
For coil and sample noise dominant conditions, B1+ becomes proportional to ω−1/4 and ω−1, respectively.
METHODS
MR systems
All studies were performed on magnetic field strengths ranging from 4 T to 11.7 T. The clinical 4 T MR system is interfaced to a Bruker Avance III HD spectrometer, running on Paravision 6 (Bruker Biospin Corporation, Billerica, MA, USA) and equipped with gradients capable of switching 30 mT/m in 1150 μs. The clinical Achieva 7 T MR system (Philips, Cleveland, OH, USA) comprises a whole-body magnet and gradients capable of switching 40 mT/m in 200 μs. The preclinical 9.4 T and 11.7 T systems are interfaced to Bruker Avance III HD spectrometers, running on Paravision 6 (Bruker Biospin Corporation, Billerica, MA, USA) and equipped with gradients capable of switching 300 mT/m in 150 μs.
RF coils
RF transmission and reception were performed with a single-turn RF surface coil tuned for 2H (26.2 MHz, 45.7 MHz, 61.5 and 76.7 MHz at 4 T, 7 T, 9.4 T and 11.7 T, respectively) and sized for animal (Ø 30 mm, 4 T, 9.4 T and 11.7 T) or human (Ø 80 mm, 4 T and 7 T) studies. No 1H RF coil was present in any of the studies in order to maintain a simple and robust setup over multiple magnetic fields and multiple laboratories. For a comparison between 2H and 13C MR sensitivities at 4 T, the 80 mm diameter 2H surface coil was retuned to the 13C Larmor frequency (42.8 MHz). MR system noise figures were measured with the hot-cold resistor method (15) and loaded and unloaded coil Q values were measured using a vector network analyzer (Agilent, Santa Clara, CA, USA).
Signal acquisition
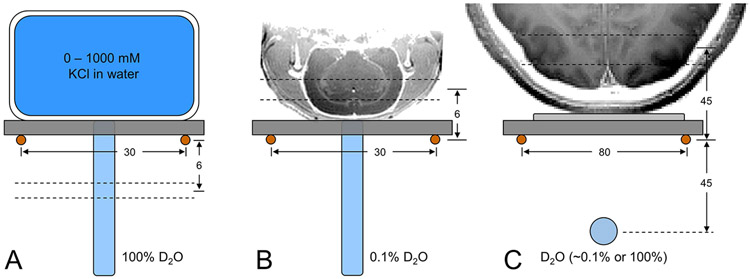
In vitro measurements on the magnetic field dependence of RF transmission efficiency and 2H MR sensitivity were performed at 4 T, 9.4 T and 11.7 T with the setup shown in Fig. 1A. Signal is acquired from a 2 mm thick plane through a shortened, 5 mm diameter NMR tube containing 100% D2O selected 6 mm below the plane of the 2H surface coil (Ø 30 mm). Seven different flat-bottom phantoms (circa 50 mL) containing between 0 and 1000 mM KCl solutions are placed above the 2H surface coil to simulate a range of coil loading conditions. Optimization of the magnetic field homogeneity was achieved on the natural abundance 2H water signal through manual adjustment of the three linear magnetic field gradients, resulting in 5 - 10 Hz line widths across the small (circa 25 μL) detection volume. For each load, the RF power required to achieve a 90° nutation angle with a 250 μs square pulse is determined, after which a 2H NMR spectrum with optimal RF power is acquired for SNR determination.
Figure 1:
Experimental setups to characterize DMI (A) on phantoms in vitro, (B) on rat brain post mortem and (C) on human brain in vivo. Due to the lack of a 1H MRI coil, all images were acquired in a separate study and are shown for illustration purposes only. (A) Phantoms with (R3.9) different KCl concentrations are used to change sample conductivity, and hence achieve a range of coil loads in vitro, whereby signal is always acquired from a 2 mm slice 6 mm below the 2H RF coil. (B, C) On rat brain post mortem and human brain in vivo, signal is acquired in the form of 3D DMI whereby analysis is limited to the indicated slice position. On human brain a 100% D2O phantom was used for RF power calibration and then replaced with a 0.1% D2O phantom for position referencing during DMI. All distances are in mm.
The magnetic field dependence of DMI on animals was performed on rat head post mortem (Fig. 1B) at 4 T, 9.4 T and 11.7 T. 2H signal was acquired with a pulse-acquire pulse sequence (TR = 400 ms) extended with phase-encoding gradients for 3D DMI (13 x 13 x 13 matrix over 39 x 39 x 39 mm). Optimization of the magnetic field homogeneity was achieved on the natural abundance 2H water signal through manual adjustment of the three linear magnetic field gradients, resulting in 20 - 26 Hz 2H water line widths across the entire rat head. The water linewidths as determined in the individual MRSI voxels were determined as 14 – 17 Hz. No field-dependent linewidth trend was observed. The excitation pulse power was derived from the in vitro RF power calibration for the loaded Q value of rat head post mortem.
Studies on human brain (Fig. 1C) were performed on natural abundance water (n = 3 at both 4 T and 7 T) or following the oral administration of [6,6’-2H2]-glucose (0.75 g/kg, n = 2 at both 4 T and 7 T). The optimal RF power setting for the 500 μs square excitation pulse was first calibrated on a spherical phantom (circa 2 mL) containing 100% D2O placed 45 mm below the plane of the 2H RF coil in the presence of the human head load. Following RF power calibration, the 100% D2O phantom was replaced with a 0.1% D2O phantom for position referencing without moving the human head load. The magnetic field homogeneity was optimized on the natural abundance 2H water signal by manual adjustment of the three linear magnetic field gradients. 3D DMI data (TR = 333 ms, 4 averages) was acquired at a nominal 8 mL (11 x 11 x 11 matrix over 220 x 220 x 220 mm) or 1 mL resolution (11 x 11 x 11 matrix over 110 x 110 x 110 mm). In order to ensure consistency in data acquisition between the two sites and platforms, DMI data was acquired for every point in the cuboidal k-space grid leading to a total scan time of 29.5 min.
For a comparison between 2H and 13C MR sensitivities at 4 T, the small spherical sphere (Fig. 1C) was filled with 1 M [1-2H]-formate or 1 M [1-13C]-formate in water. In the presence of a human head load, the 500 μs square excitation pulse was calibrated after which fully-relaxed 2H (TR = 10 s) or 13C (TR = 60 s) MR data were collected with a pulse-acquire method. The experimental sensitivities of 2H and 13C at a given magnetic field were evaluated theoretically according to
| [4] |
whereby γ represents the gyromagnetic ratio (in MHz/T) and I is the nuclear spin. Besides the intrinsic parameters, the experimental sensitivity is determined by a number of factors like signal enhancement η, which can include nuclear Overhauser enhancement or polarization transfer. Sensitivity is linearly proportional to the number of detectable nuclei, N, per molecule and the decoupling efficiency D. Finally, the sensitivity is proportional to the square root of the T2* over T1 relaxation time constants.
Data analysis
Non-localized 2H MR data was processed by 5 Hz line broadening, zero filling to 4,096 points and Fourier transformation. Localized 2H MR data acquired with 3D phase encoding was Fourier transformed over the three spatial dimensions without filtering or zero filling. For each localized signal the missing acquisition points due to the phase encoding gradient duration were recovered via SVD-based linear projection. Localized 2H MR spectra were finally obtained with a 5 Hz line broadening, zero filling to 4,096 points and Fourier transformation.
The dependence of the receive SNR and transmit efficiency (B1+ for 1 W input power) were modeled according to CQ1/2, whereby the constant C was determined by least-squares minimization. The magnetic field dependence of the 2H SNR was modeled as SNR ∝ B0n, whereby n was unconstrained, but theoretically expected to fall in the range [1.00 … 1.75]. The 2H transmit efficiency was modeled as B1+ ∝ B0m whereby m was unconstrained and theoretically expected to fall in the range [−1.00 … −0.25]. The peak integral and peak height SNRs are determined experimentally as the 2H water signal integral (integrated between −0.5 ppm and +0.5 ppm relative to the center 2H water frequency) or 2H water signal height, respectively, divided by the standard deviation of the spectral noise between 10 and 20 ppm downfield from water. All SNR values are corrected for the receiver chain noise figure (NF) according to SNRcorrected = SNRmeasured x 10+(NF/20). For the phantom studies, the highest experimentally measured SNR (demineralized water at 11.7 T) is defined as a relative SNR of 100.
The spatial and spectral resolution of DMI on human brain at 4 T and 7 T was investigated between 50 and 115 min following oral administration of [6,6’-2H2]-glucose (0.75 g/kg).
RESULTS
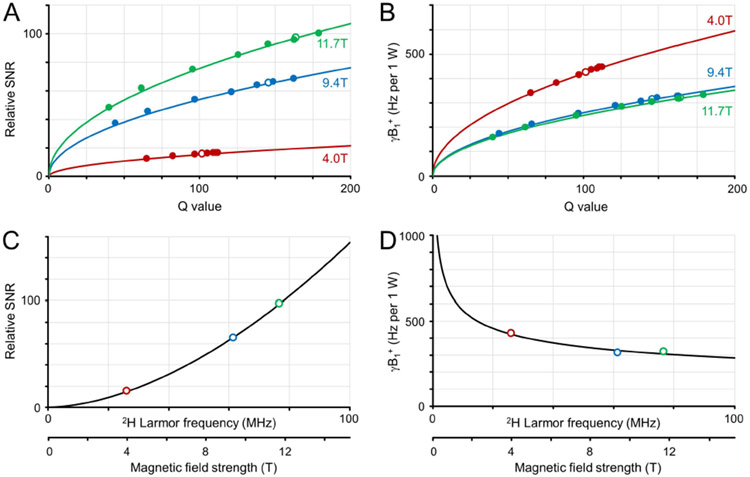
Figure 2 provides an overview of the in vitro measurements on 2H SNR (Fig. 2A) and transmit efficiency (Fig. 2B) for the 30 mm diameter 2H surface coil. For all magnetic fields the relative SNR and relative transmit efficiency B1+ (per 1 W) increased with increasing RF coil Q value. The experimentally measured relative SNR values could be accurately modeled with C.Q1/2, with C = 1.52, 5.40 and 7.58 for 4.0 T, 9.4 T and 11.7 T, respectively. The measured transmit efficiencies were also modeled as CQ1/2, with C = 42.03, 25.93 and 24.93 Hz per 1 W for 4.0 T, 9.4 T and 11.7 T, respectively. For identical Q values, the SNR and B1+ relations have ω+1.51 and ω−0.52 dependencies, as predicted by Eqs. [1] and [3] for a coil noise dominant regime. For a realistic coil load (rat brain post mortem) the loaded RF coil Q value increases with increasing magnetic field (open dots in Figs. 2A and B). When the magnetic field dependence for rat brain is modeled (Fig. 2C/D) the SNR and B1+ relations have ω+1.75 and ω−0.30 dependencies, close to that predicted for a coil noise dominant regime.
Figure 2:
Deuterium sensitivity and transmit efficiency on phantoms in vitro. (A) Relative SNR and (B) transmit field amplitude per 1 W input power as a function of RF coil Q value for a range of coil loads at 4 T (red), 9.4 T (green), 11. T (blue). The solid dots represent experimental data, whereas the solid line represents the best fit according to CQ1/2. The open dots represent the values for RF coil Q with a post mortem rat brain load. (C, D) Magnetic field dependence of (C) relative SNR and (D) transmit efficiency for rat brain postmortem. The solid (R3.10) lines represent the best fit according to CB0n.
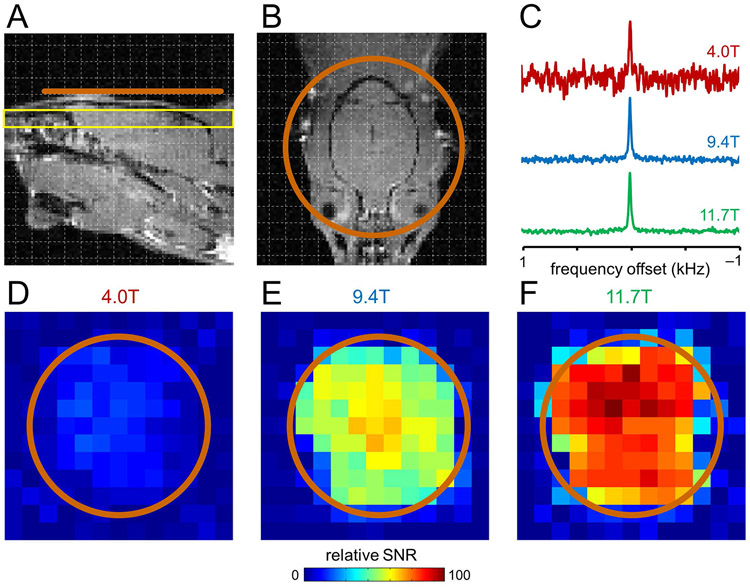
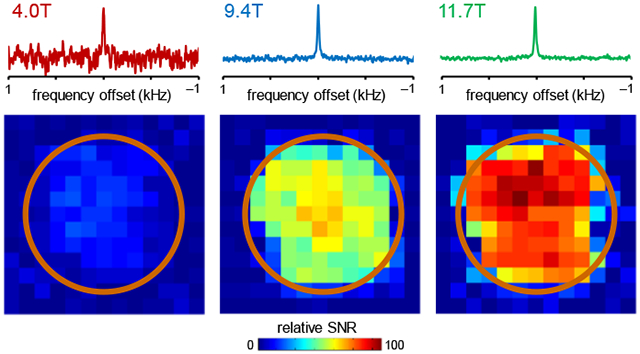
Figure 3 provides DMI maps of the natural abundance 2H water signal in rat brain post mortem at three magnetic fields at the slice position (yellow) relative to the DMI coil (orange) shown in Fig. 3A/B. The magnetic field dependence of the 2H SNR that was quantitatively established in Fig. 2 is readily recognized in the DMI maps at 4 T (Fig. 3D), 9.4 T (Fig. 3E) and 11.7 T (Fig. 3F) as well as representative 2H MR spectra from a single DMI pixel (Fig. 3C).
Figure 3:
DMI sensitivity on rat brain post mortem at 4 T, 9.4 T and 11.7 T. (A, B) Anatomical MRI showing the approximate surface coil position (copper, Ø 30 mm). Due to the lack of a 1H MRI coil, all images were acquired in a separate study and are shown for illustration purposes only. (C) Representative DMI spectra (27 μL) from 4 T (red), 9.4 T (green) and 11.7 T (blue) scaled to identical 2H natural abundance water peak heights. (D-F) Sensitivity maps of natural abundance water from the position shown in (A, yellow slice) at (D) 4 T, (E) 9.4 T and (F) 11.7 T.
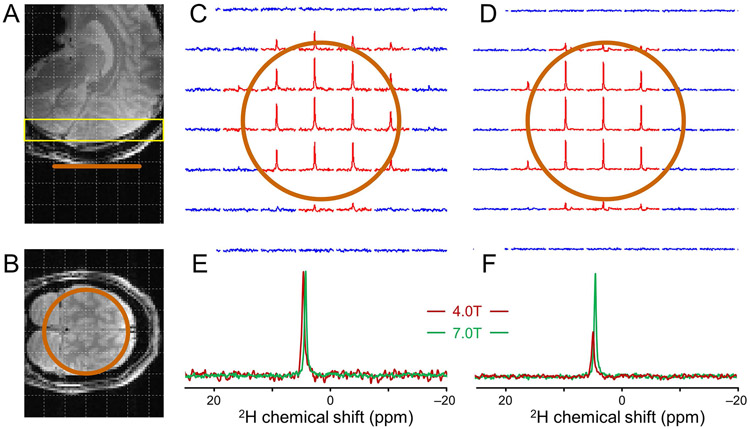
Figure 4 shows 2H MR data from the natural abundance water signal in human brain in vivo at 4 T and 7 T at the slice position (yellow) relative to the DMI coil (orange) shown in Fig. 4A/B. At a nominal 20 x 20 x 20 mm or 8.0 mL spatial resolution both magnetic fields provide high-quality 2H MR spectra in a coronal slice parallel to the 80 mm diameter 2H surface coil (Fig. 4C/D). 2H MR spectra extracted from a central location and scaled for equal intensity (Fig. 4E) or equal noise level (Fig. 4F) clearly show the SNR increase at 7 T. In terms of peak integral SNR as averaged over nine pixels with the highest SNR, the 2H MR data at 7 T are 2.52 ± 0.19 (mean ± SD) times higher than at 4 T. This corresponds to a magnetic field dependence B0n, whereby n = 1.65 ± 0.14. The lower magnetic field dependence indicates that for DMI at 7 T the sample noise starts to contribute. This is also confirmed by the larger RF coil Q value drop at 7 T than at 4 T (Qunloaded = 205 and Qloaded = 163 at 4 T and Qunloaded = 367 and Qloaded = 173 at 7 T). The peak height SNR as averaged over nine pixels with the highest SNR are 39.3 ± 4.9 and 95.9 ± 10.9 at 4 T and 7 T, respectively. The peak height SNR as measured from global 2H MR spectra (180 averages, 1 minute, data not shown) are 169.2 ± 13.3 and 423.1 ± 25.7 at 4 T and 7 T, respectively. For both cases, a similar magnetic field dependence B0n, as calculated above is found.
Figure 4:
DMI sensitivity on human brain in vivo at 4 T and 7 T. (A, B) Anatomical MRI showing the approximate surface coil position (copper, Ø 80 mm). (C, D) DMI maps of natural abundance water from the position shown in (A, yellow slice) at (C) 4 T and (D) 7 T (8 mL, 30 min). Only the inner 7x7 grid from a total 11x11x11 grid is shown. (E, F) Representative DMI spectra from 4 T (red) and 7 T (green) scaled for (E) equal peak height and (F) equal noise level.
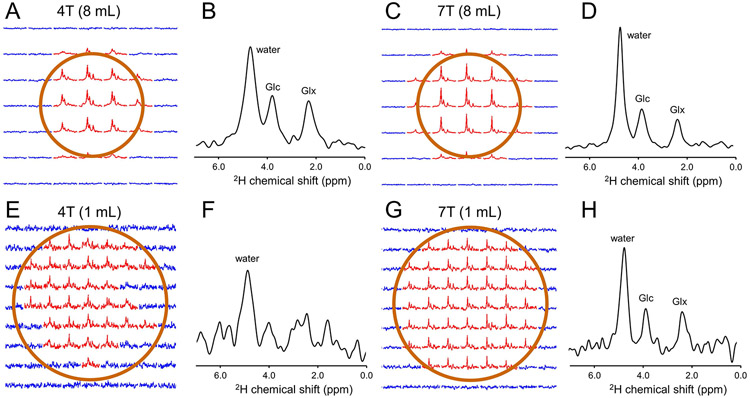
Figure 5 shows DMI data acquired on human brain in vivo at 4 T at 7 T at a nominal spatial resolution of 8 mL (Fig. 5A-D) and 1 mL (Fig. 5E-H) in a coronal slice parallel to the 80 mm diameter 2H surface coil. DMI at 8 mL and 1 mL resolution were acquired between 50 and 80 min and between 85 and 115 min following the oral administration of [6,6’-2H2]-glucose, respectively. At a nominal 8 mL resolution both 4 T and 7 T provide high-quality 2H MR spectra within the sensitive area of the surface coil with clear signals from water, glucose (Glc) and glutamate/glutamine (Glx). Increasing the spatial resolution from 8 mL to 1 mL is accompanied by a proportional decrease in SNR (Fig. 5E-H). While the water signal can still be recognized in every DMI voxel at 4 T, the 2H MR spectra has insufficient SNR to reliably detect Glc and Glx. The approximately 2.5 times higher SNR at 7 T (Fig. 4) as compared to 4 T allows the visual detection of Glc and Glx in addition to water in every DMI voxel.
Figure 5:
DMI on human brain following oral administration of [6,6’-2H2]-glucose. (A, C) DMI and (B, D) representative spectra from (A) 4 T and (C) 7 T acquired 50-80 min after glucose administration at an 8 mL resolution. (E, G) DMI and (F, H) representative spectra from (E, F) 4 T and (G, H) 7 T acquired 85-115 min after glucose administration at a 1 mL resolution.
Spectral fitting of the 8 mL DMI data yields spectral linewidths of 11.8 ± 1.1, 9.4 ± 1.6 and 10.0 ± 1.0 Hz for water, glucose and Glx at 4 T and 11.7 ± 1.7, 10.3 ± 1.4 and 11.1 ± 1.7 Hz for water, glucose and Glx at 7 T. The near-constant line widths translate directly into an improved spectral resolution at 7 T. These linewidths can be used to calculate relative Cramer-Rao lower bounds (CRLBs) for water, glucose and Glx at equal noise levels. It is found that the CRLBs for water and glucose decrease by circa 5-10% due to the small amount of spectral overlap, whereas the CRLB for Glx does not change between 4 T and 7 T. The small frequency difference of 0.1 ppm between glutamate (Glu) and glutamine (Gln) relative to the circa 0.24 ppm linewidth does not allow a robust separation at 7 T.
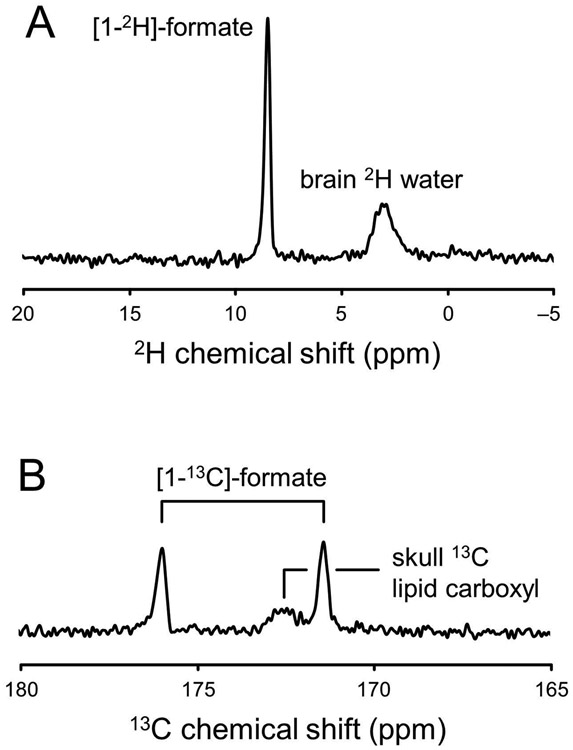
Figure 6 shows a comparison between 2H and 13C MR sensitivities for an 80 mm diameter surface coil at 4 T. Fig. 6A shows a pulse-acquire 2H MR spectrum from 1 M [1-2H]-formate. In addition to the [1-2H]-formate signal, the spectrum contains natural abundance 2H water signal from the human head. Fig. 6B shows a pulse-acquire 13C MR spectrum from 1 M [1-13C]-formate. In addition to the [1-13C]-formate signal, the spectrum contains natural abundance 13C signal from non-protonated lipid carboxyl groups in the human head. The relative sensitivities of 2H and 13C were determined as 1.00 and 1.02, in good agreement with theoretical predictions based on the gyromagnetic ratios γ and nuclear spin I (Table 1, lines 1 – 3 and Eq. [4]). It demonstrates that 2H and 13C MR have similar intrinsic sensitivities as the gain in 2H sensitivity due to the high magnetic moment is compensated by the gain in 13C sensitivity due to the higher gyromagnetic ratio and hence the higher Larmor frequency. When considering the additional factors that affect the experimental MR sensitivity, 2H MR is predicted to be circa two times more sensitive than 13C MR. This can be largely attributed to the shorter T1 relaxation times of deuterium.
Figure 6:
Experimental 2H and 13C MR sensitivities. Pulse-acquire (A) 2H and (B) 13C MR spectra obtained from a small phantom containing 1 M [1-2H] or 1 M [1-13C]-formate in the presence of a human head load at 4 T. In addition to the formate signal, the spectra contain natural abundance signals from water (A) or lipids (B). As the magnetic field homogeneity and nutation angle was optimized on the formate sphere, the natural abundance signals are generally broad and overrotated.
Table 1.
2H and 13C MR sensitivity factors 1
| Parameter | expression | 2H | 13C |
|---|---|---|---|
| Gyromagnetic ratio (MHz/T) | γ | 6.54 | 10.69 |
| Nuclear spin | I | 1 | ½ |
| Relative intrinsic sensitivity | γ2I(I+1) | 1 | 1.002 |
| T2* relaxation | √T2* | 1 | 1.2 |
| T1 relaxation | 1/√T1 | 3 (2 – 5) | 1 |
| Signal enhancement (nOe/PT) | η | 1 | 2 (1 – 4) |
| Number of nuclei | N | 1.5 (1 – 3) | 1 |
| Decoupling efficiency | D | 1 | 0.9 (0.8 – 1) |
| Experimental sensitivity | Eq. [4] | 4.5 | 2.2 |
Table with values used in SNR calculations for 2H and 13C (Eq. [4]), with typical parameter value ranges indicated between parentheses.
DISCUSSION
The magnetic field dependence of deuterium metabolic imaging, or DMI, was investigated in terms of sensitivity, transmit efficiency and spectral resolution on phantoms, rat brain post mortem and human brain in vivo. The sensitivity and transmit efficiency on small animal surface coils (30 mm) scale with the magnetic field strength B0 with powers of +1.75 and −0.30, respectively, closely following predictions made by the principle of reciprocity for a coil-noise dominant regime. The magnetic field dependence of sensitivity for larger human brain surface coils (80 mm) is slightly less (B0+1.65) than the theoretical maximum (B0+1.75), indicating that the sample-noise starts to become an observable contributor to the overall noise.
The DMI sensitivity for small animal coils scales at the theoretical maximum with magnetic field strength indicating that coil noise is dominant for magnetic fields up to 11.7 T. The 30 mm diameter surface coil used on these studies is on the larger end for rodent heads, with 15-20 mm and 10-15 mm diameters being more common for rat and mouse brains, respectively. Since the sample noise reduces relative to the coil noise for smaller coils, it is expected that the favorable magnetic field dependence of DMI will extend far beyond 11.7 T for rodent brain optimized coil sizes. In the coil noise dominated regime the sensitivity can be improved through coil noise reduction via active cooling of the RF coil and preamplifier circuits. Theoretical predictions (13,14) and experimental demonstrations on small 1H and 13C coils (16-18) give around two-fold sensitivity improvement over equivalent room temperature coils.
The initial studies on DMI were performed on a clinical research 4 T MR scanner and acquired at a nominal resolution of 8 mL (1). This spatial resolution was primarily determined by the low transmit homogeneity of the employed, four-channel RF coil, forcing reduced nutation angles in the center of the brain in order to maintain signal in all positions within the active coil volume. As a result, the DMI sensitivity in more superficial locations was up to three-fold higher than in the center of the brain. A more homogeneous transmit RF coil in combination with the circa 2.5-fold higher SNR at 7 T would make a nominal 1 mL DMI acquisition feasible. Using similar arguments, the circa four-fold lower sensitivity of 3 T relative to 7 T should allow for a nominal 4 – 8 mL DMI acquisition at 3 T.
The spectral resolution increases linearly between 4 T and 7 T due to near-constant linewidths for water, glucose and glutamate/glutamine. However, for equal noise levels the Cramer-Rao lower bounds at 4 T and 7 T are nearly identical due to the lack of significant spectral overlap even at 4 T. The strong spectral overlap between glutamate and glutamine is not significantly reduced at 7 T, such that only the sum of Glx can be reliably quantified. The spectral linewidths continue to be nearly independent of the magnetic field even beyond 7 T, as have been shown for animal brain at 11.7 T (1) and 16.4 T (12). The independence of T2* relaxation on the magnetic field strength is mirrored for T1 and T2 relaxation times that were shown to be essentially constant between 4.0 T and 11.7 T (1) and even up to 16.4 T (12). The near-constant relaxation times continue to benefit DMI at all magnetic fields by allowing rapid signal averaging due to short T1s, while maintaining reasonable spectral resolution.
DMI has been shown to generate spatially resolved maps of cerebral metabolism in vivo. This is in strong contrast to conventional (non-hyperpolarized) 13C-MR-based methods that provide similar information at improved spectral resolution (R3.8), but obtained from much larger, single volumes. The SNR of a given nucleus, as summarized in Eq. [4], is proportional to fundamental parameters (gyromagnetic ratio, γ, and magnetic moment, I(I + 1), with I the spin quantum number) and a range of experimental parameters that include T1 and T2* relaxation, number of equivalent nuclei, signal enhancements and decoupling. Table 1 provides a summary of the various factors contributing to the intrinsic and experimental sensitivities of 2H and 13C MR. As confirmed experimentally (Fig. 6A/B), the intrinsic 2H and 13C sensitivities (γ2I(I + 1)) are almost identical as the higher 2H magnetic moment is balanced by the higher 13C gyromagnetic ratio. 2H is characterized by short T1 relaxation times (60 – 400 ms) (1), whereas the T1 relaxation times for protonated 13C nuclei are on the order of 1500 ms (19). This provides a three-fold SNR enhancement for 2H over 13C for an average 2H T1 relaxation time constant of 170 ms (2 – 5 fold enhancement for the full 2H T1 relaxation range). The similar 2H and 13C T2* times of 35 and 50 ms, respectively (19), give a slight enhancement for 13C MR. For 2H and 13C the number of equivalent nuclei are 2 and 1 using [6,6-2H2]-glucose and [1-13C]-glucose as substrate, respectively. The number of equivalent 2H nuclei for downstream metabolic products is reduced to ~1.5 as some 2H label is lost to water (1). Experimentally, 13C MR of protonated 13C nuclei is always performed with signal enhancement via polarization transfer or nuclear Overhauser effects, thereby improving the 13C sensitivity around two-fold (20). In addition, 13C MRS typically requires broadband decoupling. At the RF power settings commonly used in vivo, the decoupling efficiency cannot be expected to exceed 90% of the theoretical maximum (21). Combining all factors in Table 1 according to Eq. [4] predicts that the experimental 2H MR sensitivity is circa two times higher than for 13C MR. While the predicted SNR for 13C MR would allow for similar detection volumes as DMI, non-hyperpolarized 13C metabolic imaging is not commonly employed. This is likely explained by the difference in technical complexity and robustness between DMI and 13C-MR-based metabolic imaging. While DMI only requires a single excitation pulse, 13C MR studies require the use of high-powered broadband decoupling methods and the implementation of robust lipid suppression. Both factors will pose significant challenges to the strict SAR restraints at 7 T and beyond (R1.2 and R3.1). Chen et al (19) showed that proton-observed, carbon-edited (POCE) or 1H-[13C] MRS provides a several-fold higher sensitivity than polarization transfer enhanced 13C MRS. Therefore, even though only a single human demonstration has been published (22), indirect 1H-[13C] MR metabolic imaging is a distinct possibility to map in vivo metabolism non-invasively in 3D. Similar to direct 13C MRS, indirect 1H-[13C] MRS is a powerful research tool that is unlikely to enter the clinical metabolic imaging domain due to the stringent and challenging technical demands on water and lipid suppression and magnetic field homogeneity.
In summary, it has been demonstrated that the sensitivity of DMI scales supralinear with the magnetic field strength for small animal coils between 4 T and 11.7 T and larger human coils between 4 T and 7 T. The improved sensitivity at 7 T allows the acquisition of 3D DMI data at a nominal 1 mL spatial resolution, thereby further underlining the exciting opportunities of DMI in a wide range of pathologies.
ACKNOWLEDGEMENTS
The research is supported by NIH grants R01-EB014861 and R01-EB025840.
ABBREVIATIONS
- CRLB
Cramer-Rao Lower Bound
- DMI
Deuterium Metabolic Imaging
- Glc
Glucose
- Glx
Glutamate + Glutamine
- NF
Noise figure
REFERENCES
- 1.De Feyter HM, Behar KL, Corbin ZA, Fulbright RK, Brown PB, McIntyre S, Nixon TW, Rothman DL, de Graaf RA. Deuterium metabolic imaging (DMI) for MRI-based 3D mapping of metabolism in vivo. Sci Adv 2018;4(8):eaat7314. [DOI] [PMC free article] [PubMed] [Google Scholar]
- 2.Rothman DL, De Feyter HM, de Graaf RA, Mason GF, Behar KL. 13C MRS studies of neuroenergetics and neurotransmitter cycling in humans. NMR Biomed 2011;24:943–957. [DOI] [PMC free article] [PubMed] [Google Scholar]
- 3.de Graaf RA, Rothman DL, Behar KL. State of the art direct 13C and indirect 1H-[13C] NMR spectroscopy in vivo. A practical guide. NMR Biomed 2011;24:958–972. [DOI] [PMC free article] [PubMed] [Google Scholar]
- 4.Nelson SJ, Kurhanewicz J, Vigneron DB, Larson PE, Harzstark AL, Ferrone M, van Criekinge M, Chang JW, Bok R, Park I, Reed G, Carvajal L, Small EJ, Munster P, Weinberg VK, Ardenkjaer-Larsen JH, Chen AP, Hurd RE, Odegardstuen LI, Robb FJ, Tropp J, Murray JA. Metabolic imaging of patients with prostate cancer using hyperpolarized [1-13C]pyruvate. Science translational medicine 2013;5:198ra108. [DOI] [PMC free article] [PubMed] [Google Scholar]
- 5.Cunningham CH, Lau JY, Chen AP, Geraghty BJ, Perks WJ, Roifman I, Wright GA, Connelly KA. Hyperpolarized 13C Metabolic MRI of the Human Heart: Initial Experience. Circ Res 2016;119(11):1177–1182. [DOI] [PMC free article] [PubMed] [Google Scholar]
- 6.Harris RK, Becker ED, Cabral de Menezes SM, Goodfellow R, Granger P. NMR nomenclature: nuclear spin properties and conventions for chemical shifts. IUPAC recommendations 2001. Magn Reson Chem 2002;40:489–505. [DOI] [PubMed] [Google Scholar]
- 7.Vaughan JT, Garwood M, Collins CM, Liu W, DelaBarre L, Adriany G, Andersen P, Merkle H, Goebel R, Smith MB, Ugurbil K. 7T vs. 4T: RF power, homogeneity, and signal-to-noise comparison in head images. Magn Reson Med 2001;46:24–30. [DOI] [PubMed] [Google Scholar]
- 8.Pohmann R, Speck O, Scheffler K. Signal-to-noise ratio and MR tissue parameters in human brain imaging at 3, 7, and 9.4 Tesla using current receive coil arrays. Magn Reson Med 2016;75(2):801–809. [DOI] [PubMed] [Google Scholar]
- 9.Zhu X, Merkle H, Kwag J, Ugurbil K, Chen W. 17O relaxation time and NMR sensitivity of cerebral water and their field dependence. Magn Reson Med 2001;45:543–549. [DOI] [PubMed] [Google Scholar]
- 10.Staroswiecki E, Bangerter NK, Gurney PT, Grafendorfer T, Gold GE, Hargreaves BA. In vivo sodium imaging of human patellar cartilage with a 3D cones sequence at 3 T and 7 T. J Magn Reson Imaging 2010;32(2):446–451. [DOI] [PMC free article] [PubMed] [Google Scholar]
- 11.Lu M, Chen W, Zhu XH. Field dependence study of in vivo brain 31P MRS up to 16.4 T. NMR Biomed 2014;27:1135–1141. [DOI] [PMC free article] [PubMed] [Google Scholar]
- 12.Lu M, Zhu XH, Zhang Y, Mateescu G, Chen W. Quantitative assessment of brain glucose metabolic rates using in vivo deuterium magnetic resonance spectroscopy. J Cereb Blood Flow Metab 2017;37:3518–3530. [DOI] [PMC free article] [PubMed] [Google Scholar]
- 13.Hoult DI, Richards RE. The signal-to-noise ratio of the nuclear magnetic resonance experiment. J Magn Reson 1976;24:71–85. [DOI] [PubMed] [Google Scholar]
- 14.Hoult DI, Lauterbur PC. The sensitivity of the zeugmatographic experiment involving human samples. J Magn Reson 1979;34:425–433. [Google Scholar]
- 15.Hoult DI. The NMR receiver: a description and analysis of design. Prog NMR spectroscopy 1978;12:41–77. [Google Scholar]
- 16.Styles P, Soffe NF, Scott CA, Cragg DA, Row F, White DJ, White PCJ. A high-resolution NMR probe in which the coil and preamplifier are cooled with liquid helium. J Magn Reson 1984;60:397–404. [DOI] [PubMed] [Google Scholar]
- 17.Ratering D, Baltes C, Nordmeyer-Massner J, Marek D, Rudin M. Performance of a 200-MHz cryogenic RF probe designed for MRI and MRS of the murine brain. Magn Reson Med 2008;59:1440–1447. [DOI] [PubMed] [Google Scholar]
- 18.Sack M, Wetterling F, Sartorius A, Ende G, Weber-Fahr W. Signal-to-noise ratio of a mouse brain 13C CryoProbe system in comparison with room temperature coils: spectroscopic phantom and in vivo results. NMR Biomed 2014;27:709–715. [DOI] [PubMed] [Google Scholar]
- 19.Chen H, De Feyter HM, Brown PB, Rothman DL, Cai S, de Graaf RA. Comparison of direct 13C and indirect 1H-[13C] MR detection methods for the study of dynamic metabolic turnover in the human brain. J Magn Reson 2017;283:33–44. [DOI] [PubMed] [Google Scholar]
- 20.de Graaf RA. In Vivo NMR Spectroscopy Principles and Techniques. Chichester: John Wiley; 2019. [Google Scholar]
- 21.de Graaf RA. Theoretical and experimental evaluation of broadband decoupling techniques for in vivo NMR spectroscopy. Magn Reson Med 2005;53:1297–1306. [DOI] [PubMed] [Google Scholar]
- 22.Pan JW, Stein DT, Telang F, Lee JH, Shen J, Brown P, Cline G, Mason GF, Shulman GI, Rothman DL, Hetherington HP. Spectroscopic imaging of glutamate C4 turnover in human brain. Magn Reson Med 2000;44:673–679. [DOI] [PubMed] [Google Scholar]


