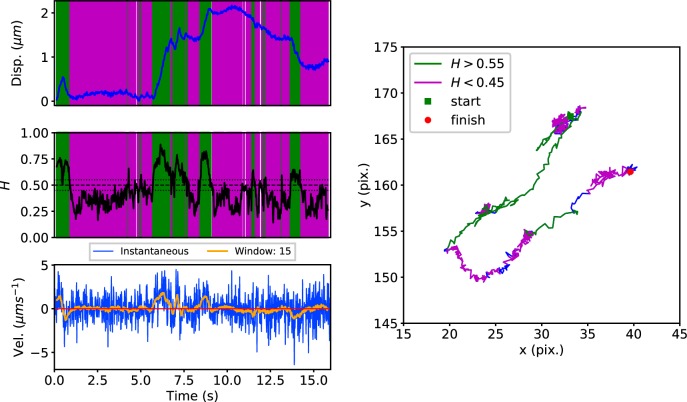
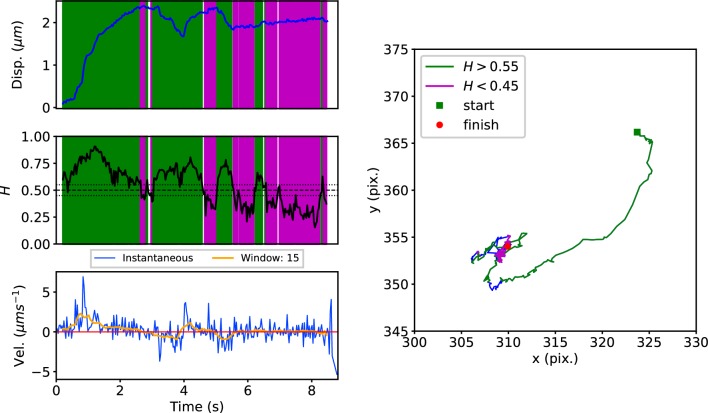
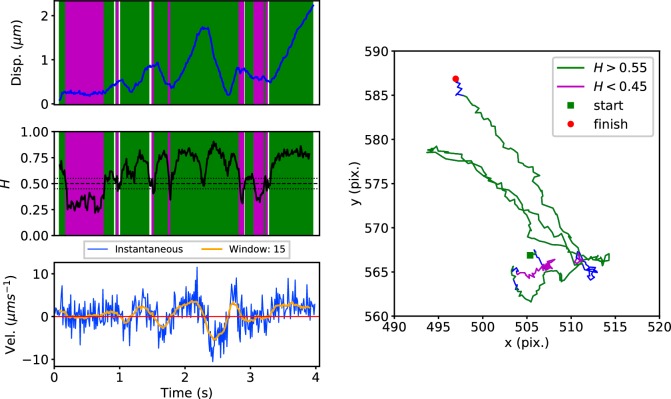
Figure 3. DLFNN analysis of a GFP-Rab5 endosome trajectory.
Top: Plot of displacement from a single trajectory in an MRC-5 cell (blue). Shaded areas show persistent (0.55 < H < 1 in green) and anti-persistent (0 < H < 0.45 in magenta) behaviour. Middle: A 15 point moving window DLFNN exponent estimate for the trajectory (black) with a line (dashed) marking diffusion H = 0.5 and two lines (dotted) marking confidence bounds for estimation marking H = 0.45 and 0.55. Bottom: Plot of instantaneous and moving (15 point) window velocity. Right: Plot of the trajectory with start and finish positions. Persistent (green) and anti-persistent (magenta) segments are shown. For sections that were 0.45 < H < 0.55 were not classified as persistent or anti-persistent and are depicted in blue.


