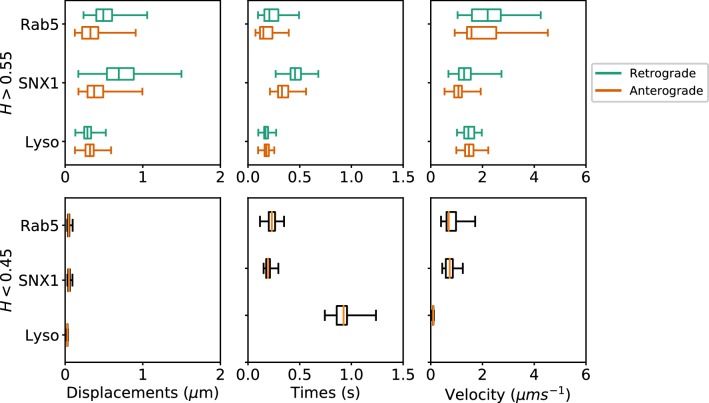
Figure 7. Box and whisker plots of displacements, times and velocities of persistent retrograde, persistent anterograde and anti-persistent segments in experimental trajectories.
Any segment with was classed as persistent and as anti-persistent. These H values were chosen as a precaution against the mean error of the neural network estimation. Each data point within the box and whisker plots are averages of all trajectory segments in a single cell. A total of 65 MRC-5 cells for GFP-Rab5-tagged endosomes, 63 MRC-5 cells for SNX1-GFP-tagged endosomes and 71 MRC-5 cells for lysosomes were analysed with at least 5 to 500 (average 54) anterograde or retrograde segments for each cell.

