

High-resolution atomic force microscopy provides clean imaging of amyloid aggregates at graphene-water interface.
Abstract
To visualize amyloid β (Aβ) aggregates requires an uncontaminated and artifact-free interface. This paper demonstrates the interface between graphene and pure water (verified to be atomically clean using tunneling microscopy) as an ideal platform for resolving size, shape, and morphology (measured by atomic force microscopy) of Aβ-40 and Aβ-42 peptide assemblies from 0.5 to 150 hours at a 5-hour time interval with single-particle resolution. After confirming faster aggregation of Aβ-42 in comparison to Aβ-40, a stable set of oligomers with a diameter distribution of ~7 to 9 nm was prevalently observed uniquely for Aβ-42 even after fibril appearance. The interaction energies between a distinct class of amyloid aggregates (dodecamers) and graphene was then quantified using molecular dynamics simulations. Last, differences in Aβ-40 and Aβ-42 networks were resolved, wherein only Aβ-42 fibrils were aligned through lateral interactions over micrometer-scale lengths, a property that could be exploited in the design of biofunctional materials.
INTRODUCTION
Abnormal peptide aggregation is a signature of protein conformational disorders (1). The presence of aggregated amyloid β (Aβ) in the form of senile plaques and neurofibrillary tangles of microtubule-binding protein tau are the histopathological hallmarks of Alzheimer’s dementia (AD). Hence, Aβ in its two most common isoforms Aβ-40 and Aβ-42 provides a potential target to treat AD, with the more hydrophobic and fibrillogenic Aβ-42, the principal species found in brain lysates of patients with AD (2). Previously, the aggregation pathway of Aβ-42 peptides from Aβ monomers (3–5) to mature fibrils has been studied in the context of the amyloid cascade hypothesis (6). There is an emerging consensus that the soluble Aβ-42 oligomeric species (dimers, trimers, and small oligomeric aggregates but not monomers) are more neurotoxic (4) than the previously implicated insoluble Aβ-42 mature fibrils and dense fibril meshes (senile plaques) (2, 4). The knowledge gained so far has not yet been translated into drugs for preserving or restoring cognition, despite the advances made in understanding AD pathogenesis (7).
It is becoming increasingly important to study the relationship between aggregation rates and morphological changes over time of the metastable Aβ-42 oligomers in comparison with the more prevalent but slower aggregating Aβ-40 peptides (5, 8). The faster aggregation of Aβ-42 than Aβ-40 has been attributed to the two extra hydrophobic amino acid residues at the C-terminus of the Aβ-42 peptides (9–12). Previously, several techniques have been used to clarify individual aspects of the Aβ aggregation, including dynamic light scattering (13), SDS–polyacrylamide gel electrophoresis (14), lipid-coated nanopores using resistive pulse sensing (5), and size exclusion chromatography (15) to estimate the size of oligomers in solution. However, these techniques do not provide a comprehensive map because they cannot visualize the size and shape changes that the Aβ peptides undergo under physiological conditions. Atomic force microscopy (AFM) is a technique that can image single proteins (16–18) in an aqueous medium with high spatial resolution at room temperature. To obtain morphological information on peptide nanostructures with an AFM, the peptides must be adsorbed on a solid surface and maintained in a hydrated state. It is necessary to select a surface that can serve as a reliable imaging platform that can be preserved in a clean state free from contaminants even under ambient conditions. In the general context of Aβ peptides, roughness (19) and chemical modification (20) of the host surface have been demonstrated to influence Aβ oligomer assembly patterns (20) and rate of fibril formation (21) verified through AFM at the aqueous solution–solid interface. In the past, AFM-based studies have been conducted to characterize the morphology of Aβ-40 (22, 23) and the Aβ-42 (19, 22, 24–26) aggregates. However, only a few AFM-based studies have together investigated (27, 28) the assembly of Aβ-40 and Aβ-42 aggregates prepared using identical protocols and fewer still with high spatial resolution (28, 29). Note that, to date, the vast majority of AFM studies that focused on resolving the morphology and aggregation kinetics of Aβ peptides have been conducted either on highly charged mica (29, 30) or on chemically functionalized (21, 25, 26) mica. Other studies on freshly cleaved mica have shown that cleavage under ambient conditions can result in the formation of potassium carbonate crystals on the mica surface (31, 32). Furthermore, when mica is exposed to buffer aqueous solution such as phosphate-buffered saline (PBS) (pH 7.2) and saline sodium citrate (pH 3.1), nanometer-sized buffer molecules coat the surface (33). The presence of these adsorbates and ambient contaminants on mica may not be very critical during AFM imaging of large biomolecules such as DNA but can completely obscure small Aβ oligomers or be mistaken for Aβ oligomers. Also, there is the additional issue of contamination of the AFM probe itself in a buffer medium (34), which can make it extremely difficult to reliably characterize true oligomer size distributions.
We hypothesized that using atomically clean single-layer epitaxially grown graphene as an imaging platform could overcome the limitation of commonly used surfaces for protein imaging such as graphite that can structurally denature proteins (35) and mica that tends to attract ambient contaminants (31, 32). To test this hypothesis, we deposited Aβ-40 and Aβ-42 peptides aggregated in PBS buffer aqueous solution (pH 7.4) onto a single-layer graphene surface (atomic structure and thickness verified through scanning tunneling microscopy; fig. S1) during different stages of aggregation ranging from 0.5 to 150 hours and monitored the morphological changes with a liquid-based AFM. This approach resolved both the soluble forms (monomers and oligomers) and insoluble forms (protofibrils with nodular morphology, mature single fibrils, and fibril networks) of Aβ-40 and Aβ-42 at the graphene-water interface with single-particle resolution. As a proof of concept, we demonstrate that a pristine experimental setting (atomically clean graphene and an uncontaminated AFM tip; see section S1) that maintains amyloids in a hydrated state is required to precisely measure the size distribution of all the nanometer-sized aggregates (preformed in liquid phase independent of a surface) occurring along the aggregation pathway of Aβ-40 and Aβ-42 peptides (see section S1 for the controls for imaging in buffer solution). To characterize the atomic-scale structure, dynamics, and energetics of the oligomers at the graphene-water interface, molecular dynamics (MD) we performed computer simulations of Aβ-40 and Aβ-42 at the graphene-water interface, using 12-mer oligomers. Ultimately, the comparative analysis of the Aβ-40 and Aβ-42 aggregation kinetics is of interest. Monitoring the changes in oligomer diameter from 0.5 to 150 hours via AFM topography images, we observed faster aggregation rates with earlier emergence of protofibrils and mature fibrils for the Aβ-42 isoform when compared to Aβ-40. This observation, which was also known from past Aβ aggregation studies (12, 27, 36), serves to verify our visual AFM results obtained at a clean graphene-water interface. However, we did not detect any prevalent Aβ-40 oligomeric aggregates (not adequate for meaningful statistical analysis) remaining after ~75 hours of incubation, whereas a stable and quantifiable population of Aβ-42 oligomeric aggregates with a diameter range between ~7 and 9 nm was present even after the formation of mature fibrils (~90 hours from incubation). One important observation during the later stages of aggregation was the topological differences between the Aβ-40 and Aβ-42 mature fibrillar networks. The Aβ-40 fibrils appeared as a sparse network with no sign of alignment, whereas in the case of the Aβ-42 peptides incubated for the same time period (150 hours), the mature fibrils were longer, more densely packed, and aligned. The alignment effect for Aβ-42 fibrils was also observed on other surfaces (glass and mica) as part of control measurements (provided in fig. S7) in addition to epitaxial graphene, which highlights that the fibril alignment is not influenced by the underlying graphene surface but is due to the Aβ-42 fibril structure. This hierarchical assembly of the fibrils may be a useful physical property for engineering functional bionanomaterials because the elongated fibrils with high aspect ratio remain stable under ambient conditions.
RESULTS
Figure 1A shows structures previously derived from nuclear magnetic resonance (NMR) of Aβ-40 monomer [Protein Data Bank (PDB) identifier: 2LFM (37)] and Aβ-42 monomer [PDB identifier: 1Z0Q (9)] in solution. The two isoforms differ by the length of the peptide sequence, Aβ-42 having two additional amino acid residues (Iso41 and Ala42) compared to Aβ-40, which results in the observed faster aggregation of Aβ-42 (38). The Aβ-40 and Aβ-42 solutions were prepared in PBS buffer solution (pH 7.4), and for each AFM imaging experiment, 10 μl of the amyloid solution was drop-cast on atomically clean graphene (see Materials and Methods for details on preparation and deposition of Aβ-40 and Aβ-42 and cleaning protocols for graphene). Five minutes after deposition of the amyloid solution, the graphene surface was flushed with 5 ml of pure water to remove excess buffer solution and prevent any unbound peptides in solution from adsorbing on either the surface or the AFM tip (see Materials and Methods for details of AFM imaging in the closed liquid cell). Figure 1B shows an AFM image recorded after depositing the Aβ-40 peptide solution (incubated for 0.5 hours) on epitaxial graphene and imaged in pure water. The AFM height image shows the presence of single particles with mixed size distribution. To determine the diameter of the individual particles, we extract the cross-sectional profile across the particles, as shown in Fig. 1C. From the height profile, we observe nanoscopic variations in height in the direction normal to the graphene surface for different particles (cross-sectional profile marked by white lines in Fig. 1B). The observed width of the particles from the raw AFM data is a convolution between the AFM tip and spherical particle radius and is larger than the true width of the particle. However, the measured height does not depend on the geometry of the AFM tip, and as the height equals the diameter of spherical particles, it is then possible to estimate the diameter of the particles such as amyloid oligomers (27) and of high–aspect ratio cylindrical objects such as amyloid fibrils (39). On the basis of similar height profile measurements extracted along hundreds of single particles previously attributed as amyloid oligomers (27, 36, 40), the smallest particle (assuming a spherical shape) we have been able to detect in the current study for the Aβ-40 isoform has a diameter of ~1.65 nm, comparable to previous AFM reports of Aβ-40 peptides (28). To estimate the number of Aβ monomers in the particles measured in our study, we rely on the method proposed by Erickson (41) to convert measured aggregate volume to molecular weight by assuming a spherical shape for the single Aβ particles. On the basis of this assumption, we estimate that the smallest Aβ-40 particle of a mean diameter of 1.9 ± 0.25 nm corresponds to a molecular weight of ~3.0 kDa, which roughly corresponds to a monomer. We apply the same conversion protocol for estimating the molecular weight of Aβ-42 particles measured through AFM.
Fig. 1. Imaging Aβ-40 and Aβ-42 peptides during early stages of aggregation.
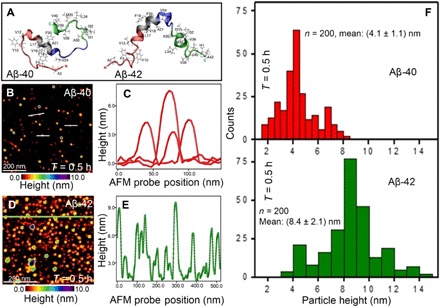
(A) Partially folded helical NMR structures of Aβ-40 [Protein Data Bank identifier: 2LFM (37)] and Aβ-42 [Protein Data Bank identifier: 1Z0Q (9)] in aqueous solution. Specific regions on both peptides are colored as red for N terminus (residues 1 to 16), gray for central hydrophobic cluster (17 to 21), blue for turn (22 to 29), and green for C terminus (30 to 42). All hydrophobic side chains are represented as gray sticks. (B) High-resolution AFM topographic image of sparsely distributed small Aβ-40 oligomers adsorbed on graphene. Spherical particles of various diameters are visible from the color-coded AFM image. (C) Cross-sectional height profile extracted along a few single particles [indicated by white lines in (B)] showing the height differences of the spatially well-resolved particles. (D) AFM image of densely distributed Aβ-42 oligomers adsorbed on graphene. (E) Cross-sectional height analysis of the densely adsorbed Aβ-42 oligomers, along the green line indicated in the AFM image shown in (D). On the basis of height traces measured on 200 individual Aβ-40 and Aβ-42 oligomers, we extract a mean particle diameter of (4.1 ± 1.1) nm for Aβ-40 [statistical distribution shown in (F), top red bar histogram] and a mean diameter of (8.4 ± 2.1) nm for Aβ-42 [statistical distribution shown in (F), bottom green bar histogram]. The AFM data (B and D) and the statistical data (F) were recorded after incubating the amyloid solution (Aβ-40 and Aβ-42) for 30 min under standard laboratory conditions at (24 ± 1)°C.
Next, we compared the size distribution and morphology of Aβ-42 aggregates with identical concentration (5 μM), buffer conditions (PBS) (pH 7.4), incubation time (0.5 hours), and deposition conditions (10-μl volume of Aβ-42 solution, 5-min deposition time, followed by rinsing the surface with 5 ml of pure water) as used for imaging Aβ-40. Figure 1D is an AFM topographic image of particles of Aβ-42 classified as oligomers from previous studies (24, 25). The Aβ-42 particles are present in varying diameters as shown in the cross-sectional profile in Fig. 1E (extracted along the line indicated in Fig. 1D) and are visibly larger and more densely populated for Aβ-42 than for the Aβ-40 oligomers (Fig. 1B) incubated for the same time period (0.5 hours). The smallest oligomer we have been able to measure with an AFM for the Aβ-42 isoform had a mean diameter of 3.7 ± 0.2 nm, which corresponds to a molecular weight of ~25.0 kDa that roughly corresponds to a hexamer. On the basis of height profile analysis conducted on ~200 individual Aβ-40 and Aβ-42 oligomers, we extract a mean diameter of (4.1 ± 1.1) nm for Aβ-40 (Fig. 1F, top red bar histogram) and (8.4 ± 2.1) nm for Aβ-42 (Fig. 1F, bottom green bar histogram). The qualitative (AFM topography images) and quantitative (diameter distribution from height profile) data from our analysis are consistent with previous observations that Aβ-42 tends to aggregate faster than Aβ-40 peptides (3, 24, 27, 36, 38, 42).
To justify the measurements in water instead of in PBS buffer, we compared the size distribution of Aβ-40 and Aβ-42 oligomers in both PBS and pure water. Comparing the statistical distributions of particle diameter (inferred from height trace analysis) for single Aβ-40 and Aβ-42 oligomers (same incubation time of 1 hour) in both PBS buffer and pure water, higher diameter values are found for particles measured in PBS buffer than in pure water (see fig. S3, A and B, for detailed statistical plots). Here, we attribute the measured increase in mean particle diameter for Aβ-40 and Aβ-42 oligomers adsorbed on graphene in PBS buffer solution to the contamination of the AFM probe in buffer salt solution, which could lead to the overestimation of the actual morphology of the oligomers thereby resulting in inflated particle size values. We confirmed this hypothesis by revealing the contamination of the AFM tip during imaging of the amyloid aggregates in PBS buffer (see fig. S2 for AFM images of tip streaking and double tip effects in PBS buffer medium). To accurately measure the diameter of oligomeric aggregates with single-particle resolution, we continued to perform AFM measurements in pure water and on atomically clean graphene. Figure 2 is a plot of the evolution of the diameter of oligomers over time. Each point in the plot is based on cross-sectional profiles extracted from the hundreds of individual oligomers at numerous incubation time intervals starting from 0.5 to 110 hours for Aβ-40 (red curve) and Aβ-42 (green curve) adsorbed at the graphene-water interface. A general increase in oligomer diameter is visible from the plot (Fig. 2) for both peptide isoforms with an overall larger oligomer diameter for Aβ-42 when compared to Aβ-40. We did not observe the widespread presence of oligomeric aggregates for the Aβ-40 species after ~80 hours of incubation time, whereas in the case of Aβ-42, oligomeric aggregates were still present abundantly even after ~110 hours of incubation time based on the AFM data analysis (Fig. 4G). This result suggests that low–molecular weight oligomers of Aβ-42 persist longer during aggregation than oligomers of Aβ-40. Computed MD structures presented later (Fig. 6) quantify further the interactions between the Aβ-42 oligomers and the underlying graphene surface. When monitoring the changes in oligomer morphology over time, we also detected the formation of fibrillar aggregates for both Aβ-40 and Aβ-42 species. Figure 3A is an AFM topograph registering the first signs of the appearance of the fibrillar aggregates along the Aβ-40 aggregation pathway after the amyloid solution was incubated for 30 hours (indicated by the black arrow in the plot in Fig. 2). These fibrillar aggregates were of varying height as shown from the cross-sectional profiles in Fig. 3B extracted along the black lines indicated in the AFM height image (Fig. 3A). These fibrillar aggregates were observed together with the oligomeric aggregates (see section S2 for AFM images acquired over other areas of the same sample) showing the presence of a mixture of fibrils and oligomeric aggregates. From AFM height profiles measured over several individual filaments as shown in Fig. 3A, we observe the diameter (inferred from the height) of these objects to vary from ~3 to 8 nm, consistent with diameter values measured with AFM for Aβ-40 fibrillar aggregates adsorbed on clean silicon (28). In the past, these fibrillar aggregates with nodular morphology occurring during the early stages of amyloid assembly have been classified as protofibrils, which are intermediates in the amyloid fibrillation pathway and precursors of mature fibrils (22, 27, 36, 40).
Fig. 2. Characterization of Aβ-40 and Aβ-42 oligomers from 0.5 to 120 hours of incubation.
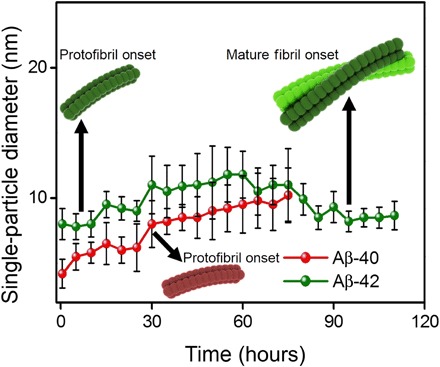
Plot of particle diameter (obtained from height profile analysis of single particles) increase over time for Aβ-40 (red curve) and Aβ-42 (green curve) oligomers (adsorbed at the graphene-water interface) as a function of time for Aβ aggregation. In the case of Aβ-40, oligomeric aggregates with quantifiable size distribution were observed in the AFM images until ~80 hours. For Aβ-42, stable oligomers were prevalently observed and detected during AFM imaging even after ~80 hours of incubation time and were also visible in the AFM images recorded even at ~110 hours of incubation time. The black arrows denote the time points when the first protofibrils were observed for Aβ-40 (~30 hours) and Aβ-42 (~8 hours) and the mature fibril observed through the AFM images for Aβ-42 (~90 hours).
Fig. 4. Morphological differences between Aβ-40 and Aβ-42 fibril networks.
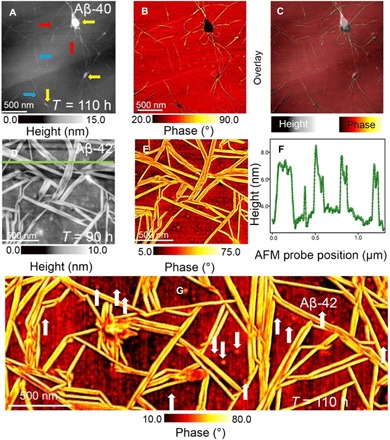
AFM image of the height (A) and phase (B) information of sparsely deposited mature Aβ-40 fibrils imaged after the amyloid solution was incubated for 110 hours. The fibrils appear as both interconnected curved [indicated by red arrows in (A)] and elongated individual [indicated by blue arrows in (A)] forms. (C) Overlay of height (A) and phase (B) data. The yellows arrows in (A) indicate the first occurrence of clusters to be present within the sparsely connected Aβ-40 fibrils. (D and E) High-resolution height and phase-contrast AFM image of aligned Aβ-42 fibrils. (F) Cross-sectional height profile measured along the green line indicated in the AFM height image shown in (D). Mature Aβ-42 fibrils were first observed after the amyloid solution was incubated for 90 hours at room temperature. The arrangement of the Aβ-42 fibrils is distinctly different from the adsorption pattern displayed by Aβ-40 (A). The mature Aβ-42 fibrils appear as adjacently stacked rigid rods with kinks but no bends. (G) Large-area phase-contrast AFM image of mature Aβ-42 fibrils observed after 90 hours of incubation at room temperature. The spatially well-resolved AFM images of the mature Aβ-42 fibrils (D, E, and G) also reveal the presence of oligomeric particles (indicated by white arrows).
Fig. 6. MD simulations of Aβ-40 and Aβ-42 prefibrillar aggregates at the graphene-water interface.
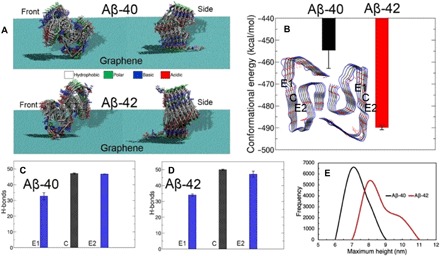
(A) Representative stable conformations of Aβ-40 and Aβ-42 dodecamers at the graphene-water interface in front and side views. The protein residues are represented as licorice and colored according to the residue types (hydrophobic, white; polar, green; basic, blue; acidic, red). (B) Calculated conformational energies (normalized per monomer) of Aβ-40 and Aβ-42 dodecamers. In-register hydrogen bonds occurring between the two monomers counted for (C) Aβ-40 and (D) Aβ-42 at each end of the dodecamers [E1 and E2; blue sites marked in inset of (B)] and between the two central monomers (C, black). (E) Distribution of maximum dodecamer heights sampled above the graphene sheet during the simulations.
Fig. 3. Imaging onset of fibrillar Aβ-40 and Aβ-42 aggregates.
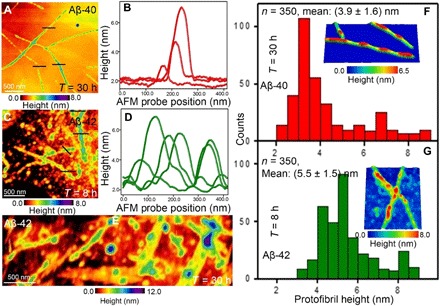
(A) AFM image showing the presence of sparsely adsorbed Aβ-40 protofibrils with variations in height visible from the color-coded height image. Protofibrils of Aβ-40 were first observed when the amyloid solution was incubated at room temperature for 30 hours. (B) Section analysis extracted along the black lines indicated in the AFM image shown in (A) show the differences in the height profiles of the Aβ-40 protofibrils. (C) AFM image showing the presence of densely distributed Aβ-42 oligomeric aggregates and protofibrillar structures. The formation of Aβ-42 protofibrils was first observed after incubating the Aβ-42 solution for 8 hours. (D) Height profile extracted along the black lines indicated in (C) over the Aβ-42 protofibrils. (E) Large-area AFM image showing the formation of flat structures, protofibrils, and the presence of oligomeric particles when Aβ-42 was incubated for 30 hours and then deposited on graphene for AFM imaging. (F) Statistical analysis of the protofibril height distribution for Aβ-40 (top red histogram) after 30 hours of amyloid solution incubation and (G) Aβ-42 (bottom green histogram) after 8 hours of incubation time at room temperature. Inset in (F) is a three-dimensional AFM image of Aβ-40 protofibrils (size, 580 nm by 300 nm), and inset in (G) is a three-dimensional AFM image of the Aβ-42 protofibrils (size, 550 nm by 650 nm).
Aβ-40 protofibril (with characteristic nodular structure) formation was first observed after 30 hours of incubation time, whereas the formation of protofibrils for Aβ-42 was detected after only 8 hours. Figure 3C is an AFM image showing the presence of oligomers together with a minor population of fibrillar Aβ-42 aggregates with varying heights as shown in Fig. 3D. This difference in speed of aggregation and resulting protofibril structures confirms that Aβ-42 isoforms aggregate faster in solution than Aβ-40. Together with the oligomeric aggregates and single protofibrils, we observed flat sheet–type structures composed of locally aligned protofibrils after ~30 hours of incubation of Aβ-42 (see Fig. 3E and section S3 for further AFM characterization of the protofibrils). Previously, the occurrence of similar laterally interacting sheet-type Aβ-42 structures was reported on graphite resolved using AFM (30). To quantify the height differences for the first observed Aβ-40 and Aβ-42 protofibrils, which appear at different incubation time intervals, we performed statistical analysis (Fig. 3F) of the heights of ~350 individual protofibrils for each species. On the basis of the height distribution, we calculate mean protofibril heights of (3.9 ± 1.6) nm and (5.5 ± 1.5) nm for Aβ-40 (Fig. 3F, top red histogram) and Aβ-42 (Fig. 3F, bottom green histogram), respectively. The next change in morphology we observed during amyloid aggregation is the formation of mature fibrils with their elongated structure. The atomic structure of mature Aβ-40 (10, 43) and Aβ-42 (44, 45) fibrils has been known from cryo–electron microscopy (43, 44) and solid-state NMR (45). However, the differences in the physical characteristics such as fibril height and length of the mature Aβ-40 and Aβ-42 fibrils occurring at various incubation time intervals, which can be influenced by environmental factors (46), remain to be fully cataloged under ambient conditions.
Under the conditions used in this study, mature fibrils aggregated in solution first appeared for Aβ-40 after 110 hours and at about 90 hours of incubation time for Aβ-42. Figure 4A is a large-area AFM height image of the mature Aβ-40 fibrils that appear as curved (indicated with red arrows) and elongated individual fibrils (indicated with blue arrows). In addition to the single fibrils with a mean diameter of (8.5 ± 0.5) nm (fibril diameter inferred from height trace assuming cylindrical morphology for fibrils; see section S4 for mature Aβ-40 fibril height statistics), we also observe, from the topographic and the simultaneously acquired phase-contrast AFM image (Fig. 4B), the presence of junctions (indicated with yellow arrows in Fig. 4A) from which individual fibrils branch out. We did not detect any prevalent presence of oligomeric aggregates together with the mature fibrils of Aβ-40 as evidenced by the height, phase, and overlay image (Fig. 4C). Next, we resolve the occurrence of mature Aβ-42 fibrils first observed after 90 hours of incubation as shown in the high-resolution AFM height (Fig. 4D) and phase-contrast image (Fig. 4E). The mature fibril topology observed for Aβ-42 differs notably from the previously observed topology of mature Aβ-40 fibrils (Fig. 3A). Aβ-42 mature fibrils are closely packed, directionally aligned, and appear as rigid cylindrical structures very different from the curved and isolated Aβ-40 mature fibrils. This observation is also confirmed by the cross-sectional profile analysis (Fig. 4F). Specifically, the green line indicated in Fig. 4D reveals the tightly packed lateral profile of the mature Aβ-42 fibrils. On the basis of sectional analysis along ~200 individual mature fibrils, we calculate the mean mature Aβ-42 fibril diameter to be (9.6 ± 0.7) nm (see fig. S6A for mature Aβ-42 fibril height statistics).
Closer inspection of the height data and the phase-contrast AFM image reveals the existence of spherical oligomeric aggregates together with the mature fibrils at this stage of Aβ-42 aggregation. The prevalent population of oligomeric aggregates is distinguishable in the phase-contrast image (Fig. 4G). In addition to providing qualitative evidence for the existence of oligomeric aggregates toward the saturation phase of amyloid assembly [confirming previous reports from AFM (26) and NMR (47) studies], we also quantify the size distribution of these oligomeric aggregates based on the height profile analysis conducted on ~100 individual oligomeric aggregates. We characterized particles present after the onset of mature fibrils (90 hours) up until the point where the oligomers were no longer directly detected by the AFM (110 hours). Figure 5A shows the distribution of oligomeric aggregates diameter occurring at 90, 95, 100, 105, and 110 hours of incubation. These data identify a narrow diameter distribution of aggregates in the size range of ~7 to 9 nm (corresponding to a molecular weight of 221 ± 80 kDa that roughly corresponds to a spherical 50-mer) that tend to coexist with mature fibrils for Aβ-42. Densely packed fibrils appeared during the final stages of Aβ-40 and Aβ-42 fibrillogenesis. Figure 5B is a large-area AFM height image revealing the nanoscale topology of the assembly of mature Aβ-40 fibrils at the graphene-water interface when the amyloid solution was incubated for 150 hours. The mature Aβ-40 fibrillar aggregates form with no directional alignment as can be seen from both the height and the corresponding phase-contrast image (Fig. 5C). On the basis of the AFM data obtained from the onset of the mature fibrils (Fig. 4A) until the final aggregated state (Fig. 5B; note that the closely packed fibril topology does not undergo drastic change beyond 150 hours of incubation), we observe the formation of clusters composed of bundled fibrils. These clusters are, in turn, connected by a small population of sparsely distributed elongated fibrils with a mean height of (8.8 ± 1.2) nm. The next distinct morphological change along the Aβ-42 aggregation pathway was observed after ~130 hours of incubation, which is earlier than the appearance of the mature Aβ-40 fibrils at 110 hours. Figure 5D is a large-area height image of the mature Aβ-42 fibrils after an incubation time of 150 hours. The phase-contrast image (Fig. 5E) reveals intriguing details of the dense fibril morphology. The Aβ-42 fibrils were observed to be aligned when the amyloid solution was incubated for 110 hours (Fig. 4G). These aligned fibrillar structures persisted for longer incubation time up until ~250 hours with no drastic changes in fibril morphology, suggesting that the final stages of the aggregation pathway for the Aβ-42 fibrils is already reached after approximately 130 hours. Figure 5 (F and G) is the height and phase-contrast image acquired on one such aligned Aβ-42 fibrillar region after 150 hours of incubation.
Fig. 5. Final stages of Aβ-40 and Aβ-42 aggregation.
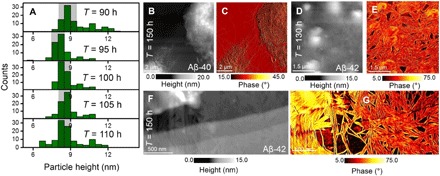
(A) Statistical analysis of the diameter distribution (based on height profile extracted on each Aβ-42) of the oligomers present at the later stages of Aβ-42 aggregation when the amyloid solution was incubated at 90, 95, 100, 105, and 110 hours. The gray shaded regions in each plot highlight the presence of oligomeric particles of diameter range from ~7 to 9 nm at longest incubation times. AFM height (B) and phase-contrast (C) image of mature Aβ-40 fibril morphology (after 150 hours of incubation) showing a sparse network. The morphology of the cluster with fibrils is better revealed in the phase image (C). Height (D) and phase (E) image of Aβ-42 mature fibrils imaged after incubating the amyloid solution for 150 hours. Mature Aβ-42 fibrils appeared aligned, which contrasts with the topology of the Aβ-40 mature fibrils incubated for the same time period of 150 hours (B). Spatially magnified height (F) and phase (G) images of Aβ-42 fibrillar networks (after incubating the amyloid solution for 180 hours) showing the significant alignment of the mature fibrils.
Fibrils from Aβ-42 remain notably different from the fibrillar aggregate topology of Aβ-40 species incubated for the same time period (Fig. 5B). The high-resolution images further confirm the alignment of the fibrils with a mean height of (9.5 ± 1.1) nm that is slightly larger than the mean height measured for the mature Aβ-40 fibrils. To test whether this alignment effect occurs because of stronger interfibrillar interactions or graphene-mediated assembly, we deposited 10 μl of Aβ-42 peptide on a clean glass slide (see Materials and Methods for the cleaning procedure and verification) using the same deposition and imaging protocol used for Aβ-42 adsorption studies on graphene and imaged in water and PBS buffer medium. The AFM images recorded for Aβ-42 species after 150 hours of incubation at the glass-water and glass-PBS interface showed very similar network morphology as seen at the graphene-water interface (see section S5). The mature Aβ-42 fibrils were also observed to exhibit alignment on the glass slide when imaged in buffer solution and after rinsing and imaging the surface with water. The observed fibrillar alignment on glass indicates that the hydrophilicity and roughness of the imaging surface are not the dominating factors responsible for the long-range ordering of the Aβ-42 fibrils. The observation of fibrillar alignment for the mature Aβ-42 fibrils and not for identically prepared Aβ-40 fibrillar aggregates may be due to the extra amino acid residues present only for the Aβ-42 peptides (8, 27) that could promote interfibril interactions. It has recently been shown that Ala42, absent in Aβ-40, forms a salt bridge with Lys28, (45) thereby buffering the net charge present on the surface of Aβ-42 fibrils (48). Emerging information on the atomic structure of Aβ-42 fibrils (48) coupled with our AFM observations of, on average, longer Aβ-42 fibrils [mean Aβ-42 mature fibril length: (1380 ± 320) nm versus mean Aβ-40 mature fibril length: (950 ± 240) nm; see fig. S6B for statistical analysis of mature fibril length) shows the large impact of the two extra residues in promoting long-range fibril ordering within the Aβ-42 monolayer. Overall, the mean length and height measured in this study for single Aβ-42 and Aβ-40 fibrils is comparable to previous AFM (24, 49) and electron microscopy (10, 43, 44) studies.
To study the stability of the oligomers and gain deeper insights into the amyloid-graphene interface, we performed atomistic MD computer simulations of a preformed dodecamer (12-mer, with a profibrillar morphology) of Aβ-40 and Aβ-42 on the graphene-water interface. Aβ-42 fibrils adopt a twofold symmetry (50) with two molecules in each layer, whereas the Aβ-40 fibrils can adopt both twofold (51) and threefold (52) symmetries. Recently, MD simulations (53) have been conducted to compare the free energy aggregation landscape and oligomerization map of Aβ-40 and Aβ-42. In the current study, we have mapped the nascent stages of amyloid (Aβ-40 and Aβ-42)–graphene interaction in the presence of water molecules. Earlier studies have highlighted that Aβ-42 dodecamers are one of the primary toxic species in AD (54–56). More recently, it was shown that dodecamers seed fibril formation only in the case of Aβ-42 but not of Aβ-40 (57) (this study observed tetramers as the largest Aβ-40 oligomers). To probe the structure, dynamics, and energetics of dodecamers at the graphene-water interface, we built a 12-mer (two symmetric folds of hexamers packed laterally and intertwined) Aβ-42 oligomer model using a recent cryo–electron microscopy report on the atomic structure of Aβ-42 fibrils (44) (PDB code: 5OQV; see fig. S8A) having an LS-shaped fold. The LS-shaped fold features an L-shaped N-terminal region and an S-shaped C-terminal region in each monomer (Fig. 6B, inset, and fig. S8A), with Asp1 forming a stabilizing salt bridge to Lys28. The reference Aβ-40 oligomer model was generated by deleting the last two residues in the Aβ-42 fibril atomic structure while maintaining the same LS-shaped fold. Both of the preformed oligomers were then modeled in three different orientations as sketched in fig. S8D. The starting and final structures (after 0.1 μs each of MD) are shown in fig. S8E. Further details on model building, simulation protocols, and analyses are given in section S6. The Aβ-40 and Aβ-42 12-mer structures are predicted to retain their conformations and are stable at the graphene-water interface. The fraction of native contacts over time confirms the overall stabilities of these alloforms in the three orientations and reflects that convergence is reached after the first 50 ns of free dynamics (fig. S9A). Hence, we used the last 50 ns for analysis.
To identify the preferred orientation of the dodecamers on the graphene surface, we calculated the dodecamer-graphene binding energies. From fig. S9B, we find that the computed binding energies (ΔEbinding) show an orientational preference for both Aβ-40 and Aβ-42 corresponding to a propensity of the dodecamers along the graphene sheet with the two folds lying adjacent to each other, which is conducive to fibril elongation. The decomposition of the ΔEbinding values (fig. S9B) shows that the differences originate from polar solvation binding energies. ΔEpolar is negative for the preferred fibril-seeding orientation but positive for the two other planes, in both Aβ-40 and Aβ-42, indicating that the oligomer-graphene interfacial water plays a crucial role in stabilizing this adsorption mode. Encouraged by the above findings, we extended the simulations with this preferred orientation (marked as III) out to 0.5 μs. The analyses (unless stated otherwise) are based on the last 200 ns of free dynamics (fig. S9 shows the timeline of fraction of native contacts). Aβ-42 and Aβ-40 adopt very similar adsorption modes with an almost identical number of contacts to graphene [to within just four atomic contacts (see fig. S9D) based on the maximum sum of van der Waals radii between two atoms]. The bottom inset in fig. S9D shows that residue Tyr10 in both Aβ-40 and Aβ-42 dodecamers samples stable contacts with graphene with no participation from the two additional C-terminal residues in Aβ-42, confirming that residues Iso41 and Ala42 retain their interfold contacts throughout.
Figure 6A shows representative stable conformations (as deduced from comparisons over a range of binding orientations; see fig. S9) of Aβ-40 and Aβ-42 12-mer structures at the graphene-water interface in front and side views. We may roughly compare calculated conformational energies (Fig. 6B) by normalizing per monomer, which predict that Aβ-42 dodecamers are more stable (by ~35 kcal/mol) than Aβ-40 when aligned in the orientation of fibril elongation. This computed preference is consistent with the faster aggregation of Aβ-42 observed in our AFM study and in previous investigations of Aβ-42 aggregation, coupled with the persistence of oligomers for Aβ-42. The major contribution to overall conformational energy comes from the polar solvation free energy of the dodecamer (fig. S9E), which is only slightly more favorable for Aβ-42 than for Aβ-40. The solvent contribution is coupled with a considerably more unfavorable (positive) Coulomb’s electrostatic energy (~19 kcal/mol) for Aβ-40, indicating that intramolecular charge-charge repulsions contribute significantly to the overall observed instability for Aβ-40. A potentially interesting finding from our simulations is the apparent difference in the occurrence of “prefibrillar” in-register hydrogen bonds (H-bonds) between the two ends of the dodecamer for both Aβ-40 and Aβ-42 at the graphene-water interface (Fig. 6, C and D, and table S1, and see also section S6). Some previous experiments have reported that Aβ fibril growth is unidirectional (58, 59), while others have highlighted bidirectional growth (60, 61). Unidirectional fibril growth has been attributed to differences in H-bonding between the two fibril ends exposed to the solvent (one end being less fluctuating and so more closed and more stable than the other) for both Aβ-40 and Aβ-42, from previous MD simulation studies (62). However, it is not known which end actually promotes the addition of monomers on fibrils, although simulations have shown that the closed ends may extend faster than the open ends (63). From our analysis of the dimers at the two ends (designated as E1 and E2) exposed to water and the bulk central dimers (denoted as C) of dodecamer, we find that the number of in-register H-bonds at one end (E1) is significantly less than that of the other end (E2) for both Aβ-40 and Aβ-42, identifying a potential to undergo unidirectional growth. However, a difference of 11% (see table S1 and section S6) is recorded for the strongest (≥80%) H-bonds between E2 and E1 for Aβ-42, while a significantly larger difference of 19% is recorded for Aβ-40, implying that Aβ-40 dodecamers are more open (almost twice more than for Aβ-42) on the fluctuating end. Monomer addition on the E1 end may proceed in a more ordered fashion for Aβ-42 than for Aβ-40, and because of the smaller difference (by a factor of 2) between the two ends of Aβ-42 compared with those in Aβ-40, this modeling prediction could be tested in future time-resolved AFM experiments.
As previously highlighted, the recently reported salt bridge between the amino side chain of Lys28 and the C terminus of Ala42 in the Aβ-42 fibril structure plays a role in stabilizing the S-shaped fibril fold (45). The native structure of Aβ-42 having the LS-shaped fold used in this study does not have a full Lys28-Ala42 salt bridge. To identify interactions that are specific to Ala42 in “fibril-like” dodecamers of Aβ-42, but not Aβ-40, we computed intra- and interchain residue contacts (see section S6 and fig. S10). Figure S10A depicts the chain organization in a typical LS-shaped dodecamer fold of Aβ-42 marked A through L. The chain-wise heavy-atom contact frequencies of residues within a distance of 0.5 nm reveal that Ala42 makes frequent (>50%) intrachain contacts with Lys28 (marked by black circles on the right half of the map) and is the only intramonomer contact that Ala42 makes in the Aβ-42 dodecamer. Ala42 also undergoes interchain contacts with Lys28 along the fibril axis (marked by red circles). Both of these intra- and interchain contacts might play a role in stabilizing Aβ-42 involving Ala42, which is absent in Aβ-40. Figure S10C shows a representative structure of the dodecamer where the side chain NH3+ in Lys28 and the terminal COO− in Ala42 stay in close proximity. The physical relevance of the Lys28-Ala42 contacts for the LS-fold was further assessed by computing distribution of distances between side-chain amino N of Lys28 and backbone carboxylate C of Ala42 for each chain in the dodecamer (fig. S10D). These contacts peak at 0.5 nm for most of the chains, indicating that strong contact between Lys28 and Ala42 (missing in Aβ-40) may render Aβ-42 more stable over Aβ-40 dodecamers and might play an additional role in ensuring strong alignment of Aβ-42 fibrils as observed from our AFM images. Last, the computed distribution of maximum dodecamer heights on the top of graphene from our simulations shows a range of ~7 to 11 nm for Aβ-42 (Fig. 6E, red curve) with a peak at ~8 nm for the modeled nonspherical, layered dodecamer assemblies. The overall height values obtained for Aβ-42 dodecamer from simulations is comparable to the experimentally measured mean particle height values of (5.8 ± 1.0) nm (see fig. S3B, top green statistical plot), which corresponds to a molecular weight of ~55 kDa.
DISCUSSION
In this study, we have captured the aggregation pathway of Aβ-40 and Aβ-42 with sub–2-nm spatial resolution without the need for fluorescent labeling or metal staining. The atomically clean graphene-water interface is identified and demonstrated to be an artifact-free imaging platform for monitoring the transition of Aβ-40 and Aβ-42 peptides aggregated in solution from soluble to insoluble aggregates. The presence of clean water throughout the imaging studies ensures that the amyloids are maintained in a hydrated state and that the AFM tip apex and graphene surface remain uncontaminated. Crucially, the switch from buffer solution to pure water medium is conducted after depositing the amyloids from buffer medium and allowing the amyloid aggregates to settle on the surface, thereby ensuring that the amyloid aggregate assembly is not influenced by the liquid exchange. At the graphene-water interface, the Aβ-42 peptides were verified to aggregate faster than Aβ-40 at all stages of assembly, as evidenced from the larger Aβ-42 oligomer size evolution when compared to oligomers of Aβ-40 incubated for identical time periods together with the appearance of protofibrils much earlier during the aggregation pathway of Aβ-42 (~8 hours) when compared to Aβ-40 (~30 hours). The height and phase-contrast AFM images confirm the continued presence of oligomeric aggregates even after the onset of mature fibrils with a narrow diameter distribution of ~7 to 9 nm for the Aβ-42 species, which could be potential targets for therapeutic intervention. The qualitative and quantitative data obtained from our work on these oligomers should contribute to further structure determination and to investigate their cytotoxic nature as it is known that not all oligomers are implicated in cell death (4). Next, we observed a prominent difference in the topology of the Aβ-40 and Aβ-42 mature fibril networks. Aβ-42 fibrils were aligned over micrometer length scales and appear elongated with minimal crisscrossing of neighboring fibrils, whereas the Aβ-40 fibrils incubated for identical time periods form random networks with shorter fibril lengths. The spontaneous alignment of the Aβ-42 fibrils obtained without the need for external stimuli (e.g., light or electric field) could potentially be exploited toward the development of amyloid-based nanostructures. Comparison of the measured and computed height profiles from our MD simulations suggests that the most populated aggregate of the persistent oligomers identified by AFM might form monolayers of oligomers with the designated LS-shaped fold, which could further seed fibril elongation as identified from a previous study (58). Future MD simulations of multi-oligomer assembly could test this hypothesis by predicting the three-dimensional structure of the extended protein films formed at the interface. Our study on the role of encompassing liquid medium and surface effects on the accurate determination of amyloid aggregate size demonstrates that the correct balance of metrological precision and biological relevance is required for the characterization of amyloid aggregates implicated in the pathology of neurodegenerative diseases. We anticipate that the findings reported in this study can trigger future experiments for quantifying the β sheet content of the amyloid aggregates at the graphene-water interface, which can be addressed through high-speed AFM in conjunction with circular dichroism spectroscopy (64).
MATERIALS AND METHODS
Preparation of Aβ solution
Unlabeled lyophilized peptide samples were purchased from Abcam (Cambridge, UK) for the peptides. To obtain monomeric peptide solutions, we dissolved the peptides in high pH solutions as described similarly (65). Briefly, peptides (0.5 mg/ml) were dissolved in a 10% ammonium hydroxide solution. The solution was agitated at room temperature for at least 20 min and distributed in 0.5-ml Eppendorf protein low-bind tubes. Samples were lyophilized and stored at −80°C. For each experiment, one aliquot was dissolved in 60 mM NaOH by shaking at room temperature for 20 min, aiming for a peptide concentration of about 100 μM. The final concentration was determined with absorption spectroscopy (NanoDrop ND 1000 spectrometer) at 280 nm using an absorption coefficient of 1490 M−1 cm−1. Last, PBS buffer [10 mM phosphate buffer, 2.7 mM KCl, and 137 mM NaCl (pH 7.4) from Sigma-Aldrich GmbH, Steinheim Germany] was added to yield a final concentration of 5 μM and obtain a neutral pH value to initiate the aggregation process.
Procedure for cleaning graphene
Epitaxially grown single-layer graphene was purchased from Graphene Supermarket. Before deposition of the amyloid peptides from PBS buffer aqueous solution, the graphene samples were immersed in acetone for ~15 min, followed by rinsing in isopropyl alcohol, and then dried with compressed N2 gas. Next, the sample was annealed for ~30 min at ~50°C. As a final step before the deposition of the amyloid solution, the graphene surface was subjected to electrostatic force cleaning (66) with fine fiber cloth to remove ambient hydrocarbon contaminants before placing the graphene sample in the liquid cell AFM sample holder. See section S1 for details on the characterization of as-received graphene and analysis of graphene sample after the cleaning protocol mentioned above.
AFM measurements in aqueous medium
AFM measurements were performed using a JPK Nanowizard II AFM and Multimode 8 AFM equipped with a flow cell under standard laboratory conditions without temperature or environmental control. For the AFM probe, a Pyrex-Nitride AFM probe (triangular cantilever; resonant frequency, 67 kHz; force constant, 0.32 N/m; tip apex radius, ~10 nm; NanoWorld) was used in a tapping mode. The detector side of the AFM cantilever was coated with a 70-nm-thick gold film, which enhances the reflectance of the laser beam, which is a crucial property when the cantilever is immersed fully in an aqueous medium. Before inserting the AFM probe in the holder, the cantilever was cleaned by rinsing in acetone for ~30 s followed by rinsing in isopropanol for ~2 min followed by blow drying with N2 compressed gas. After mounting the AFM probe in the tip holder, 10 μl of the amyloid solution incubated at room temperature was drop-cast on the graphene surface, and the flow cell was closed. The monomer concentration of both Aβ-40 and Aβ-42 solution was kept fixed at 5 μM in PBS buffer solution (pH 7.4), and the volume of Aβ-40 and Aβ-42 solution deposited on graphene was also maintained at 10 μl for all the experiments. Five minutes after deposition of the amyloids from solution phase on graphene, the graphene sample surface was flushed with 5 ml of pure water [CAS (chemical abstract service) no: 7732-18-5, Sigma-Aldrich; no buffer and no salts, this product has also been tested for the absence of nucleases and proteases] in which the AFM tip was tuned and engaged in a tapping mode to scan the amyloids adsorbed on graphene. This deposition protocol remained fixed for AFM-based studies on the adsorption of Aβ-40 and Aβ-42. The values for the SD reported for the height analysis of oligomeric and fibrillar Aβ nanostructures were calculated from measurements performed with 20 AFM tips from the same batch purchased from NanoWorld. A key to obtaining high-resolution phase-contrast AFM images on Aβ-40 and Aβ-42 fibrils that have a propensity to adsorb to any surface was to reduce the drive amplitude of the AFM tip, as the free-amplitude goes lower than the amplitude setpoint, and then, the amplitude setpoint value was adjusted consistently for stable imaging of the aligned fibrils. This adjustment is important to overcome problems from Aβ fibrils adsorbing on the tip. The height and phase-contrast AFM images reported in this work were not subjected to any filtering but only subjected to first-order image flattening using Gwyddion software (version 2.51).
Supplementary Material
Acknowledgments
Funding: P.N.N. and M.M. thank the Adolphe Merkle Foundation for funding. D.T. acknowledges support by Science Foundation Ireland (SFI) under award numbers 15/CDA/3491 and 12/RC/2275 (SSPC) and through the “Missing Link” EU Joint Programme–Neurodegenerative Disease Research (JPND) project and acknowledges computing resources at the SFI/Higher Education Authority Irish Center for High-End Computing (ICHEC). M.M. acknowledges funding from the SNF (grant no. 200021-169304). Author contributions: P.N.N. conceived and performed the scanning probe microscopy studies. J.L. synthesized the amyloid solutions. S.B., G.H., L.X., and D.T. conducted the MD study and analyzed the simulation results. M.M. developed the explanation of the observed AFM results. P.N.N. wrote the manuscript with inputs from S.B., D.T., and M.M. All authors read, corrected, and approved the manuscript. Competing interests: The authors declare that they have no competing interests. Data and materials availability: All data needed to evaluate the conclusions in the paper are present in the paper and/or the Supplementary Materials. Additional data related to this paper may be requested from the authors.
SUPPLEMENTARY MATERIALS
Supplementary material for this article is available at http://advances.sciencemag.org/cgi/content/full/6/15/eaaz6014/DC1
REFERENCES AND NOTES
- 1.Carrell R. W., Lomas D. A., Conformational disease. Lancet 350, 134–138 (1997). [DOI] [PubMed] [Google Scholar]
- 2.Shankar G. M., Bloodgood B. L., Townsend M., Walsh D. M., Selkoe D. J., Sabatini B. L., Natural oligomers of the alzheimer amyloid-β protein induce reversible synapse loss by modulating an NMDA-type glutamate receptor-dependent signaling pathway. J. Neurosci. 27, 2866–2875 (2007). [DOI] [PMC free article] [PubMed] [Google Scholar]
- 3.Avidan-Shpalter C., Gazit E., The early stages of amyloid formation: Biophysical and structural characterization of human calcitonin pre-fibrillar assemblies. Amyloid 13, 216–225 (2006). [DOI] [PubMed] [Google Scholar]
- 4.Shankar G. M., Li S., Mehta T. H., Garcia-Munoz A., Shepardson N. E., Smith I., Brett F. M., Farrell M. A., Rowan M. J., Lemere C. A., Regan C. M., Walsh D. M., Sabatini B. L., Selkoe D. J., Amyloid-β protein dimers isolated directly from Alzheimer’s brains impair synaptic plasticity and memory. Nat. Med. 14, 837–842 (2008). [DOI] [PMC free article] [PubMed] [Google Scholar]
- 5.Yusko E. C., Prangkio P., Sept D., Rollings R. C., Li J., Mayer M., Single-Particle Characterization of Aβ Oligomers in Solution. ACS Nano 6, 5909–5919 (2012). [DOI] [PMC free article] [PubMed] [Google Scholar]
- 6.Hardy J., Higgins G., Alzheimer's disease: The amyloid cascade hypothesis. Science 256, 184–185 (1992). [DOI] [PubMed] [Google Scholar]
- 7.Doig A. J., Del Castillo-Frias M. P., Berthoumieu O., Tarus B., Nasica-Labouze J., Sterpone F., Nguyen P. H., Hooper N. M., Faller P., Derreumaux P., Why is research on amyloid-β failing to give new drugs for alzheimer’s disease? ACS Chem. Nerosci. 8, 1435–1437 (2017). [DOI] [PubMed] [Google Scholar]
- 8.Murphy M. P., LeVine III H., Alzheimer’s disease and the β-amyloid peptide. J. Alzheimers dis. 19, 311–323 (2010). [DOI] [PMC free article] [PubMed] [Google Scholar]
- 9.Tomaselli S., Esposito V., Vangone P., van Nuland N. A. J., Bonvin A. M. J. J., Guerrini R., Tancredi T., Temussi P. A., Picone D., The α-to-β conformational transition of alzheimer's Aβ-(1–42) peptide in aqueous media is reversible: A step by step conformational analysis suggests the location of β conformation seeding. Chembiochem 7, 257–267 (2006). [DOI] [PubMed] [Google Scholar]
- 10.Schmidt M., Sachse C., Richter W., Xu C., Fändrich M., Grigorieff N., Comparison of Alzheimer Aβ(1–40) and Aβ(1–42) amyloid fibrils reveals similar protofilament structures. Proc. Natl. Acad. Sci. U.S.A. 106, 19813–19818 (2009). [DOI] [PMC free article] [PubMed] [Google Scholar]
- 11.Kuperstein I., Broersen K., Benilova I., Rozenski J., Jonckheere W., Debulpaep M., Vandersteen A., Segers-Nolten I., Van Der Werf K., Subramaniam V., Braeken D., Callewaert G., Bartic C., D’Hooge R., Martins I. C., Rousseau F., Schymkowitz J., De Strooper B., Neurotoxicity of Alzheimer's disease Aβ peptides is induced by small changes in the Aβ42 to Aβ40 ratio. EMBO J. 29, 3408–3420 (2010). [DOI] [PMC free article] [PubMed] [Google Scholar]
- 12.Pauwels K., Williams T. L., Morris K. L., Jonckheere W., Vandersteen A., Kelly G., Schymkowitz J., Rousseau F., Pastore A., Serpell L. C., Broersen K., The structural basis for increased toxicity of pathological Aβ42:Aβ40 ratios in Alzheimer's disease. J. Biol. Chem. 287, 5650–5660 (2011). [DOI] [PMC free article] [PubMed] [Google Scholar]
- 13.Cizas P., Budvytyte R., Morkuniene R., Moldovan R., Broccio M., Lösche M., Niaura G., Valincius G., Borutaite V., Size-dependent neurotoxicity of β-amyloid oligomers. Arch. Biochem. Biophys. 496, 84–92 (2010). [DOI] [PMC free article] [PubMed] [Google Scholar]
- 14.Pujol-Pina R., Vilaprinyó-Pascual S., Mazzucato R., Arcella A., Vilaseca M., Orozco M., Carulla N., SDS-PAGE analysis of Aβ oligomers is disserving research into Alzheimer’s disease: Appealing for ESI-IM-MS. Sci. Rep. 5, 14809 (2015). [DOI] [PMC free article] [PubMed] [Google Scholar]
- 15.Patke S., Srinivasan S., Maheshwari R., Srivastava S. K., Aguilera J. J., Colón W., Kane R. S., Characterization of the oligomerization and aggregation of human serum Amyloid A. PLOS ONE 8, e64974 (2013). [DOI] [PMC free article] [PubMed] [Google Scholar]
- 16.Engel A., Müller D. J., Observing single biomolecules at work with the atomic force microscope. Nat. Struct. Biol. 7, 715–718 (2000). [DOI] [PubMed] [Google Scholar]
- 17.Müller D. J., Helenius J., Alsteens D., Dufrêne Y. F., Force probing surfaces of living cells to molecular resolution. Nat. Chem. Biol. 5, 383–390 (2009). [DOI] [PubMed] [Google Scholar]
- 18.Laskowski P. R., Pfreundschuh M., Stauffer M., Ucurum Z., Fotiadis D., Müller D. J., High-resolution imaging and multiparametric characterization of native membranes by combining confocal microscopy and an atomic force microscopy-based toolbox. ACS Nano 11, 8292–8301 (2017). [DOI] [PubMed] [Google Scholar]
- 19.Shezad K., Zhang K., Hussain M., Dong H., He C., Gong X., Xie X., Zhu J., Shen L., Surface roughness modulates diffusion and fibrillation of amyloid-β peptide. Langmuir 32, 8238–8244 (2016). [DOI] [PubMed] [Google Scholar]
- 20.Lin Y.-C., Petersson E. J., Fakhraai Z., Surface Effects Mediate Self-Assembly of Amyloid-β Peptides. ACS Nano 8, 10178–10186 (2014). [DOI] [PMC free article] [PubMed] [Google Scholar]
- 21.Moores B., Drolle E., Attwood S. J., Simons J., Leonenko Z., Effect of surfaces on amyloid fibril formation. PLOS ONE 6, e25954 (2011). [DOI] [PMC free article] [PubMed] [Google Scholar]
- 22.Dubnovitsky A., Sandberg A., Rahman M. M., Benilova I., Lendel C., Härd T., Amyloid-β protofibrils: Size, morphology and synaptotoxicity of an engineered mimic. PLOS ONE 8, e66101 (2013). [DOI] [PMC free article] [PubMed] [Google Scholar]
- 23.Li Y., Cao M., Wang Y., Alzheimer amyloid β(1−40) peptide: Interactions with cationic gemini and single-chain surfactants. J. Phys. Chem. B. 110, 18040–18045 (2006). [DOI] [PubMed] [Google Scholar]
- 24.Watanabe-Nakayama T., Ono K., Itami M., Takahashi R., Teplow D. B., Yamada M., High-speed atomic force microscopy reveals structural dynamics of amyloid β1–42 aggregates. Proc. Natl. Acad. Sci. U.S.A. 113, 5835–5840 (2016). [DOI] [PMC free article] [PubMed] [Google Scholar]
- 25.Banerjee S., Sun Z., Hayden E. Y., Teplow D. B., Lyubchenko Y. L., Nanoscale dynamics of Amyloid β-42 oligomers as revealed by high-speed atomic force microscopy. ACS Nano 11, 12202–12209 (2017). [DOI] [PMC free article] [PubMed] [Google Scholar]
- 26.Tinker-Mill C., Mayes J., Allsop D., Kolosov O. V., Ultrasonic force microscopy for nanomechanical characterization of early and late-stage amyloid-β peptide aggregation. Sci. Rep. 4, 4004 (2014). [DOI] [PMC free article] [PubMed] [Google Scholar]
- 27.Harper J. D., Wong S. S., Lieber C. M., Lansbury P. T., Observation of metastable Aβ amyloid protofibrils by atomic force microscopy. Chem. Biol. 4, 119–125 (1997). [DOI] [PubMed] [Google Scholar]
- 28.Ungureanu A.-A., Benilova I., Krylychkina O., Braeken D., De Strooper B., Van Haesendonck C., Dotti C. G., Bartic C., Amyloid beta oligomers induce neuronal elasticity changes in age-dependent manner: A force spectroscopy study on living hippocampal neurons. Sci. Rep. 6, 25841 (2016). [DOI] [PMC free article] [PubMed] [Google Scholar]
- 29.Mastrangelo I. A., Ahmed M., Sato T., Liu W., Wang C., Hough P., Smith S. O., High-resolution atomic force microscopy of soluble aβ42 oligomers. J. Mol. Biol. 358, 106–119 (2006). [DOI] [PubMed] [Google Scholar]
- 30.Kowalewski T., Holtzman D. M., In situ atomic force microscopy study of Alzheimer's beta-amyloid peptide on different substrates: New insights into mechanism of beta-sheet formation. Proc. Natl. Acad. Sci. U.S.A. 96, 3688–3693 (1999). [DOI] [PMC free article] [PubMed] [Google Scholar]
- 31.Nirmalraj P. N., Schmid H., Gotsmann B., Riel H., Nanoscale origin of defects at metal/molecule engineered interfaces. Langmuir 29, 1340–1345 (2013). [DOI] [PubMed] [Google Scholar]
- 32.Ostendorf F., Schmitz C., Hirth S., Kühnle A., Kolodziej J. J., Reichling M., Evidence for potassium carbonate crystallites on air-cleaved mica surfaces. Langmuir 25, 10764–10767 (2009). [DOI] [PubMed] [Google Scholar]
- 33.Trewby W., Livesey D., Voïtchovsky K., Buffering agents modify the hydration landscape at charged interfaces. Soft Matter 12, 2642–2651 (2016). [DOI] [PubMed] [Google Scholar]
- 34.M. Amrein, D. J. Müller, Sample preparation techniques in scanning probe microscopy. Nanobiology (1999), vol. 4, pp. 229–256.
- 35.Barinov N. A., Prokhorov V. V., Dubrovin E. V., Klinov D. V., AFM visualization at a single-molecule level of denaturated states of proteins on graphite. Colloids Surf. B Biointerfaces 146, 777–784 (2016). [DOI] [PubMed] [Google Scholar]
- 36.Pryor N. E., Moss M. A., Hestekin C. N., Unraveling the early events of amyloid-β protein (Aβ) aggregation: Techniques for the determination of Aβ aggregate size. Int. J. Mol. Sci. 13, 3038–3072 (2012). [DOI] [PMC free article] [PubMed] [Google Scholar]
- 37.Vivekanandan S., Brender J. R., Lee S. Y., Ramamoorthy A., A partially folded structure of amyloid-beta(1–40) in an aqueous environment. Biochem. Biophys. Res. Commun. 411, 312–316 (2011). [DOI] [PMC free article] [PubMed] [Google Scholar]
- 38.Yang M., Teplow D. B., Amyloid β-protein monomer folding: Free energy surfaces reveal alloform specific differences. J. Mol. Biol. 384, 450–464 (2008). [DOI] [PMC free article] [PubMed] [Google Scholar]
- 39.Adamcik J., Mezzenga R., Study of amyloid fibrils via atomic force microscopy. Curr. Opin. Colloid Interface Sci. 17, 369–376 (2012). [Google Scholar]
- 40.Serem W. K., Bett C. K., Ngunjiri J. N., Garno J. C., Studies of the growth, evolution, and self-aggregation of β-amyloid fibrils using tapping-mode atomic force microscopy. Microsc. Res. Tech. 74, 699–708 (2010). [DOI] [PubMed] [Google Scholar]
- 41.Erickson H. P., Size and shape of protein molecules at the nanometer level determined by sedimentation, gel filtration, and electron microscopy. Biol. Proced. Online 11, 32–51 (2009). [DOI] [PMC free article] [PubMed] [Google Scholar]
- 42.Shankar G. M., Walsh D. M., Alzheimer's disease: Synaptic dysfunction and Aβ. Mol. Neurodegener. 4, 48 (2009). [DOI] [PMC free article] [PubMed] [Google Scholar]
- 43.Sachse C., Fändrich M., Grigorieff N., Paired beta-sheet structure of an Abeta(1-40) amyloid fibril revealed by electron microscopy. Proc. Natl. Acad. Sci. U.S.A. 105, 7462–7466 (2008). [DOI] [PMC free article] [PubMed] [Google Scholar]
- 44.Gremer L., Schölzel D., Schenk C., Reinartz E., Labahn J., Ravelli R. B. G., Tusche M., Lopez-Iglesias C., Hoyer W., Heise H., Willbold D., Schröder G. F., Fibril structure of amyloid-β(1–42) by cryo–electron microscopy. Science 358, 116–119 (2017). [DOI] [PMC free article] [PubMed] [Google Scholar]
- 45.Xiao Y., Ma B., Elheny D. M., Parthasarathy S., Long F., Hoshi M., Nussinov R., Ishii Y., Aβ(1–42) fibril structure illuminates self-recognition and replication of amyloid in Alzheimer’s disease. Nat. Struct. Mol. Biol. 22, 499–505 (2015). [DOI] [PMC free article] [PubMed] [Google Scholar]
- 46.Qiang W., Kelley K., Tycko R., Polymorph-specific kinetics and thermodynamics of β-amyloid fibril growth. J. Am. Chem. Soc. 135, 6860–6871 (2013). [DOI] [PMC free article] [PubMed] [Google Scholar]
- 47.Ahmed M., Davis J., Aucoin D., Sato T., Ahuja S., Aimoto S., Elliott J. I., Van Nostrand W. E., Smith S. O., Structural conversion of neurotoxic amyloid-β(1–42) oligomers to fibrils. Nat. Struct. Mol. Biol. 17, 561–567 (2010). [DOI] [PMC free article] [PubMed] [Google Scholar]
- 48.Assarsson A., Hellstrand E., Cabaleiro-Lago C., Linse S., Charge dependent retardation of amyloid β aggregation by hydrophilic proteins. ACS Chem. Nerosci. 5, 266–274 (2014). [DOI] [PMC free article] [PubMed] [Google Scholar]
- 49.Smith J. F., Knowles T. P. J., Dobson C. M., MacPhee C. E., Welland M. E., Characterization of the nanoscale properties of individual amyloid fibrils. Proc. Natl. Acad. Sci. U.S.A. 103, 15806–15811 (2006). [DOI] [PMC free article] [PubMed] [Google Scholar]
- 50.Wälti M. A., Ravotti F., Arai H., Glabe C. G., Wall J. S., Böckmann A., Güntert P., Meier B. H., Riek R., Atomic-resolution structure of a disease-relevant Aβ(1–42) amyloid fibril. Proc. Natl. Acad. Sci. U.S.A. 113, E4976–E4984 (2016). [DOI] [PMC free article] [PubMed] [Google Scholar]
- 51.Paravastu A. K., Leapman R. D., Yau W.-M., Tycko R., Molecular structural basis for polymorphism in Alzheimer's β-amyloid fibrils. Proc. Natl. Acad. Sci. U.S.A. 105, 18349–18354 (2008). [DOI] [PMC free article] [PubMed] [Google Scholar]
- 52.Lu J.-X., Qiang W., Yau W.-M., Schwieters C. D., Meredith S. C., Tycko R., Molecular structure of β-amyloid fibrils in Alzheimer's disease brain tissue. Cell 154, 1257–1268 (2013). [DOI] [PMC free article] [PubMed] [Google Scholar]
- 53.Zheng W., Tsai M.-Y., Wolynes P. G., Comparing the aggregation free energy landscapes of amyloid beta(1–42) and amyloid beta(1–40). J. Am. Chem. Soc. 139, 16666–16676 (2017). [DOI] [PMC free article] [PubMed] [Google Scholar]
- 54.Gong Y., Chang L., Viola K. L., Lacor P. N., Lambert M. P., Finch C. E., Krafft G. A., Klein W. L., Alzheimer's disease-affected brain: Presence of oligomeric Aβ ligands (ADDLs) suggests a molecular basis for reversible memory loss. Proc. Natl. Acad. Sci. U.S.A. 100, 10417–10422 (2003). [DOI] [PMC free article] [PubMed] [Google Scholar]
- 55.Barghorn S., Nimmrich V., Striebinger A., Krantz C., Keller P., Janson B., Bahr M., Schmidt M., Bitner R. S., Harlan J., Barlow E., Ebert U., Hillen H., Globular amyloid β-peptide oligomer− a homogenous and stable neuropathological protein in Alzheimer's disease. J. Neurochem. 95, 834–847 (2005). [DOI] [PubMed] [Google Scholar]
- 56.Bernstein S. L., Dupuis N. F., Lazo N. D., Wyttenbach T., Condron M. M., Bitan G., Teplow D. B., Shea J.-E., Ruotolo B. T., Robinson C. V., Bowers M. T., Amyloid-β protein oligomerization and the importance of tetramers and dodecamers in the aetiology of Alzheimer's disease. Nat. Chem. 1, 326–331 (2009). [DOI] [PMC free article] [PubMed] [Google Scholar]
- 57.Economou N. J., Giammona M. J., Do T. D., Zheng X., Teplow D. B., Buratto S. K., Bowers M. T., Amyloid β-protein assembly and Alzheimer’s disease: Dodecamers of Aβ42, but not of Aβ40, seed fibril formation. J. Am. Chem. Soc. 138, 1772–1775 (2016). [DOI] [PMC free article] [PubMed] [Google Scholar]
- 58.Ban T., Hamada D., Hasegawa K., Naiki H., Goto Y., Direct observation of amyloid fibril growth monitored by thioflavin T fluorescence. J. Biol. Chem. 278, 16462–16465 (2003). [DOI] [PubMed] [Google Scholar]
- 59.Ban T., Hoshino M., Takahashi S., Hamada D., Hasegawa K., Naiki H., Goto Y., Direct observation of Aβ amyloid fibril growth and inhibition. J. Mol. Biol. 344, 757–767 (2004). [DOI] [PubMed] [Google Scholar]
- 60.Goldsbury C., Kistler J., Aebi U., Arvinte T., Cooper G. J., Watching amyloid fibrils grow by time-lapse atomic force microscopy. J. Mol. Biol. 285, 33–39 (1999). [DOI] [PubMed] [Google Scholar]
- 61.Blackley H., Sanders G. H., Davies M. C., Roberts C. J., Tendler S. J., Wilkinson M. J., In-situ atomic force microscopy study of β-amyloid fibrillization. J. Mol. Biol. 298, 833–840 (2000). [DOI] [PubMed] [Google Scholar]
- 62.Okumura H., Itoh S. G., Structural and fluctuational difference between two ends of Aβ amyloid fibril: MD simulations predict only one end has open conformations. Sci. Rep. 6, 38422 (2016). [DOI] [PMC free article] [PubMed] [Google Scholar]
- 63.Han W., Schulten K., Fibril Elongation by Aβ17–42: Kinetic network analysis of hybrid-resolution molecular dynamics simulations. J. Am. Chem. Soc. 136, 12450–12460 (2014). [DOI] [PMC free article] [PubMed] [Google Scholar]
- 64.Shibata M., Inoue K., Ikeda K., Konno M., Singh M., Kataoka C., Abe-Yoshizumi R., Kandori H., Uchihashi T., Oligomeric states of microbial rhodopsins determined by high-speed atomic force microscopy and circular dichroic spectroscopy. Sci. Rep. 8, 8262 (2018). [DOI] [PMC free article] [PubMed] [Google Scholar]
- 65.Ryan T. M., Caine J., Mertens H. D. T., Kirby N., Nigro J., Breheney K., Waddington L. J., Streltsov V. A., Curtain C., Masters C. L., Roberts B. R., Ammonium hydroxide treatment of Aβ produces an aggregate free solution suitable for biophysical and cell culture characterization. PeerJ 1, e73 (2013). [DOI] [PMC free article] [PubMed] [Google Scholar]
- 66.Choi W. J., Chung Y. J., Park S., Yang C.-S., Lee Y. K., An K.-S., Lee Y.-S., Lee J.-O., A Simple method for cleaning graphene surfaces with an electrostatic force. Adv. Mater. 26, 637–644 (2014). [DOI] [PubMed] [Google Scholar]
- 67.Lalmi B., Girard J. C., Pallecchi E., Silly M., David C., Latil S., Sirotti F., Ouerghi A., Flower-shaped domains and wrinkles in trilayer epitaxial graphene on silicon carbide. Sci. Rep. 4, 4066 (2014). [DOI] [PMC free article] [PubMed] [Google Scholar]
- 68.Ouerghi A., Silly M. G., Marangolo M., Mathieu C., Eddrief M., Picher M., Sirotti F., Moussaoui S. E., Belkhou R., Large-area and high-quality epitaxial graphene on off-axis SiC wafers. ACS Nano 6, 6075–6082 (2012). [DOI] [PubMed] [Google Scholar]
- 69.Huang H., Chen W., Chen S., Wee A. T. S., Bottom-up growth of epitaxial graphene on 6H-SiC(0001). ACS Nano 2, 2513–2518 (2008). [DOI] [PubMed] [Google Scholar]
- 70.Lee S., Toney M. F., Ko W., Randel J. C., Jung H. J., Munakata K., Lu J., Geballe T. H., Beasley M. R., Sinclair R., Manoharan H. C., Salleo A., Laser-synthesized epitaxial graphene. ACS Nano 4, 7524–7530 (2010). [DOI] [PubMed] [Google Scholar]
- 71.Robinson J., Weng X., Trumbull K., Cavalero R., Wetherington M., Frantz E., Labella M., Hughes Z., Fanton M., Snyder D., Nucleation of epitaxial graphene on SiC(0001). ACS Nano 4, 153–158 (2010). [DOI] [PubMed] [Google Scholar]
- 72.Mishra N., Boeckl J., Motta N., Iacopi F., Graphene growth on silicon carbide: A review. Phys. Status Solidi A 213, 2277–2289 (2016). [Google Scholar]
- 73.H. Huang, S. Chen, A. T. S. Wee, W. Chen, in Graphene, V. Skákalová, A. B. Kaiser, Eds. (Woodhead Publishing, 2014), pp. 3–26.
- 74.Norimatsu W., Kusunoki M., Epitaxial graphene on SiC{0001}: Advances and perspectives. Phys. Chem. Chem. Phys. 16, 3501–3511 (2014). [DOI] [PubMed] [Google Scholar]
- 75.Kayed R., Pensalfini A., Margol L., Sokolov Y., Sarsoza F., Head E., Hall J., Glabe C., Annular protofibrils are a structurally and functionally distinct type of amyloid oligomer. J. Biol. Chem. 284, 4230–4237 (2009). [DOI] [PMC free article] [PubMed] [Google Scholar]
- 76.Huang J., Rauscher S., Nawrocki G., Ran T., Feig M., de Groot B. L., Grubmüller H., MacKerell A. D. Jr., CHARMM36m: An improved force field for folded and intrinsically disordered proteins. Nat. Methods 14, 71–73 (2017). [DOI] [PMC free article] [PubMed] [Google Scholar]
- 77.Van Der Spoel D., Lindahl E., Hess B., Groenhof G., Mark A. E., Berendsen H. J. C., GROMACS: Fast, flexible, and free. J. Comput. Chem. 26, 1701–1718 (2005). [DOI] [PubMed] [Google Scholar]
- 78.Hockney R. W., The potential calculation and some applications. Methods Comput. Phys. 9, 135–211 (1970). [Google Scholar]
- 79.Hess B., Bekker H., Berendsen H. J. C., Fraaije J. G. E. M., LINCS: A linear constraint solver for molecular simulations. J. Comput. Chem. 18, 1463–1472 (1997). [Google Scholar]
- 80.Miyamoto S., Kollman P. A., Settle: An analytical version of the SHAKE and RATTLE algorithm for rigid water models. J. Comput. Chem. 13, 952–962 (1992). [Google Scholar]
- 81.Darden T., York D., Pedersen L., Particle mesh Ewald: An N· log (N) method for Ewald sums in large systems. J. Chem. Phys. 98, 10089–10092 (1993). [Google Scholar]
- 82.Bussi G., Donadio D., Parrinello M., Canonical sampling through velocity rescaling. J. Chem. Phys. 126, 014101 (2007). [DOI] [PubMed] [Google Scholar]
- 83.Parrinello M., Rahman A., Crystal structure and pair potentials: A molecular-dynamics study. Phys. Rev. Lett. 45, 1196 (1980). [Google Scholar]
- 84.Best R. B., Hummer G., Eaton W. A., Native contacts determine protein folding mechanisms in atomistic simulations. Proc. Natl. Acad. Sci. U.S.A. 110, 17874–17879 (2013). [DOI] [PMC free article] [PubMed] [Google Scholar]
- 85.Kollman P. A., Massova I., Reyes C., Kuhn B., Huo S., Chong L., Lee M., Lee T., Duan Y., Wang W., Donini O., Cieplak P., Srinivasan J., Case D. A., Cheatham T. E. III, Calculating structures and free energies of complex molecules: Combining molecular mechanics and continuum models. Acc. Chem. Res. 33, 889–897 (2000). [DOI] [PubMed] [Google Scholar]
- 86.Kumari R., Kumar R.; Open Source Drug Discovery, Lynn A., g_mmpbsa--a GROMACS tool for high-throughput MM-PBSA calculations. J. Chem. Inf. Model. 54, 1951–1962 (2014). [DOI] [PubMed] [Google Scholar]
- 87.Mercadante D., Gräter F., Daday C., CONAN: A tool to decode dynamical information from molecular interaction maps. Biophys. J. 114, 1267–1273 (2018). [DOI] [PMC free article] [PubMed] [Google Scholar]
Associated Data
This section collects any data citations, data availability statements, or supplementary materials included in this article.
Supplementary Materials
Supplementary material for this article is available at http://advances.sciencemag.org/cgi/content/full/6/15/eaaz6014/DC1