

Abstract
Summary
The sequence specific recognition of DNA by regulatory proteins typically occurs by establishing hydrogen bonds and non-bonded contacts between chemical sub-structures of nucleotides and amino acids forming the compatible interacting surfaces. The recognition process is also influenced by the physicochemical and conformational character of the target oligonucleotide motif. Although the role of these mechanisms in DNA-protein interactions is well-established, bioinformatical methods rarely address them directly, instead binding specificity is mostly assessed at nucleotide level. DNA Readout Viewer (DRV) aims to provide a novel DNA representation, facilitating in-depth view into these mechanisms by the concurrent visualization of functional groups and a diverse collection of DNA descriptors. By applying its intuitive representation concept for various DNA recognition related visualization tasks, DRV can contribute to unravelling the binding specificity factors of DNA-protein interactions.
Availability and implementation
DRV is freely available at https://drv.brc.hu.
Supplementary information
Supplementary data are available at Bioinformatics online.
1 Introduction
Understanding the regulation of gene expression by identifying the molecular criteria for specific DNA-protein interactions has long been in the focus of functional genetics studies. The sequence specific binding of proteins to target DNA is regulated by two distinct mechanisms called base (or direct) and shape (or indirect) DNA readout (Rohs et al., 2010). Base readout is predominantly depends on the pattern of hydrogen (H-) bonds between amino acid side chains and the chemically diverse surface of DNA grooves (Mukherjee et al., 2005). Shape readout involves DNA properties that influence the steric compatibility of the interacting molecular partners, like shape, flexibility or stability. A multitude of physico-chemical and conformational DNA descriptors are available (Brukner et al., 1995; Li et al., 2017; Vlahovicek et al., 2003) for the characterization of the shape readout features of DNA. Although existing software like NUCPLOT (Luscombe et al., 1997), 3D-footprint (Contreras-Moreira, 2010) and DNAproDB (Jared et al., 2019) provides different solutions for displaying the DNA-protein contact features, currently no tools are available for simultaneous and comprehensive visualization of both readout mechanisms (Supplementary Table S1).
2 Concept
In DNA Readout Viewer (DRV), the base readout features are displayed using a functional group-based DNA representation (FGDR) which provides a sub-nucleotide view of potential contact forming functional groups of the major and minor grooves (Fig. 1A and B). Alongside with the FGDR section, a positionally aligned shape readout panel is displayed, where normalized numerical values for more than 60 physico-chemical and conformational DNA descriptors (PCD) are shown as colored stripes (Fig. 1B, Supplementary Table S2). In this way, DRV displays contact related data using an intuitive format appropriate for visual identification of complex interaction patterns determining the specificity of DNA recognition events.
Fig. 1.
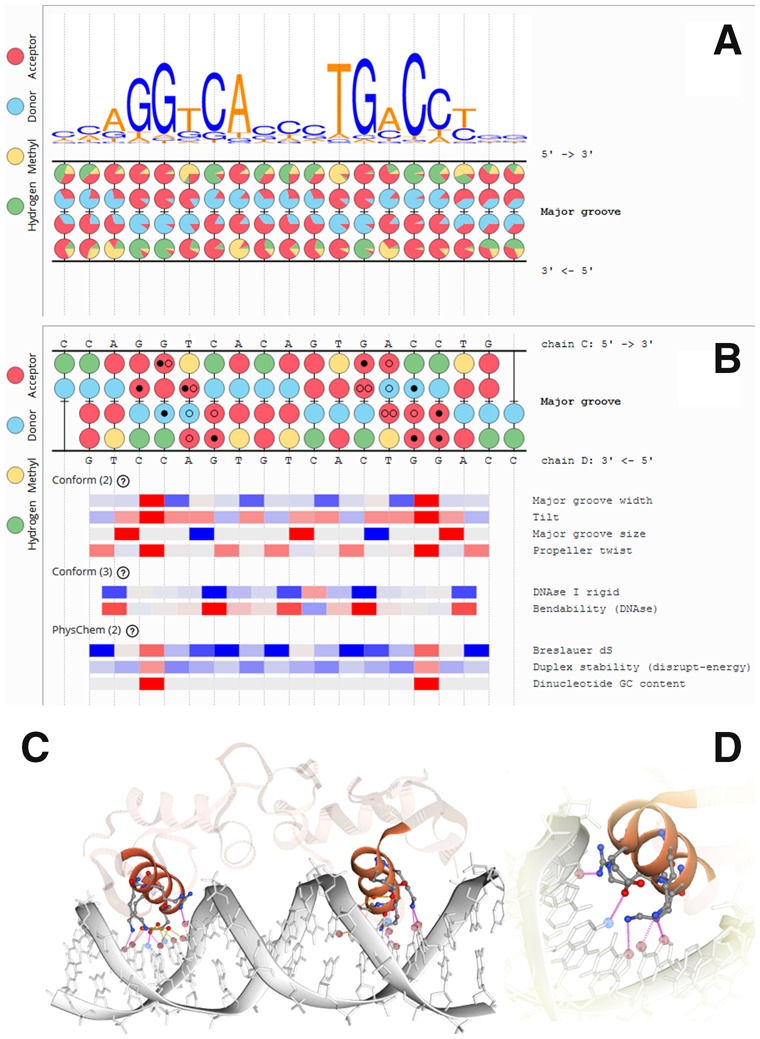
DRV offers several visualization methods for displaying the DNA-protein interactions from different scientific points of view. (A) Motif plotter output including sequence logo and FGDR display, generated from nucleotide frequency matrix (Jaspar: MA0112.2) of human estrogen receptor (hER). (B) Interface plotter output with panels for FGDR and PCDs, generated from crystallographic structure file of hER (PDB identifier 1HCQ). Direct and water-mediated H-bonds are indicated within the colored FGDR circles by black and empty dots, respectively. (C) 3D view of hER DNA-protein interface, generated by DRV Interface Plotter. H-bonding atoms are highlighted by coloring. (D) Enlarged 3D view; H-bonds between DNA and protein atoms are shown by magenta lines
3 Implementation
DRV is built around client-server architecture. The client-side web browser output is served by internal modules for PDB file processing, H-bond analysis and PCD calculations. External software integrated in the background processing pipeline of DRV include HBPlus (H-bond predictions; McDonald and Thornton, 1994), NGL (3D molecular graphics; Rose et al., 2018), WebLogo 3 (sequence logo generation; Crooks et al., 2004) and DNAshapeR (DNA descriptor calculation; Chiu et al., 2016). DRV functions are accessible via a user-friendly graphical web-browser-based interface, hosting three separate visualization modules, each displaying DNA features from a distinct point of view.
4 Functions
DNA plotter module displays the FGDR and the PCD patterns of DNA sequences supplied by the user. The module can reveal the base and shape readout characteristics of arbitrary DNA segments, and serves as a basis for the more complex functions of DRV.
Motif plotter module displays the functional group frequency patterns, corresponding to binding site definitions, uploaded by the user as nucleotide-based position frequency matrixes or IUPAC-encoded ambiguous sequences. JASPAR and UniPROBE DNA motif databases (Berger et al., 2006; Khan et al., 2018) have been integrated into DRV, so thousands of motifs from these sources can also be displayed using FGDR. The FGDR panel (Fig. 1A) is supplemented by a DNA logo for visual comparison of nucleotide and functional group frequency patterns. This tool is useful for identifying conserved sub-nucleotide features at DNA motif positions where more than one nucleotide can occur.
Interface plotter module integrates the visualization elements of DNA plotter with atomic level H-bond and hydrophobic contact information derived from 2115 DRV-compatible structures of 4250 DNA-protein complexes of the RCSB database (Burley et al., 2019). Direct and water-mediated H-bonds are projected onto the FGDR view as dots (Fig. 1B), while hydrophobic contacts are indicated by stripped circles. The primary purpose of this tool is to generate a simplified 2D representation of the complex 3D intermolecular contact system of DNA grooves, promoting the recognition of regular interaction patterns in DNA-protein interfaces. DRV also provides a detailed 2D all-atom DNA view displaying the different molecular contacts located either on the variable groove or on the invariant backbone parts of the DNA. In addition, a 3D molecular view (Fig. 1C) is generated as well, pre-configured to highlight the contacts participating in the DNA-protein interaction (Fig. 1D). The plotter can also be used to display the variability of the contact patterns of multiple structures present in certain NMR and crystallographic PDB entries that may reflect the dynamic nature of DNA-protein interaction.
5 Conclusion
The major novelty of DRV is its ability to represent protein-binding DNA motifs as complex patterns of base and shape DNA readout features. In this way, DRV assists the visual recognition of specificity requirements necessary for DNA-protein interactions. FGDR can be useful for detecting important functional group positions in DNA motifs, as well as PCDs to characterize the physico-chemical fingerprint of functional DNA segments. The visualization methods of DRV may contribute to understanding important biological functions by pinpointing patterns of functional groups and PCDs within binding sites that remained hidden when using the conventional nucleotide-based approaches (Supplementary Figs S1–S8). Furthermore, the highly configurable visualization capabilities of DRV make it an excellent tool not only for research, but also for demonstration purposes for a much wider range of scientists preparing presentation images about the target DNA motifs of their research interest.
Conflict of Interest: none declared.
Supplementary Material
References
- Berger M.F. et al. (2006) Compact, universal DNA microarrays to comprehensively determine transcription-factor binding site specificities. Nat. Biotechnol., 24, 1429–1435. [DOI] [PMC free article] [PubMed] [Google Scholar]
- Brukner I. et al. (1995) Sequence-dependent bending propensity of DNA as revealed by DNase I: parameters for trinucleotides. EMBO J., 14, 1812–1818. [DOI] [PMC free article] [PubMed] [Google Scholar]
- Burley S.K. et al. (2019) RCSB protein data bank: biological macromolecular structures enabling research and education in fundamental biology, biomedicine, biotechnology and energy. Nucleic Acids Res., 47, D464–D474. [DOI] [PMC free article] [PubMed] [Google Scholar]
- Chiu T.P. et al. (2016) DNAshapeR: an R/Bioconductor package for DNA shape prediction and feature encoding. Bioinformatics, 32, 1211–1213. [DOI] [PMC free article] [PubMed] [Google Scholar]
- Contreras-Moreira B. (2010) 3D-footprint: a database for the structural analysis of protein-DNA complexes. Nucleic Acids Res., 38, D91–D97. [DOI] [PMC free article] [PubMed] [Google Scholar]
- Crooks G. et al. (2004) WebLogo: a sequence logo generator. Genome Res., 14, 1188–1190. [DOI] [PMC free article] [PubMed] [Google Scholar]
- Jared M. et al. (2019) DNAproDB: an expanded database and web-based tool for structural analysis of DNA–protein complexes. Nucleic Acids Res., doi: 10.1093/nar/gkz889. [DOI] [PMC free article] [PubMed] [Google Scholar]
- Khan A. et al. (2018) JASPAR 2018: update of the open-access database of transcription factor binding profiles and its web framework. Nucleic Acids Res., 46, D260–D266. [DOI] [PMC free article] [PubMed] [Google Scholar]
- Li J. et al. (2017) Expanding the repertoire of DNA shape features for genome-scale studies of transcription factor binding. Nucleic Acids Res., 45, 12877–12887. [DOI] [PMC free article] [PubMed] [Google Scholar]
- Luscombe N. et al. (1997) NUCPLOT: a program to generate schematic diagrams of protein-nucleic acid interactions. Nucleic Acids Res., 25, 4940–4945. [DOI] [PMC free article] [PubMed] [Google Scholar]
- McDonald I., Thornton J. (1994) Satisfying hydrogen bonding potential in proteins. J. Mol. Biol., 238, 777–793. [DOI] [PubMed] [Google Scholar]
- Mukherjee S. et al. (2005) Role of hydrogen bonds in protein-DNA recognition: effect of non-planar amino groups. J. Phys. Chem. B, 109, 10484–10492. [DOI] [PubMed] [Google Scholar]
- Rohs R. et al. (2010) Origins of specificity in protein-DNA recognition. Annu. Rev. Biochem., 79, 233–269. [DOI] [PMC free article] [PubMed] [Google Scholar]
- Rose A. et al. (2018) NGL viewer: web-based molecular graphics for large complexes. Bioinformatics, 34, 3755–3758. [DOI] [PMC free article] [PubMed] [Google Scholar]
- Vlahovicek K. et al. (2003) DNA analysis servers: plot.it, bend.it, model.it and IS. Nucleic Acids Res., 31, 3686–3687. [DOI] [PMC free article] [PubMed] [Google Scholar]
Associated Data
This section collects any data citations, data availability statements, or supplementary materials included in this article.