

Abstract
Background and Objectives:
Adult class II/III obesity (BMI ≥ 35 kg/m2) has significant adverse health outcomes. Early prevention and treatment are critical, but prospective childhood risk estimates are lacking. This study aimed to define the prospective risk of adult class II/III obesity, using childhood BMI.
Methods:
Children ages 3–19 years enrolled in cohorts of The International Childhood Cardiovascular Cohort (i3C) Consortium with measured BMI assessments in childhood and adulthood were included. Prospective risk of adult class II/III obesity was modeled based on childhood age, sex, race and BMI.
Results:
12 142 individuals (44% male, 85% white) were assessed at median age 14 [Interquartile range, IQR: 11, 16] and 33 [28, 39] years. Class II/III adult obesity developed in 6% of children with normal weight; 29% of children with overweight; 56% of children with obesity; and 80% of children with severe obesity. However, 38% of the 1 440 adults with class II/III obesity (553/1440) were normal weight as children. Prospective risk of adult class II/III obesity varied by age, sex and race within childhood weight status classifications, and is notably higher for girls, black participants, and those in the United States. The risk of class II/III obesity increased with older adult age.
Conclusions:
Children with obesity or severe obesity have a substantial risk of adult class II/III obesity, and observed prospective risk estimates are now presented by age, sex, race and childhood BMI. Clinical monitoring of children’s BMI for adult class II/III obesity risk may be especially important for females and black Americans.
Table of Contents Summary
This study developed prospective risk estimates of adult class II/III obesity using childhood BMI, childhood age, sex and race, using longitudinal international data.
Introduction
The prevalence of adult class II/III obesity, defined as a body mass index (BMI) ≥ 35 kg/m2, is increasing worldwide.1 Compared with class I obesity (30 ≤ BMI < 35 kg/m2), class II/III obesity carries greater risks of all-cause mortality,2 adverse health effects1, 3 and limitations in activities of daily living.4 Adult obesity is typically persistent and often progressive,3, 5–7 and adult class II/III obesity is rarely reversible, even with bariatric surgery.8–10
Despite these health risks, little is known about the early natural history of adult class II/III obesity. Childhood obesity is recognized as a significant threat to both current and later cardiometabolic health.11, 12 Because BMI tracks strongly between childhood and adulthood13, 14 and risk of disease or mortality increases with longer durations of obesity,15, 16 there has been a general focus on the risk for poor adult outcomes in children with obesity, rather than differentiations based on degree of obesity. It is important to note that childhood growth charts and obesity thresholds were developed from cross-sectional data to enable comparison with age- and sex-specific peers, rather than from longitudinal data or prospective risk of adult obesity. To date, few cohorts have had the longitudinal data necessary to assess how childhood BMI, age, sex and race are related to prospective risk for adult class II/III obesity.
The International Childhood Cardiovascular Cohort (i3C) Consortium originally enrolled over 40,000 childhood participants in the 1970s and 1980s, with over 12,000 seen at a clinic visit in adulthood. The present study leverages these consolidated consortium data to define the relation between childhood age-specific BMI and adult class II/III obesity, and to evaluate the impacts of sex, race and country of origin on class II/III obesity risk.
Methods
Study Population
The i3C Consortium has been described previously.17, 18 Briefly, the Consortium includes seven large epidemiologic cohorts from the United States (Bogalusa Heart Study [BHS, Louisiana]; Minneapolis Childhood Cohorts [MPLS, Minnesota]; Muscatine Study [MUSC, Iowa]; NHLBI Growth and Health Study [NGHS, Ohio]; and Princeton Lipid Research Study [PLRS, Ohio]); Finland [Cardiovascular Risk in Young Finns Study [YFS]); and Australia (Childhood Determinants of Adult Health Study [CDAH]), which collectively recruited over 40 000 children and adolescents in the 1970s and 1980s for assessment of a variety of cardiometabolic risk factors. A subset of each of these cohorts has been re-evaluated at least once in adulthood, including an ongoing coordinated recruitment of former participants.18 Ethical approval for each study was granted by the Institutional Review Board (IRB) of the cohort’s home institution. All study participants provided written informed consent at each adult study visit, and both parental consent and participant assent were provided for childhood visits. The IRB at Cincinnati Children’s Hospital Medical Center approved this secondary data analysis.
The analysis cohort for this study includes any individual with at least one childhood (age < 20) body mass index (BMI) and at least one adult BMI (age ≥ 24) measurement, with the maximum measured adult BMI used in this study. For all analyses, a single childhood or adolescent visit was selected for each individual using simple random sampling, if cohorts assessed BMI multiple times during childhood. Supplemental Table 1 presents the distribution of sex by year of age at the selected visit.
Variable Selection and Definitions
The key variable of interest in the present study is BMI assessed as weight (kg) divided by height (m) squared. In childhood, BMI categories were defined using the Centers for Disease Control and Prevention (CDC) 2000 growth charts, as: normal weight (BMI < 85th percentile); overweight (85th percentile ≤ BMI <95th percentile); obesity (95th percentile ≤ BMI < 120% of 95th percentile) or severe obesity (BMI ≥ 120% of 95th percentile). The CDC thresholds were selected because the majority of participants were from the US; however, we also present analyses using International Obesity Task Force (IOTF) thresholds19 in Supplemental Table 2. In adulthood, the maximum BMI was classified as normal weight (BMI < 25 kg/m2); overweight (25 ≤ BMI < 30 kg/m2); class I obesity (30 ≤ BMI < 35 kg/m2), or class II/III obesity (BMI ≥ 35 kg/m2). Class II/III obesity is the primary adult outcome in the present study.
Statistical Analysis
All analyses were conducted using SAS (SAS Institute, Cary, NC) or R. Characteristics of the analysis dataset overall and by cohort are presented as number (%) or median (interquartile range, IQR).
Modeling of prospective risk of class II/III obesity using childhood BMI as a continuous independent variable (kg/m2) was conducted using logistic modeling with covariate adjustment, including data from all cohorts. Covariates of interest included country of study, sex, race, highest level of education (defined from self-report in adulthood as ≤high school or equivalent, some post-high school, 4-year university degree, or > university degree), age in childhood, and age at adult measurement (continuous). Quadratic forms of childhood age (e.g., age2); as well as all two-way interactions among childhood age or childhood age2, sex, BMI, race and education level were also tested, with the final model including only variables significant at p<0.05. Contour maps were generated from the final BMI prediction model, depicting the absolute estimated risk (probability) of adult class II/III obesity by childhood age and BMI, separately by sex (in all cohorts) and race (in US cohorts only).
Results
The cohort for this study included 12,142 participants (44% male; 85% white, Table 1). Median age at the selected childhood visit was 14 (Interquartile range [IQR]: 11, 16) years, and 82% of children were normal weight, 11% were overweight, 5% were obese and 2% were severely obese. Median year of the selected childhood visit was 1980 (IQR: 1975, 1985). Adult BMI was assessed at median age 33 (IQR: 28, 39) years, after a median of 21 (IQR: 18, 27) years of follow-up from the childhood measurement. Maximum adult weight status was 41% normal weight, 32% overweight, 15% class I obese, and 12% class II/III obese.
Table 1:
Description of the i3C Consortium Study Cohorts
| Overall | BHS | CDAH | MPLS | MUSC | NGHS | PLRS | YFS | |
|---|---|---|---|---|---|---|---|---|
| N | 12 142 | 22% (2 619) | 19% (2 329) | 6% (749) | 19% (2 249) | 5% (605) | 6% (786) | 23% (2 805) |
| Sex (% M) | 44% (5 389) | 44% (1 164) | 49% (1 148) | 50% (373) | 47% (1 049) | 0% (0) | 45% (356) | 46% (1 299) |
| Race (% NH white) a | 85% (9 444) | 69% (1 795) | 96% (1 721) | 71% (532) | 99% (1 756) | 46% (275) | 71% (560) | 100% (2 805) |
| Childhood data b | ||||||||
| Year of selected visit (median, IQR) | 1980 (1975, 1985) | 1977 (1975, 1980) | 1985 (1985, 1985) | 1984 (1980, 1987) | 1971 (1971, 1973) | 1991 (1989, 1994) | 1975 (1974, 1976) | 1980 (1980, 1983) |
| N visits | 2 (1, 4) | 4 (2,5) | 1 (1, 1) | 16 (4, 18) | 2 (1, 3) | 10 (9, 10) | 1 (1, 1) | 3 (2, 4) |
| % with ≥2 visits | 60% (7 308) | 88% (2 291) | 0% (0) | 95% (712) | 59% (1 315) | 100% (605) | 24% (190) | 78% (2 195) |
| Age at selected visit | 14 (11, 16) | 13 (11, 16) | 12 (10, 14) | 13 (11, 15) | 15 (13, 17) | 14 (12, 17) | 13 (11, 16) | 15 (10, 18) |
| Era of birth (n, %) | ||||||||
| 1950-<1960 | 19% (2 258) | 10% (271) | 0% (0) | 0% (0) | 79% (1 770) | 0% (0) | 28% (217) | 0% (0) |
| 1960-<1970 | 38% (4 661) | 72% (1 885) | 4% (95) | 27% (203) | 21% (479) | 0% (0) | 72% (569) | 51% (1 430) |
| 1970 or later | 43% (5 223) | 18% (463) | 96% (2 234) | 73% (546) | 0% (0) | 100% (605) | 0% (0) | 49% (1 375) |
| BMI percentile at selected visit (median, IQR) | 56 (32, 78) | 56 (29, 81) | 55 (33, 74) | 69 (43, 88) | 63 (41, 81) | 72 (46, 90) | 56 (32, 82) | 46 (25, 68) |
| Weight status at selected visit (n, %) | ||||||||
| Normal | 82% (9 998) | 79% (2 074) | 88% (2 045) | 70% (528) | 80% (1 797) | 67% (403) | 79% (617) | 90% (2 534) |
| Overweight | 11% (1 336) | 12% (309) | 9% (216) | 16% (120) | 12% (275) | 18% (111) | 12% (96) | 8% (209) |
| Obese | 5% (615) | 7% (175) | 3% (64) | 10% (73) | 6% (138) | 9% (57) | 7% (54) | 2% (54) |
| Severely obese | 2% (193) | 2% (61) | <1% (4) | 4% (28) | 2% (39) | 6% (34) | 2% (19) | <1% (8) |
| Adulthood data | ||||||||
| N assessments c | 3 (2, 3) | 3 (1, 5) | 3 (2, 3) | 2 (1, 2) | 3 (2, 4) | 3 (2, 3) | 2 (1, 3) | 3 (2, 4) |
| % with ≥2 adult assessments | 82% (9 941) | 72% (1 889) | 85% (1 990) | 70% (520) | 86% (1 935) | 94% (566) | 71% (561) | 88% (2 480) |
| Age at maximum measured BMI, years | 33 (28, 39) | 33 (27, 40) | 31 (29, 33) | 37 (26, 39) | 30 (28, 39) | 26 (24, 26) | 38 (36, 41) | 37 (33, 43) |
| Highest Education reported in adulthood | ||||||||
| ≤ High school or equivalent | 33% (3,674) | 37% (675) | 25% (574) | 28% (174) | 43% (963) | 17% (72) | 25% (195) | 37% (1,021) |
| Some post-high school | 32% (3,510) | 23% (418) | 30% (694) | 30% (181) | 31% (694) | 33% (135) | 35% (274) | 40% (1,114) |
| 4-year university degree | 25% (2,704) | 31% (572) | 30% (698) | 24% (149) | 19% (430) | 24% (97) | 27% (210) | 20% (548) |
| > University degree | 10% (1,088) | 9% (173) | 15% (362) | 18% (110) | 7% (162) | 26% (109) | 13% (97) | 3% (75) |
| Person-years of follow-up at time of maximum measured BMI, years | 21 (18, 27) | 23 (17, 29) | 20 (19, 20) | 30 (15, 31) | 17 (13, 25) | 16 (14, 16) | 25 (24, 27) | 27 (21, 31) |
| Maximum measured BMI, kg/m2 | 26 (23, 31) | 28 (24, 33) | 25 (22, 28) | 28 (24, 33) | 26 (23, 30) | 27 (23, 34) | 27 (24, 32) | 26 (23, 29) |
| Weight status at maximum measured BMI in adulthood (n, %) | ||||||||
| Normal | 41% (4 977) | 34% (896) | 51% (1 176) | 33% (245) | 46% (1 032) | 38% (228) | 33% (261) | 41% (1 139) |
| Overweight | 32% (3 860) | 28% (720) | 34% (801) | 31% (234) | 28% (630) | 25% (155) | 33% (260) | 38% (1 060) |
| Obese, Class I | 15% (1 865) | 19% (497) | 10% (238) | 18% (136) | 15% (343) | 15% (91) | 19% (148) | 14% (412) |
| Obese, Class II/III | 12% (1 440) | 19% (506) | 5% (114) | 18% (134) | 11% (244) | 22% (131) | 15% (117) | 7% (194) |
Median (Interquartile range) or Number (percent) presented
Race data not available for all cohort members
Childhood data presented for randomly-selected childhood visit used in analysis
Assessments in adulthood may include measured or self-reported data.
Abbreviations: BHS: Bogalusa Heart Study; CDAH: Childhood Determinants of Adult Health; MPLS: Minneapolis Childhood Cohorts; MUSC: Muscatine Study; NGHS: NHLBI Growth and Health Study; PLRS: Princeton Lipid Research Study; YFS: Cardiovascular Risk in Young Finns Study; IQR: Interquartile range; NH: non-Hispanic.
BMI category definitions: Childhood: Normal weight (BMI <85th percentile); Overweight (85th ≤BMI<95th percentile); Obese (95th≤BMI<120% of 95th percentile); Severely obese (BMI≥120% of 95th percentile). Adulthood: Normal weight (BMI<25 kg/m2); Overweight (25≤BMI<30 kg/m2); Obese, Class I (30≤BMI<35 kg/m2); Obese, Class II/III (BMI≥35 kg/m2).
The unadjusted absolute and relative risks of adult class II/III obesity by standard CDC childhood BMI categories (with normal weight group as reference) are presented in Table 2. Overall, class II/III adult obesity developed in 6% of normal-weight children; 29% of overweight children; 56% of children with obesity; and 80% of children with severe obesity. However, over one-third of adults with class II/III obesity (553/1 440, 38%) were normal weight as children. Compared with the US cohorts, the non-US cohorts had generally lower obesity rates in childhood (<3% versus 10%) and lower class II/III obesity rates in adulthood (6% [308/5134] versus 16% [1132/7008). This lower childhood obesity rate resulted in a higher proportion (49% [150/308]) of non-US class II/III adults having been normal weight as children. Analyses using the childhood IOTF thresholds rather than the CDC 2000 thresholds yielded similar results (Supplemental Table 2)
Table 2:
Risk of adult class II/III obesity by standard CDC childhood BMI categories
| Childhood BMI categories |
Percent of Cohort (random childhood visit) |
Absolute Risk of Adult Class II/III Obesity (%) |
Relative Risk (RR) [95% CI] |
Percent of adults with Class II/III obesity from this childhood BMI category |
|---|---|---|---|---|
| All Cohorts | ||||
| Normal weight | 82% | 6% (553/9998) | 1.0 (Ref) | 38% (553/1440) |
| Overweight | 11% | 29% (390/1336) | 5.3 [4.7, 5.9] | 27% (390/1440) |
| Obese | 5% | 56% (342/615) | 10.1 [9.0, 11.2] | 24% (342/1440) |
| Severely obese | 2% | 80% (155/193) | 14.5 [13.0, 16.2] | 11% (155/1440) |
| US Cohorts | ||||
| Normal weight | 77% | 7% (403/5419) | 1.0 (Ref) | 36% (403/1132) |
| Overweight | 13% | 32% (290/911) | 4.3 [3.7, 4.9] | 26% (290/1132) |
| Obese | 7% | 58% (290/497) | 7.8 [7.0, 8.8] | 26% (290/1132) |
| Severely obese | 3% | 82% (149/181) | 11.1 [9.9, 12.4] | 13% (149/1132) |
| Non-US Cohorts (YFS and CDAH) | ||||
| Normal weight | 89% | 3% (150/4579) | 1.0 (Ref) | 49% (150/308) |
| Overweight | 8% | 24% (100/425) | 7.2 [5.7, 9.1] | 32% (100/308) |
| Obese | 2% | 44% (52/118) | 13.5 [10.4, 17.4] | 17% (52/308) |
| Severely obese | <1% | 50% (6/12) | 15.3 [8.5, 27.5] | 2% (6/308) |
CDC BMI category definitions: Normal weight (BMI <85th percentile); Overweight (85th ≤BMI<95th percentile); Obesity (95th≤BMI<120% of 95th percentile); Severe obesity (BMI≥120% of 95th percentile).
Prospective risk of adult class II/III obesity using functions of continuous childhood BMI, age, race and sex
In an attempt to better estimate risk prediction for adult class II/III obesity from childhood BMI and childhood age, we developed a multivariable logistic regression model; the final model included childhood age, childhood age2, childhood BMI, childhood age × BMI and childhood age2 × BMI interaction effects, education level, race, sex, country of study, and adult age at maximum BMI (Table 3). This model had an area under the ROC curve of 0.872.
Table 3:
Final Risk Model for Adult Class II/III Obesity
| Beta Estimate ± SE | OR (95% CI) | Included in Figure(s) | |
|---|---|---|---|
| Risk Model | |||
| Intercept | −18.9 ± 2.24 | - | All |
| Sex | |||
| Female | Reference | Reference | 1C and D, 2C and D, Supp Figures C and D |
| Male | −0.23 ± 0.04 | 0.63 (0.54, 0.73) | 1A and B, 2A and B, Supp Figures A and B |
| Race/ethnicity | |||
| White | Reference | Reference | 1B and D, 2B and D |
| Black | 0.88 ± 0.10 | 2.42 (1.99, 2.94) | 1A and C, 2A and C |
| Hispanic | −0.02 ± 0.37 | 0.98 (0.47, 2.02) | Not shown |
| Other/mixed | −0.21 ± 0.16 | 0.81 (0.60, 1.10) | Not shown |
| Childhood age, y | 1.15 ± 0.34 | - | All |
| Childhood BMI, kg/m2 | 0.92 ± 0.13 | - | All |
| Age*BMI | −0.08 ± 0.02 | - | All |
| Age2 | −0.05 ± 0.01 | - | All |
| Age2*BMI | 0.003 ± 0.001 | - | All |
| Covariates | |||
| Country | |||
| US | Reference | Reference | Figures 1 and 2 |
| Australia | −0.35 ± 0.12 | 0.71 (0.56, 0.90) | Supp Figures A and C |
| Finland | −0.55 ± 0.10 | 0.58 (0.47, 0.71) | Supp Figures B and D |
| Adult age, y | 0.09 ± 0.01 | 1.09 (1.08, 1.11) | =age 35 (Figure 1, Supp) =age 45 (Figure 2) |
| Education level | |||
| ≤High school | 0.71 ± 0.15 | 2.04 (1.51, 2.74) | Not shown |
| More than high school | 0.65 ± 0.15 | 1.91 (1.42, 2.58) | All |
| University degree | 0.36 ± 0.16 | 1.43 (1.05, 1.96) | Not shown |
| More than university degree | Reference | Reference | Not shown |
Bold indicates statistically significant odds ratios or Beta estimates (p≤0.05); odds ratios are not provided for the intercept or terms involved in interactions.
The modeled results are presented graphically for the US cohorts in Figures 1 and 2, and for the non-US cohorts in Supplemental Figure 1 as a “risk contour map,” with the absolute predicted risk (probability) of adult class II/III obesity depicted by the values of the contour lines (e.g., the 0.4 line indicating 40% risk for class II/III obesity in adulthood). In these charts, the shaded areas behind the contour lines represent the current CDC growth chart categories, for reference only. Clinically, this chart can be used similarly to a growth chart, with the intersection of the child’s age and BMI falling on or between the contour lines, providing the estimated risk for developing class II/III obesity at the given adult age (e.g., age 35 in Figure 1 and age 45 in Figure 2). For example, a white 5 year-old girl with a BMI of 20 kg/m2 (which is in the obese range, shaded dark gray, for this age) would have ~60% risk of developing adult class II/III obesity by age 35 (Figure 1D) and ~80% risk by age 45 (Figure 2D).
Figure 1: Risk of Adult Class II/III Obesity at age 35 by Childhood Age and BMI.
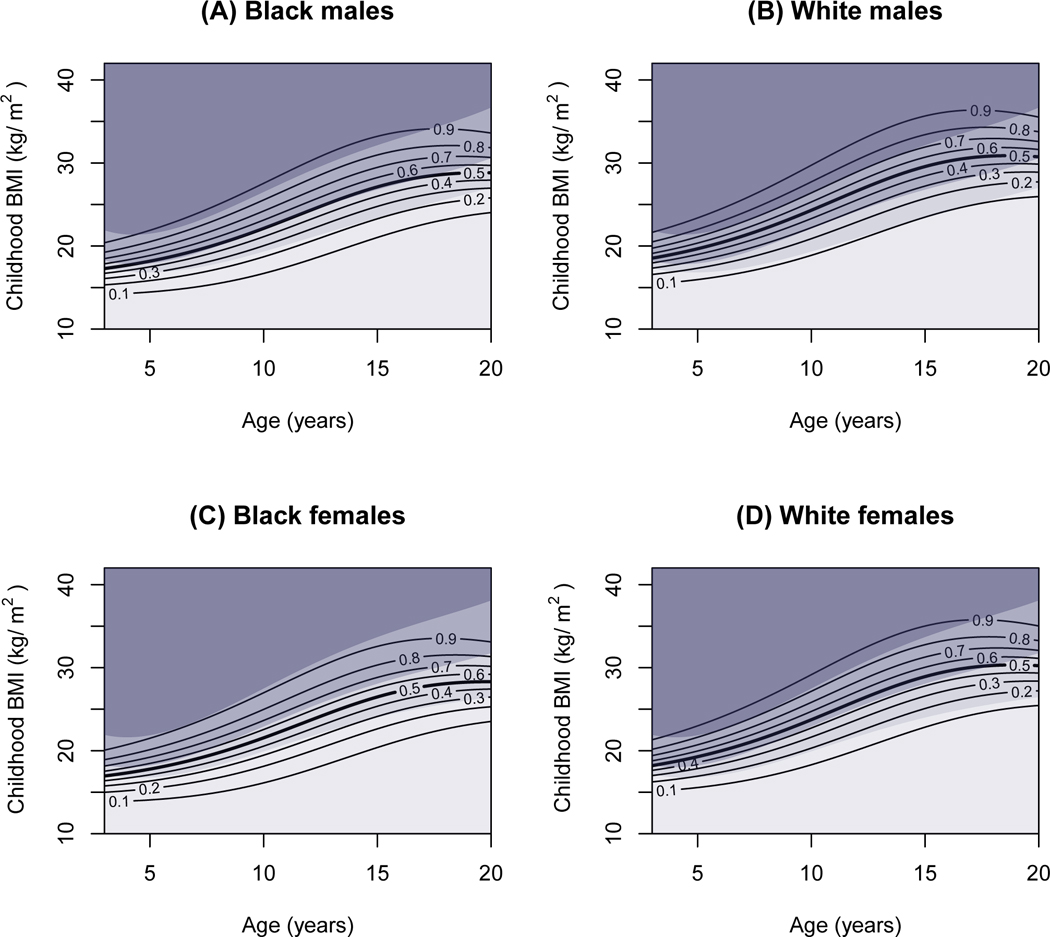
Contour lines represent risk of developing class II/III obesity by age 35; adult risk level is indicated by the number on the contour (e.g., 0.9=90% risk). Shaded areas, presented for reference only, represent (from top to bottom): childhood severe obesity (darkest gray), obesity (dark gray), overweight (medium gray) and normal weight (light gray), according to the CDC 2000 growth charts. Results are presented by race (white or black only) and sex groups, with the country fixed as United States. A) White males; B) Black males; C) White females; D) White males.
Figure 2: Risk of Adult Class II/III Obesity at age 45 by Childhood Age and BMI.

Contour lines represent risk of developing class II/III obesity by age 45; adult risk level is indicated by the number on the contour (e.g., 0.9=90% risk). Shaded areas, presented for reference only, represent (from top to bottom): childhood severe obesity (darkest gray), obesity (dark gray), overweight (medium gray) and normal weight (light gray), according to the CDC 2000 growth charts. Results are presented by race (white or black only) and sex groups, with the country fixed as United States. A) White males; B) Black males; C) White females; D) White males.
The contour maps show that the risk of adult class II/III obesity among both the US and non-US cohorts varies significantly and continuously across childhood BMI at each childhood age. This variation is evident even within the standard CDC overweight and obese classifications, indicated by the shaded areas on the graphs. As shown in Table 3, and presented graphically in Figures 1 and 2, risk is substantially higher for girls than boys; for black participants than white participants; for those with lower education; as well as at older adult ages. In general, the shape of the prospective risk curve is somewhat flatter than the growth chart percentile curves, especially in later adolescence, such that all standard BMI categories (even normal weight) are associated with greater prospective risk in older versus younger children. This is particularly evident for US adolescent black girls, whose prospective risk of class II/III obesity in adulthood is as high as 50% even within the normal range of BMI.
Discussion
This study provides a detailed prospective evaluation, in a large (n=12 142) international cohort, of the risks for developing adult class II/III obesity (BMI ≥ 35 kg/m2), based on their childhood measures of BMI, age, sex and race. The results show that, while the prospective risk is particularly high in children with obesity and severe obesity (56% and 80%, respectively), a plurality of those who develop class II/III obesity in adulthood were children with normal weight.
Estimating prospective adult class II/III obesity risk using observed measurements in both childhood and adulthood provides a more nuanced view of how childhood BMI relates to adult obesity. Presented as a series of contour maps specific to sex, race and adult age, these data can be used clinically to evaluate the prospective risk of adult class II/III among children and adolescents, and to initiate conversations with patients and their families regarding risk.
A recent study, using complex simulation modeling of childhood trajectories predicting obesity at age 35, provides comparable estimates of the risk of class II/III obesity by childhood BMI category, particularly for children with obesity and severe obesity.20 However, contrary to our findings, the simulation study estimated that children with normal weight had a very high probability of severe obesity by age 35 (31.9% of males and 32.9% of females who were normal weight at age 5) which decreased significantly with childhood age. The prospective risk of adult class II/III obesity among children with normal weight in the present analysis was lower (6%) and remained relatively stable by age at childhood measurement. The present study does, however, show that risks increase somewhat for adolescents with normal weight, especially among black and female participants. These differences may be due to assumptions about the future (unobserved) prevalence of severe obesity in the simulation study based on continuation of secular trends, compared to the use of observed adult outcomes in the present study.
Another key finding of this study is that 38% of adults with current class II/III obesity were children with normal weight, suggesting that for some individuals, young adult onset obesity also plays an important role. This has been noted in other prospective studies from individual i3C Consortium cohorts21 and the recent simulation study,20 but has largely been missed in retrospective studies of adult class II/III obesity. Class III obesity in adults seeking bariatric surgery22 or medical weight management23 is associated with earlier self-reported age at obesity onset22, 23 and higher reported weights at specific ages,22 compared with individuals with class I or II obesity. However, most of these previous studies have not considered childhood weight status. The non-trivial risk of children with normal weight attaining class II/III obesity by mid-adulthood, coupled with the finding of significant proportions of adult class II/III obesity occurring among children who were formerly normal weight, underscores the need to focus on adult severe obesity risk in BMI trajectories that rise above the normal range, whenever that occurs from childhood to adulthood.
A dilemma presented is how to properly identify which children with normal weight or overweight may be at increased risk of class II/III obesity in adulthood. In the present study, both female sex and black race experienced greater obesity prevalence during childhood (data not shown), and both of these groups were independently associated with greater absolute risk of developing adult class II/III obesity in this study. Lower levels of education reported in adulthood were also associated with higher risks of adult class II/III obesity. However, the temporal relationship between education and class II/III obesity development is not as clear, as both education and obesity levels change as participants age. Prospective data from the Longitudinal Study of Adolescent Health also noted higher incidence rates of severe obesity by ages 24–34 in females and minority groups,24 and black race was also a risk factor for class III obesity in an earlier analysis from the NGHS cohort.25 Additional factors, such as early life exposures (e.g., maternal cigarette smoking during pregnancy,26 maternal pre-pregnancy BMI,27 birth weight and early feeding characteristics28), parental BMI, genetics, additional socioeconomic characteristics, and dietary or physical activity habits, which were not available for this analysis and may be important, should be explored in other studies to determine additional critical factors for the development of adult class II/III obesity. However, this analysis suggests that attention should be focused on both the prevention of childhood obesity at all ages, especially in girls and black populations, and to preventing children with normal weight in these groups from developing into adults with class II/III obesity.
Despite a large sample size; measured BMI values in childhood and adolescence; and extensive longitudinal follow-up, some potential study limitations should be noted. The i3C Consortium cohorts were enrolled in the 1970s and 1980s, prior to the obesity epidemic of the later 1980s. Thus, participants who were adults by the mid-1980s would likely have experienced obesity epidemic-related BMI gains in their adult years. Future studies may find a lower proportion of adults with class II/III obesity who were children with normal weights. However, the current prevalence of childhood obesity has stabilized at ~18% of 6–19 year-olds in the United States, with ~67% normal weight,29 and this is similar to the distribution of childhood BMI categories for many of the cohorts included here. In addition, several key early-life, socioeconomic and lifestyle factors were either not collected in most cohorts or inconsistently assessed across time and cohort, so analysis of how these factors may modify the risk of adult class II/III was not possible. Another limitation is that the assembled cohorts are not nationally-representative, particularly in the United States, which may affect generalizability of results. However, as existing nationally-representative cohorts (such as the National Health and Nutrition Examination Survey) do not include sufficient longitudinal follow-up, such data are currently not available in the United States.
In conclusion, data from the long-term prospective i3C Consortium of seven cohorts with data from childhood to adulthood demonstrate that the prospective risk of developing adult class II/III obesity is particularly high for children with obesity and severe obesity. Our key findings note that 1) over one-third of adults with class II/III obesity were children with normal weights; 2) girls and black children in the United States have significantly higher prospective risks of developing class II/III obesity as adults at all levels of childhood BMI; and therefore, 3) assessment using standard childhood BMI categories thresholds may not be sufficient to capture the true prospective risk. Taken together, these findings indicate that greater clinical attention should be given to longitudinal preventive measures, such as achieving a healthy diet and sufficient physical activity, even in children and adolescents with normal weights. With tailored childhood monitoring through childhood, adolescence and young adulthood, it may be possible to prevent the high rate of progression to adult class II/III obesity.
Supplementary Material
What is Known on This Subject
Adult class II/III obesity in adulthood is a significant health concern. The origins of adult class II/III obesity may begin in childhood, but little is known about its natural history or risk prediction among children, when prevention may be possible.
What This Study Adds
This prospective evaluation of the risks of adult class II/III obesity based on childhood age, sex, race and BMI provides a clinical tool for risk prediction. Even children of normal weight can experience elevated risks, particularly among US black girls.
Acknowledgments
Funding Source: Funded by the National Institutes of Health, National Heart, Lung and Blood Institute, grant number R01 HL121230.
Abbreviations:
- BMI
Body mass index
- BHS
Bogalusa Heart Study
- CDAH
Childhood Determinants of Adult Health Study
- CDC
Centers for Disease Control and Prevention
- i3C Consortium
The International Childhood Cardiovascular Cohort (i3C) Consortium
- IQR
Interquartile range
- MPLS
Minneapolis Childhood Cohorts
- MUSC
Muscatine Study
- NGHS
NHLBI Growth and Health Study
- PLRS
Princeton Lipid Research Study
- YFS
Cardiovascular Risk in Young Finns Study
Footnotes
Financial Disclosure: The authors have no financial relationships relevant to this article to disclose.
Conflicts of Interest: None of the authors has indicated any potential conflicts of interest
Clinical Trial Registration: Not applicable
References
- 1.Global Burden of Disease 2015 Obesity Collaborators, Afshin A, Forouzanfar MH, Reitsma MB, Sur P, Estep K et al. Health Effects of Overweight and Obesity in 195 Countries over 25 Years. N Engl J Med 2017; 377(1): 13–27. [DOI] [PMC free article] [PubMed] [Google Scholar]
- 2.Flegal KM, Kit BK, Orpana H, Graubard BI. Association of all-cause mortality with overweight and obesity using standard body mass index categories: a systematic review and meta-analysis. JAMA 2013; 309(1): 71–82. [DOI] [PMC free article] [PubMed] [Google Scholar]
- 3.Gadde KM, Martin CK, Berthoud HR, Heymsfield SB. Obesity: Pathophysiology and Management. J Am Coll Cardiol 2018; 71(1): 69–84. [DOI] [PMC free article] [PubMed] [Google Scholar]
- 4.Backholer K, Wong E, Freak-Poli R, Walls HL, Peeters A. Increasing body weight and risk of limitations in activities of daily living: a systematic review and meta-analysis. Obes Rev 2012; 13(5): 456–68. [DOI] [PubMed] [Google Scholar]
- 5.Finkelstein EA, Ostbye T, Malhotra R. Body mass trajectories through midlife among adults with class I obesity. Surg Obes Relat Dis 2013; 9(4): 547–553 e1. [DOI] [PubMed] [Google Scholar]
- 6.Wong ES, Wang BC, Alfonso-Cristancho R, Flum DR, Sullivan SD, Garrison LP et al. BMI trajectories among the severely obese: results from an electronic medical record population. Obesity (Silver Spring) 2012; 20(10): 2107–12. [DOI] [PubMed] [Google Scholar]
- 7.Fildes A, Charlton J, Rudisill C, Littlejohns P, Prevost AT, Gulliford MC. Probability of an Obese Person Attaining Normal Body Weight: Cohort Study Using Electronic Health Records. Am J Public Health 2015; 105(9): e54–9. [DOI] [PMC free article] [PubMed] [Google Scholar]
- 8.Gero D, Favre L, Allemann P, Fournier P, Demartines N, Suter M. Laparoscopic Roux-En-Y Gastric Bypass Improves Lipid Profile and Decreases Cardiovascular Risk: a 5-Year Longitudinal Cohort Study of 1048 Patients. Obes Surg 2017. [DOI] [PubMed] [Google Scholar]
- 9.Inge TH, Jenkins TM, Xanthakos SA, Dixon JB, Daniels SR, Zeller MH et al. Long-term outcomes of bariatric surgery in adolescents with severe obesity (FABS-5+): a prospective follow-up analysis. Lancet Diabetes Endocrinol 2017; 5(3): 165–173. [DOI] [PMC free article] [PubMed] [Google Scholar]
- 10.Olbers T, Beamish AJ, Gronowitz E, Flodmark CE, Dahlgren J, Bruze G et al. Laparoscopic Roux-en-Y gastric bypass in adolescents with severe obesity (AMOS): a prospective, 5-year, Swedish nationwide study. Lancet Diabetes Endocrinol 2017; 5(3): 174–183. [DOI] [PMC free article] [PubMed] [Google Scholar]
- 11.Goodman E, Dolan LM, Morrison JA, Daniels SR. Factor analysis of clustered cardiovascular risks in adolescence: obesity is the predominant correlate of risk among youth. Circulation 2005; 111(15): 1970–7. [DOI] [PubMed] [Google Scholar]
- 12.Freedman DS, Dietz WH, Tang R, Mensah GA, Bond MG, Urbina EM et al. The relation of obesity throughout life to carotid intima-media thickness in adulthood: the Bogalusa Heart Study. Int J Obes Relat Metab Disord 2004; 28(1): 159–66. [DOI] [PubMed] [Google Scholar]
- 13.Freedman DS, Khan LK, Serdula MK, Dietz WH, Srinivasan SR, Berenson GS. Racial differences in the tracking of childhood BMI to adulthood. Obes Res 2005; 13(5): 928–35. [DOI] [PubMed] [Google Scholar]
- 14.Bayer O, Kruger H, von Kries R, Toschke AM. Factors associated with tracking of BMI: a meta-regression analysis on BMI tracking. Obesity (Silver Spring) 2011; 19(5): 1069–76. [DOI] [PubMed] [Google Scholar]
- 15.Abdullah A, Wolfe R, Stoelwinder JU, de Courten M, Stevenson C, Walls HL et al. The number of years lived with obesity and the risk of all-cause and cause-specific mortality. Int J Epidemiol 2011; 40(4): 985–96. [DOI] [PubMed] [Google Scholar]
- 16.Everhart JE, Pettitt DJ, Bennett PH, Knowler WC. Duration of obesity increases the incidence of NIDDM. Diabetes 1992; 41(2): 235–40. [DOI] [PubMed] [Google Scholar]
- 17.Dwyer T, Sun C, Magnussen CG, Raitakari OT, Schork NJ, Venn A et al. Cohort Profile: the international childhood cardiovascular cohort (i3C) consortium. Int J Epidemiol 2013; 42(1): 86–96. [DOI] [PMC free article] [PubMed] [Google Scholar]
- 18.Sinaiko AR, Jacobs DR Jr., Woo JG, Bazzano L, Burns T, Hu T et al. The International Childhood Cardiovascular Cohort (i3C) consortium outcomes study of childhood cardiovascular risk factors and adult cardiovascular morbidity and mortality: Design and recruitment. Contemp Clin Trials 2018; 69: 55–64. [DOI] [PMC free article] [PubMed] [Google Scholar]
- 19.Cole TJ, Lobstein T. Extended international (IOTF) body mass index cut-offs for thinness, overweight and obesity. Pediatric obesity 2012; 7(4): 284–94. [DOI] [PubMed] [Google Scholar]
- 20.Ward ZJ, Long MW, Resch SC, Giles CM, Cradock AL, Gortmaker SL. Simulation of Growth Trajectories of Childhood Obesity into Adulthood. N Engl J Med 2017; 377(22): 2145–2153. [DOI] [PMC free article] [PubMed] [Google Scholar]
- 21.Venn AJ, Thomson RJ, Schmidt MD, Cleland VJ, Curry BA, Gennat HC et al. Overweight and obesity from childhood to adulthood: a follow-up of participants in the 1985 Australian Schools Health and Fitness Survey. Med J Aust 2007; 186(9): 458–60. [DOI] [PubMed] [Google Scholar]
- 22.Crerand CE, Wadden TA, Sarwer DB, Fabricatore AN, Kuehnel RH, Gibbons LM et al. A comparison of weight histories in women with class III vs. class I-II obesity. Surg Obes Relat Dis 2006; 2(2): 165–70. [DOI] [PubMed] [Google Scholar]
- 23.O’Connell J, Kieran P, Gorman K, Ahern T, Cawood TJ, O’Shea D. BMI > or = 50 kg/m2 is associated with a younger age of onset of overweight and a high prevalence of adverse metabolic profiles. Public Health Nutr 2010; 13(7): 1090–8. [DOI] [PubMed] [Google Scholar]
- 24.Richardson AS, Dietz WH, Gordon-Larsen P. The association between childhood sexual and physical abuse with incident adult severe obesity across 13 years of the National Longitudinal Study of Adolescent Health. Pediatric obesity 2014; 9(5): 351–61. [DOI] [PMC free article] [PubMed] [Google Scholar]
- 25.Glueck CJ, Morrison JA, Daniels S, Wang P, Stroop D. Sex hormone-binding globulin, oligomenorrhea, polycystic ovary syndrome, and childhood insulin at age 14 years predict metabolic syndrome and class III obesity at age 24 years. J Pediatr 2011; 159(2): 308–13 e2. [DOI] [PMC free article] [PubMed] [Google Scholar]
- 26.Salahuddin M, Perez A, Ranjit N, Hoelscher DM, Kelder SH. The effect of prenatal maternal cigarette smoking on children’s BMI z-score with SGA as a mediator. Int J Obes (Lond) 2018; 42(5): 1008–1018. [DOI] [PubMed] [Google Scholar]
- 27.Salahuddin M, Perez A, Ranjit N, Kelder SH, Barlow SE, Pont SJ et al. Predictors of Severe Obesity in Low-Income, Predominantly Hispanic/Latino Children: The Texas Childhood Obesity Research Demonstration Study. Prev Chronic Dis 2017; 14: E141. [DOI] [PMC free article] [PubMed] [Google Scholar]
- 28.Salahuddin M, Perez A, Ranjit N, Hoelscher DM, Kelder SH. The associations of large-for-gestational-age and infant feeding practices with children’s body mass index z-score trajectories: the Early Childhood Longitudinal Study, Birth Cohort. Clin Obes 2017; 7(5): 307–315. [DOI] [PubMed] [Google Scholar]
- 29.Ogden CL, Carroll MD, Kit BK, Flegal KM. Prevalence of obesity and trends in body mass index among US children and adolescents, 1999–2010. JAMA 2012; 307(5): 483–90. [DOI] [PMC free article] [PubMed] [Google Scholar]
Associated Data
This section collects any data citations, data availability statements, or supplementary materials included in this article.