Summary Paragraph
Recurrent somatic single nucleotide variants (SNVs) in cancer are largely confined to protein coding genes, and are rare in most pediatric cancers1–3. We report highly recurrent hotspot mutations of U1 spliceosomal small nuclear RNAs (snRNAs) in ~50% of Sonic Hedgehog medulloblastomas (Shh-MB), which were not present across other medulloblastoma subgroups. This U1-snRNA hotspot mutation (r.3a>g), was identified in <0.1% of 2,442 cancers across 36 other tumor types. Largely absent from infant Shh-MB, the mutation occurs in 97% of adults (Shhδ), and 25% of adolescents (Shhα). The U1-snRNA mutation occurs in the 5′ splice site binding region, and snRNA mutant tumors have significantly disrupted RNA splicing with an excess of 5′ cryptic splicing events. Mutant U1-snRNA mediated alternative splicing inactivates tumor suppressor genes (PTCH1), and activates oncogenes (GLI2, CCND2), represents a novel target for therapy, and constitutes a highly recurrent and tissue-specific mutation of a non-protein coding gene in cancer.
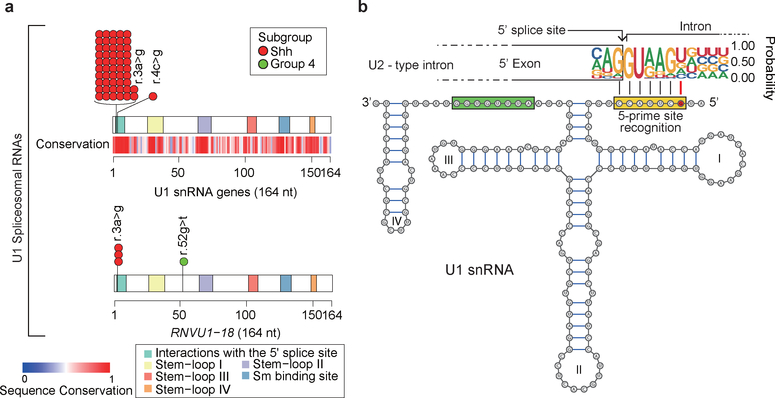
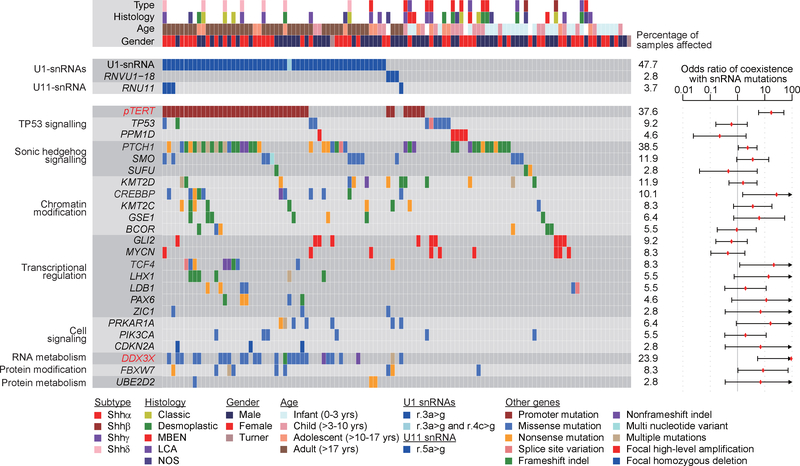
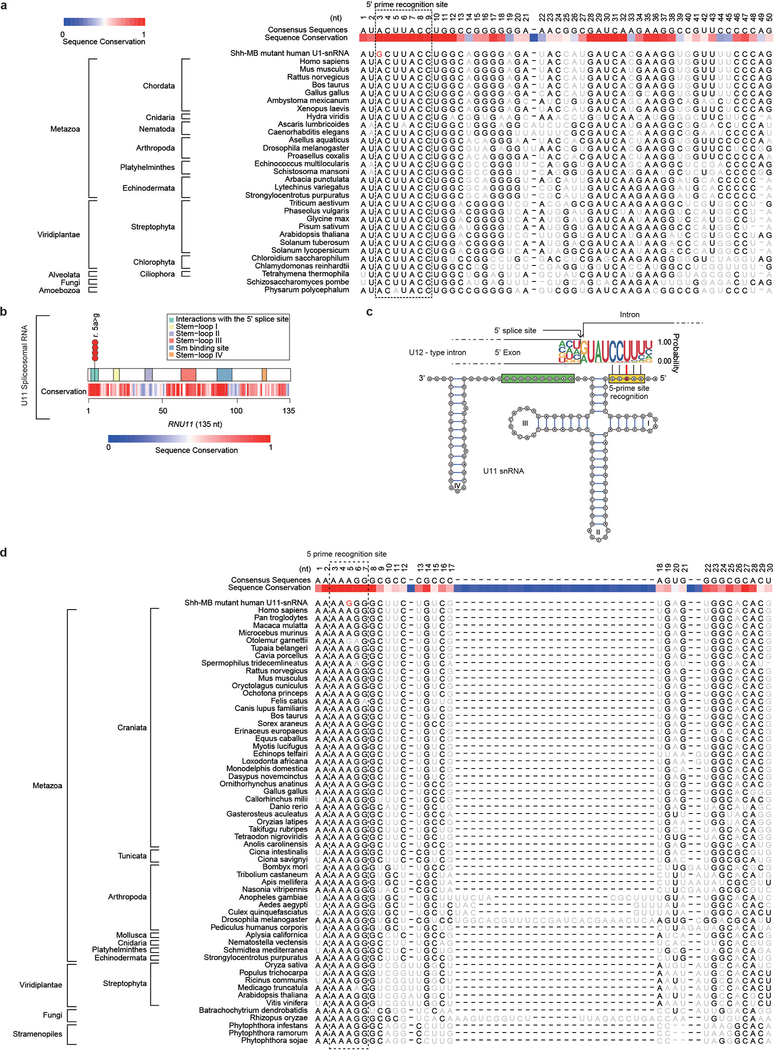
The cerebellar neuronal cancer medulloblastoma comprises four distinct molecular subgroups (Wnt, Shh, Group 3, and Group 4), each with its own distinct clinical, transcriptomic, and genetic make-up4–6. These four molecular subgroups can be further subdivided into molecular subtypes, including Shh-MB which comprises Shhα, Shhβ, Shhγ, and Shhδ7. Recently, non-coding SNVs have been discovered in the promoter regions of TERT and a handful of other loci, giving impetus to examine non-coding segments carefully8,9. Thus, we sought to explore the genomic landscape of MB, with a particular focus on non-coding regions. We analyzed whole-genome sequencing (WGS) of 114 MBs and observed a novel recurrent hotspot mutation of the non-coding U1-snRNA genes in 10 out of 114 cases (8.8%) (Fig. 1a; Extended Data Fig. 1; Supplementary Table 1, 2; see Methods). Hotspot mutations of U1-snRNA genes occur in the third nucleotide (r.3a>g), and are restricted to Shh-MB. Interestingly, hotspot mutations are localized within the 5′ splice site (SS) recognition sequence, which is ultra-conserved in eukaryotes through nearly one billion years of evolution (Fig. 1b and Extended Data Fig. 2a). The human reference genome (hg19), has four annotated U1-snRNA genes (RNU1–1, RNU1–2, RNU1–3, and RNU1–4) and three ‘pseudogenes’ (RNU1–27P, RNU1–28P, and RNVU1–18), all of which encode completely identical 164 base pair transcripts. In addition, there are >100 U1-snRNA pseudogenes spread across the genome, highly complicating their identification by mutation callers due to the inability to align short reads to any one individual U1-snRNA gene (Extended Data Fig. 3)10. We re-mapped sequence reads permitting multi-mapping, and successfully detected the U1-snRNA mutation in five additional cases (see Methods). We validated hotspot U1-snRNA mutations in an additional 40/227 MB cases from the International Cancer Genome Consortium (ICGC) (Supplementary Table 2–4). We also detected recurrent hotspot mutations of the U11-snRNA gene (RNU11) at the fifth nucleotide (r.5a>g), in the highly conserved 5′SS recognition sequence (total 4/341 cases, Extended Data Fig. 2b–d; Supplementary Table 2). Taken together, 51% (56/109) of Shh-MBs have at least one U1/U11 snRNA mutation (Fig. 2). The snRNA mutation significantly co-occurs with mutations of the TERT promoter and DDX3X (Supplementary Table 5,6). We assessed the U1-snRNA(r.3a>g) mutation across 2,442 samples from 36 cancer histologies from ICGC and found the mutation in only one sample (0.04%) – a lone pancreatic ductal adenocarcinoma (Supplementary Table 7). We conclude that U1-snRNA(r.3a>g) mutations are both highly recurrent, and extremely specific to Shh-MB.
Figure 1. – Highly recurrent mutations of the U1-snRNAs in Shh-MB.
a) Cartoon illustrating the number and subgroup specific distribution of somatic mutations in the U1-snRNA genes. U1-snRNA sequence conservation scores as determined by Rfam database.
b) Secondary structure of the mutant U1-snRNA. The red circle identifies the location of the hotspot mutation. The yellow and green rectangles indicate the 5′ splice site recognition site and the Sm protein binding site respectively. Numerals I to IV indicate stem-loops.
Figure 2. – Mutational repertoire of snRNA mutant Shh-MBs.
Genomic landscape of mutations in Shh-MBs (n = 109) with and without U1/U11 mutations. Odds ratios (red dots) of coexistence of U1 and U11 snRNA mutations with other somatic events are shown with 95% confidence interval. Arrowheads represent values out of axis range. Significantly correlated mutations are denoted in red (False-discovery-rate (FDR) < 0.1, asymptotic P-values from odd-ratio tests (H0: odds-ratio = 1, see Methods) with Benjamini and Hochberg adjustment for multiple testing.
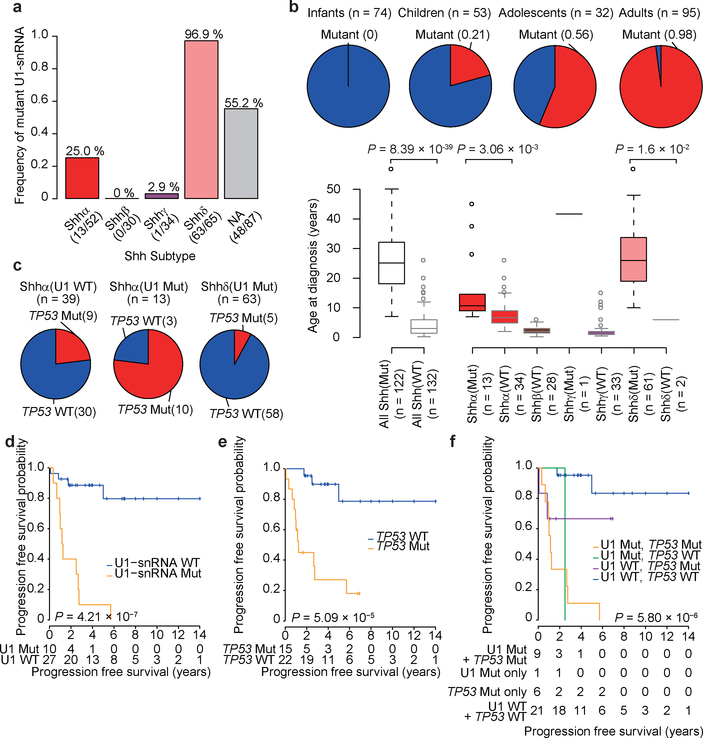
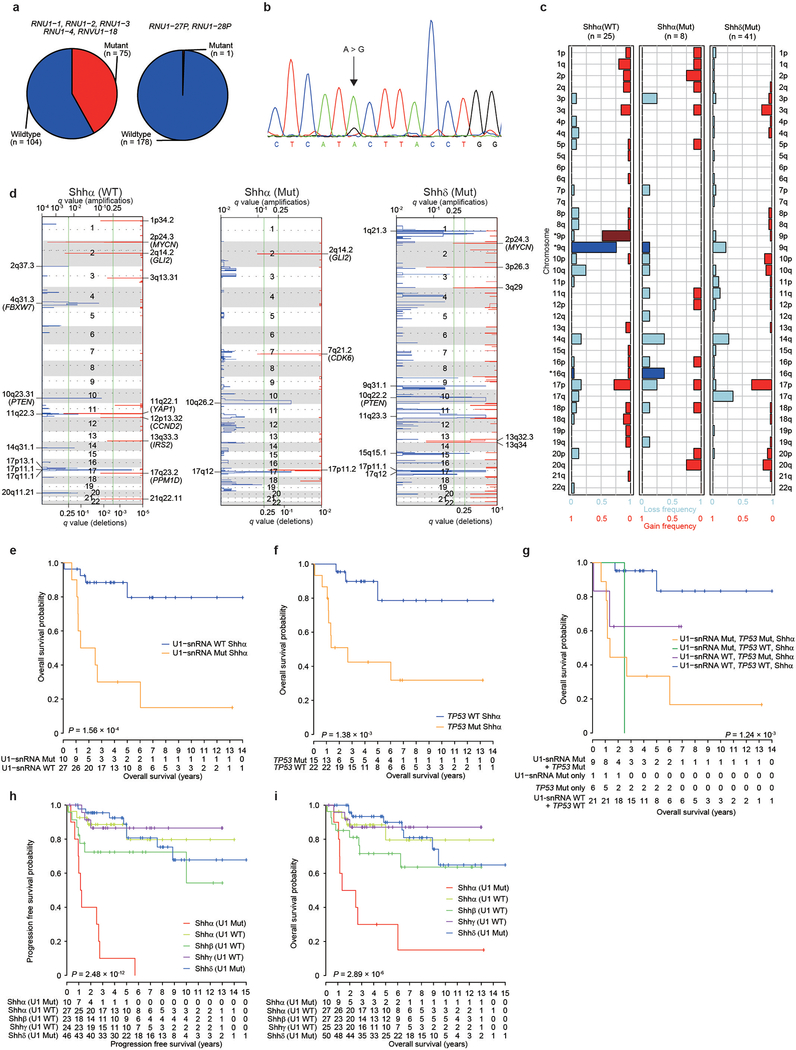
We validated the U1-snRNA(r.3a>g) mutation in an additional 159 cases of Shh-MB using allele-specific PCR. We detected mutations in the RNU1–27P and/or RNU1–28P genes, confirmed by Sanger sequencing, which were not identified by WGS (Extended Data Fig. 4a, b; Supplementary Table 8, see Methods). Combining the results of WGS and allele-specific PCR, we found that U1-snRNA(r.3a>g) mutations were largely restricted to adulthood (Shhδ - 97%) and adolescence (Shhα - 25%), and absent from infancy (Fig. 3a, b). This remains true if only age and not molecular subtype is accounted for. Indeed, most Shhα patients with TP53 mutations also have U1-snRNA(r.3a>g) mutations (Fig. 3c). Both broad and focal somatic copy number variations (sCNVs) are divergent between Shhα U1-wildtype, Shhα U1-mutants and Shhδ U1-mutants, supporting a model where they follow different genetic pathways to transformation (Extended Data Fig. 4c, d; Supplementary Table 9, 10). An analysis of focal CNVs demonstrates that Shhα U1-wildtype tumors have an increased incidence of CNVs that encompass several oncogenes and tumor-suppressor genes, including MYCN, CCND2, and PPM1D.
Figure 3. – Clinical and cytogenetic features of U1-mutant Shh-MBs.
a) Frequency of U1-snRNA mutations across Shh-MB subtypes. NA denotes samples where subtype is unknown.
b) Upper: frequency of U1-snRNA mutation by age group (n = 74 for infants, n = 53 for children, n = 32 for adolescents, n = 95 for adults). Bottom: age distribution by subtype (n = 47 for Shhα, n = 28 for Shhβ, n = 34 for Shhγ, n = 63 for Shhδ, n = 180 for unknow subtype) and U1-snRNA mutational status (n = 122 for mutant, n = 132 for wildtype). P-values were calculated by two-sided Wilcoxon-rank sum test. Boxplot center lines show data median; box limits indicate the interquartile range (IQR) from the 25th and 75th percentiles; lower and upper whiskers extend 1.5 times the IQR. Outliers are represented by individual points.
c) Frequency of TP53 mutation in U1-mutant and wildtype tumors.
d–f) Progression-free survival of Shhα stratified by mutational status of U1-snRNA(d) (n = 10 for mutant, n = 27 for wildtype), TP53 (e) (n = 15 for mutant, n = 22 for wildtype), or both (f) (n = 9 for both mutant, n = 1 for U1 mutation only, n = 6 for TP53 mutation only, n = 21 for both wildtype). P-values were determined using the two-sided log-rank test. + indicates censored cases.
A univariate log-rank analysis of both progression-free survival (PFS) and overall survival (OS) reveals that within Shhα both U1-snRNA(r.3a>g) and TP53 mutational status are each associated with a significantly poor outcome (Fig. 3d–f; Extended Data Fig. 4e–i). However, in a multivariate Cox regression analysis, TP53 mutations alone are no longer significant for PFS, whereas U1-snRNA(r.3a>g) confers a very strong risk for relapse (U1-snRNA(r.3a>g) hazard ratio (HR) 5.51 95% confidence interval (CI) 1.15–26.35, P=0.03, TP53 HR 3.01 95% CI 0.55–16.65, P=0.21). A similar trend was observed for OS (U1-snRNA(r.3a>g) HR 3.72 95% CI 0.74–18.87, P=0.11, TP53 HR 2.70 95% CI 0.46–15.88, P=0.27). This suggests that within Shhα, the combination of both a TP53 mutation and the U1-snRNA(r.3a>g) mutation is associated with an extremely poor prognosis.
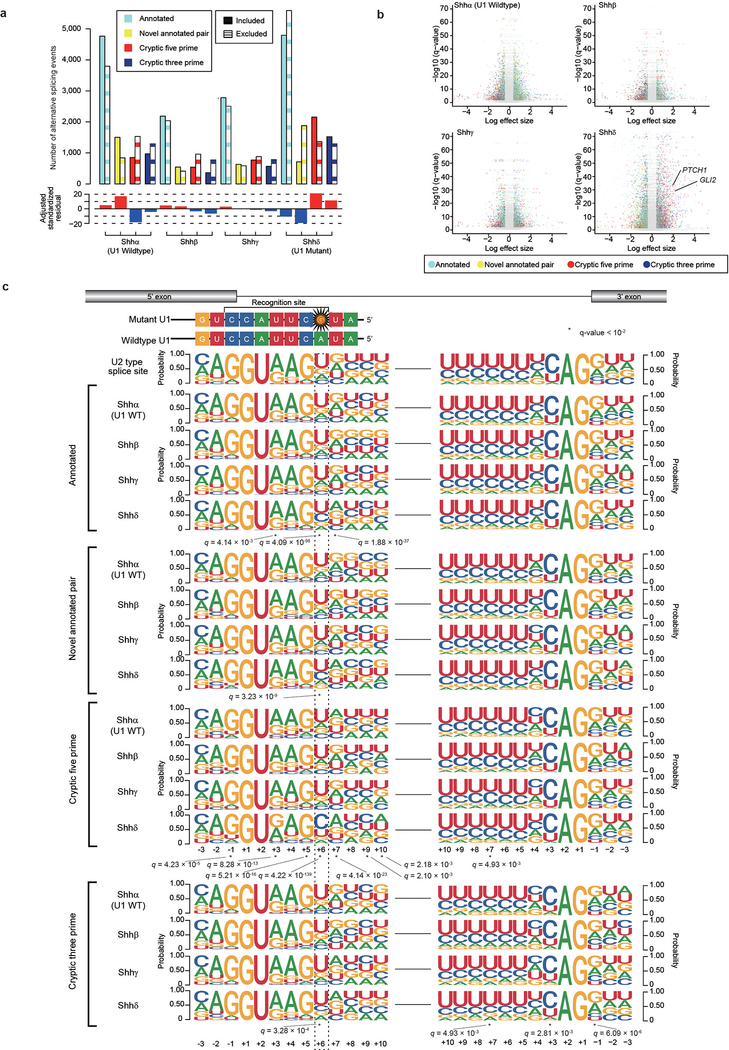
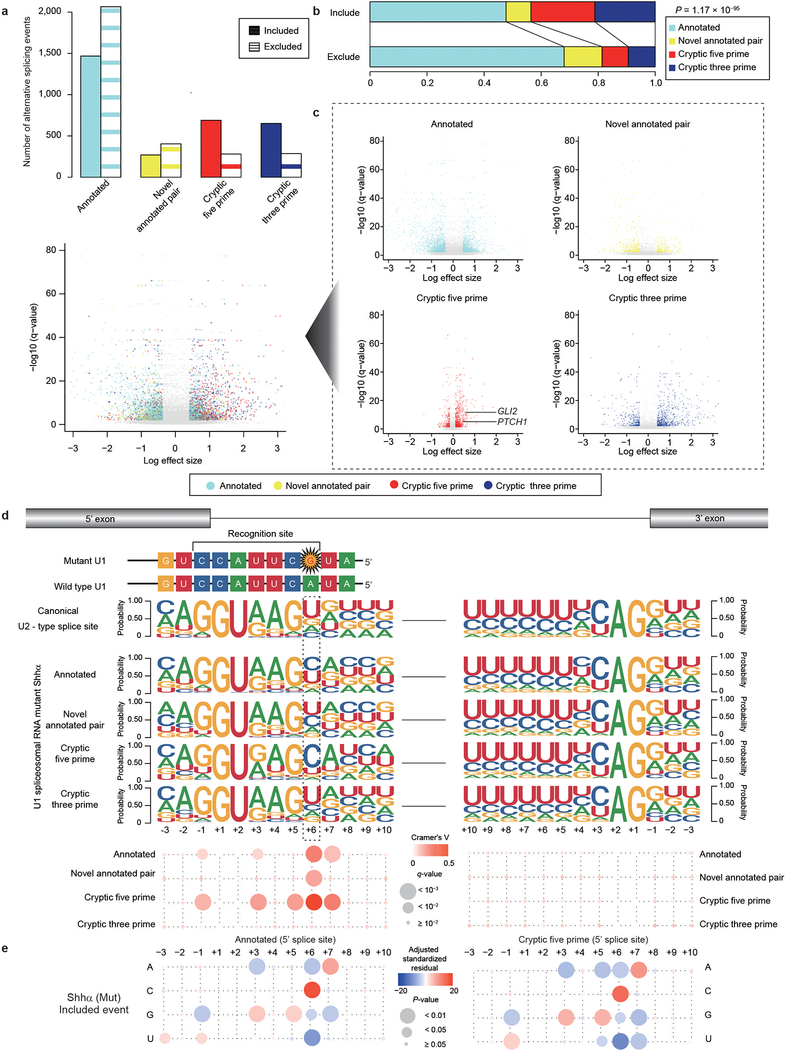
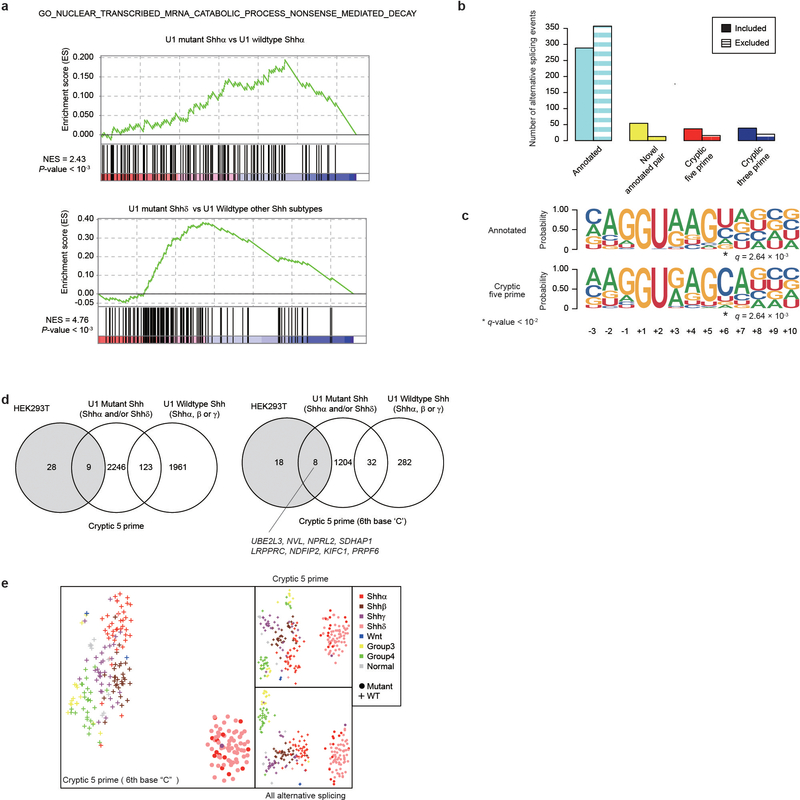
Intron-centric alternative splicing analysis using LeafCutter confirms that both U1-mutant Shhα and Shhδ have 2.5–3 times more alternative 5′ cryptic splicing events than Shh-MBs with wildtype U1-snRNA (Extended Data Fig. 5a, b, 6a–c; Supplementary Table 11)11. The U1-snRNA(r.3a>g) mutations would be predicted to affect the recognition of the 6th intronic nucleotide from the 5′SS, and indeed, cryptic 5′SSs recognized in U1-mutant Shh-MB demonstrate enrichment of a dominant ‘C’ base as opposed to the ‘T’ base observed in U1-wildtype tumors (Extended Data Fig. 5c and 6d, e). Pathway analysis of differentially expressed transcripts between U1-mutant, versus wildtype Shh-MB demonstrates an increase in nonsense mediated decay, consistent with destruction of aberrantly spliced transcripts (Extended Data Fig. 7a). To validate the effect of the U1-snRNA mutation, we transfected wildtype or mutant U1-snRNA(r.3a>g) vectors into human embryonic kidney 293T cells, and examined effects on splicing. Intron-centric analysis clearly demonstrates an enrichment of a ‘C’ base at the 6th intronic position, and a significant increase in the incidence of cryptic 5′ splicing events which do not overlap with U1-wildtype Shh (Extended Data Fig. 7b–d, Supplementary Table 12, 13).
Clustering based on significant alternative splicing events is clearly driven by U1-snRNA mutational status (Extended Data Fig. 7e, see Methods), with U1-mutant tumors segregated distinctly from the U1-wildtype tumors. We conclude that the U1-snRNA(r.3a>g) mutation has a profound effect on alternative splicing in affected tumors.
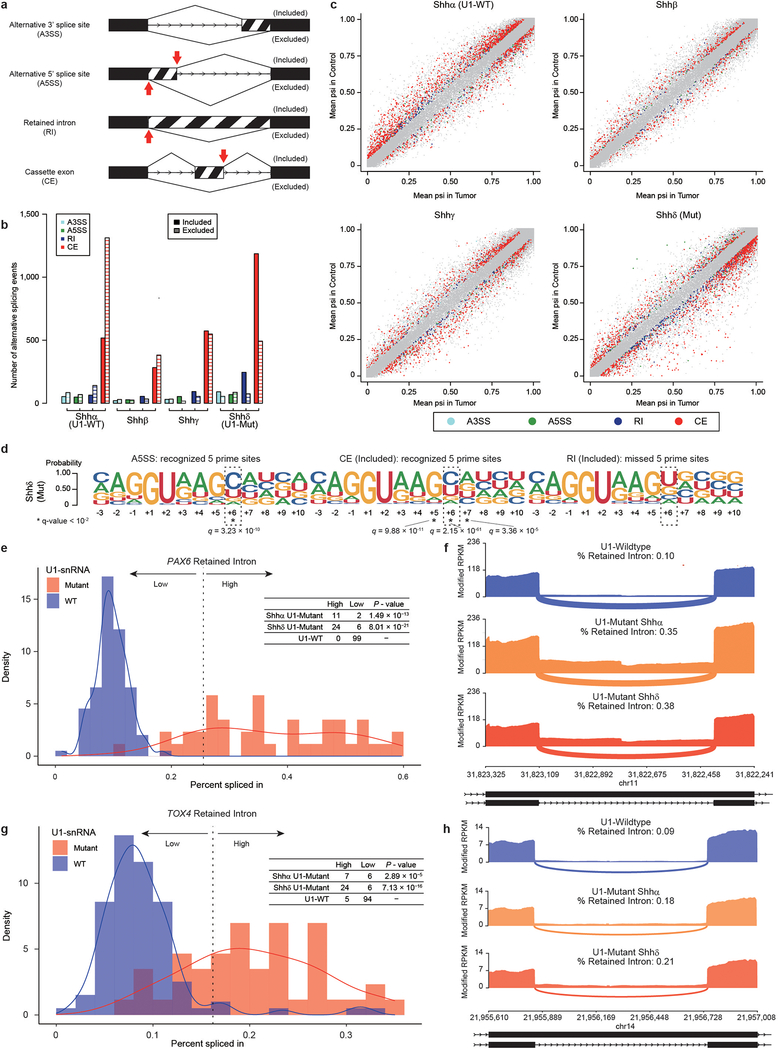
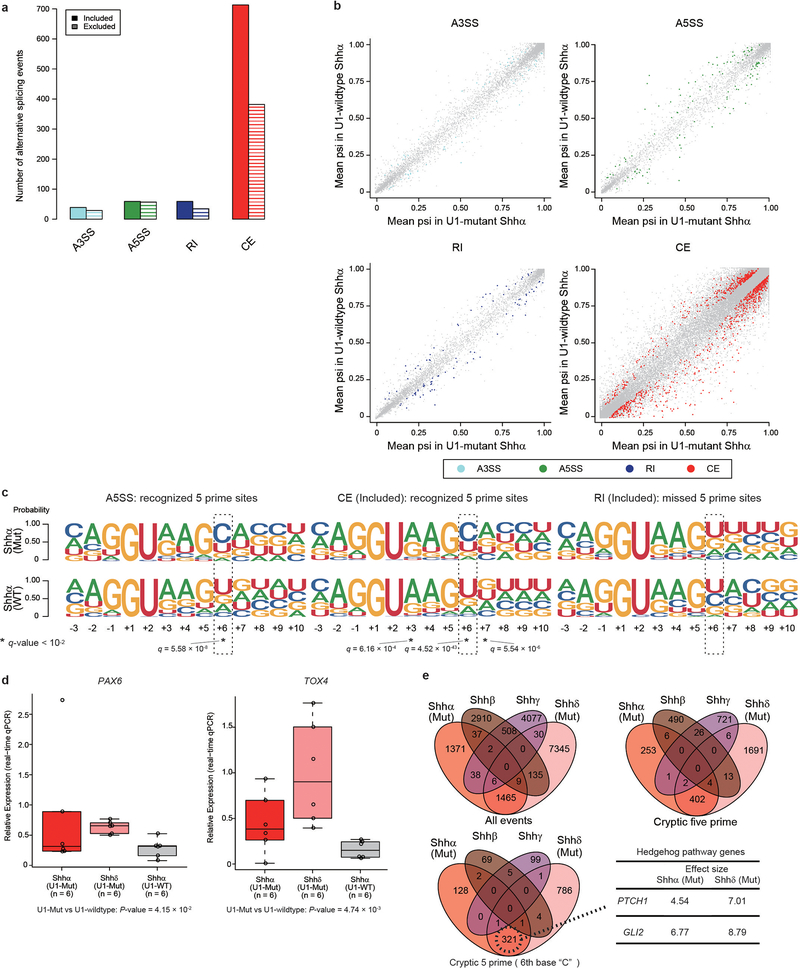
As a complementary approach, we conducted exon-centric alternative splicing analysis using rMATS12. We observed that U1-mutant Shh tumors have a higher incidence of cassette exons than U1-wildtype controls (Extended Data Fig 8a–c and 9 a, b; Supplementary Table 14). Similar to cryptic 5′ alternative splicing events, the dominant base at the 6th intronic base is ‘C’ (Extended Data Fig. 8d, 9c; Supplementary Table 15). In addition, an increase of retained introns (RIs) is observed in U1-mutant tumors. The 5′SS sequences of missed splice sites in RIs do not have a dominant ‘C’ at 6th nucleotide, but rather the canonical ‘T’. This latter result suggests a novel mechanism in which mutant U1-snRNA(r.3a>g) not only recognizes alternative 5′ SSs, but also inhibits the wildtype U1-snRNA from detecting canonical SSs resulting in their aberrant splicing. The RI event with the highest psi validated by real-time qPCR occurs in the gene PAX6, which undergoes frequent somatic mutation in Shh-MB, and a chromatin remodeling gene TOX4 (Extended Data Fig. 8e–h, 9d; Supplementary Table 16)13,14. The RI in both genes results in a frameshift, leading to loss of function. These data may support a model in which the U1-snRNA(r.3a>g) impedes normal splicing, leading to intron retention, and an mRNA frameshift.
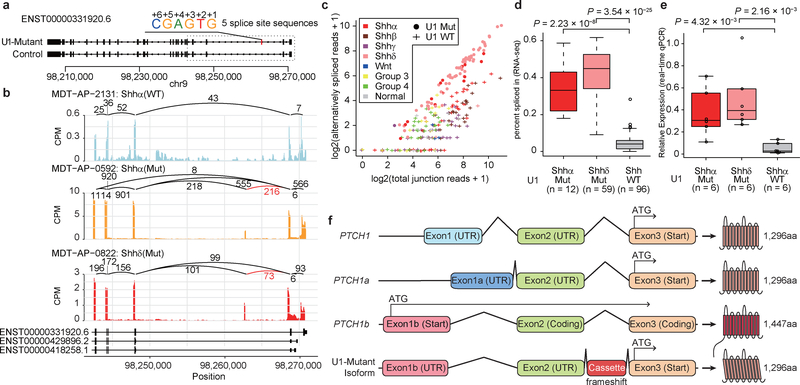
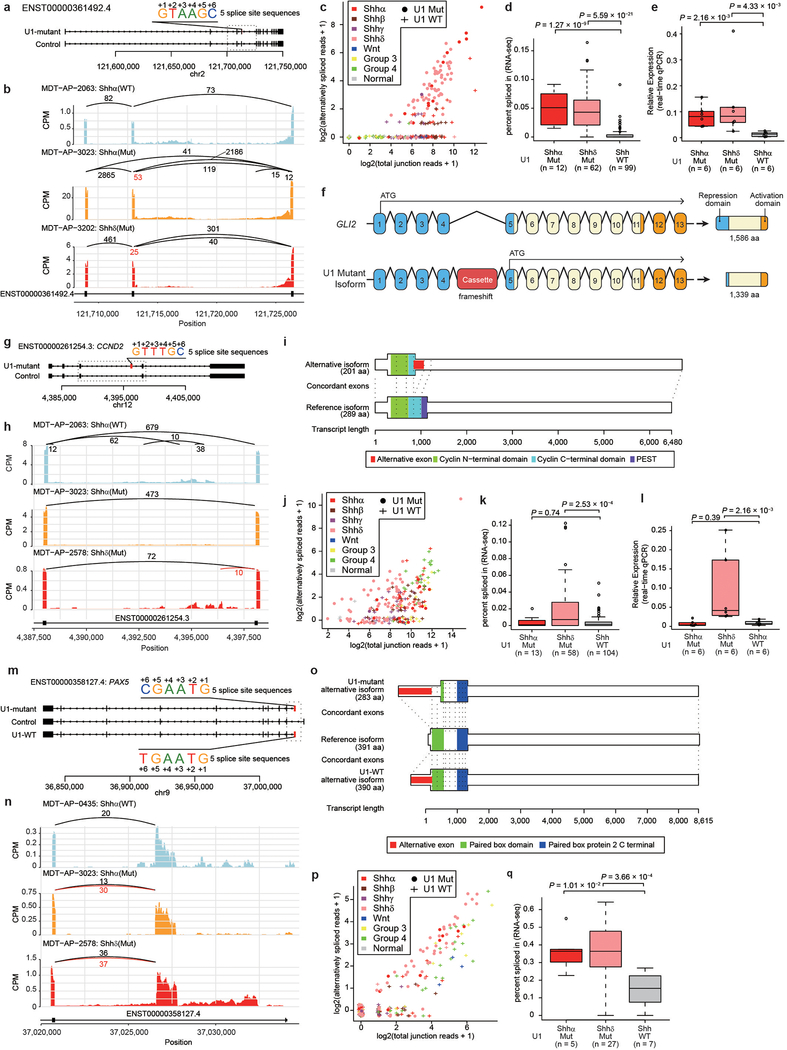
To detect pathogenic alternative splicing, we identified cryptic 5′ events with a ‘C’ base at the 6th intronic position shared by both U1-mutant Shhα and Shhδ tumors (Extended Data Fig. 9e; Supplementary Table 17,18). Fascinatingly, we detected cryptic splicing events with high effect sizes in both PTCH1 and GLI2, highly specific to both Shhα and Shhδ tumors carrying the U1-snRNA(r.3a>g) mutation as compared to wildtype U1-snRNA controls by both RNA sequencing and real-time qPCR (Fig. 4a–e). PTCH1 is known to have at least three different initial exons. Splicing mediated by the U1-snRNA(r.3a>g) mutant results in the inclusion of a cassette exon between exon 2 and 3, causing a frameshift, and therefore predicted translation from the ATG in exon 3 (Fig. 4f). It has been previously reported that loss of expression of the 1,447 amino acid isoform of PTCH1 results in de-repression of Hedgehog signaling15. Similarly, the U1-snRNA(r.3a>g) cassette exon in GLI2 is spliced between exon 4 and 5, resulting in a putative GLI2 protein lacking the repressor domain (Extended Data Fig. 10a–f). Physiological GLI2 protein has a repressor domain at its amino terminus, and constructs missing the amino terminus are much more potent at activating Hedgehog signaling than the full-length protein16.
Figure 4. – Aberrant splicing of Hedgehog signaling genes in U1-mutant Shh-MB.
a) Overview of cryptic alternative splicing of PTCH1 demonstrating the position of a cryptic cassette exon with the 5′ splice site sequence.
b) Sashimi-plot of splicing of PTCH1 in representative cases. The bar plot shows counts per million reads. Numbers enumerate junctional reads. Annotated exon tracks are shown below with genomic positions marked. Junctional reads specific to U1-mutants are in red.
c) Scatter plot comparing detected alternatively spliced read and total junction reads which shared 3 prime splice site. Jittering was performed for both values.
d) ‘Percent spliced in’ values by U1-mutant Shhα, U1-mutant Shhδ, and U1-wildtype Shh (all Shh subtypes). Boxplot center lines show data median; box limits indicate the IQR from the 25th and 75th percentiles; lower and upper whiskers extend 1.5 times the IQR. Outliers are represented by individual points. P-values were calculated using two-sided Wilcoxon-rank sum test.
e) Boxplot of fold changes in expression of the alternatively spliced isoform of PTCH1 as compared to the wildtype isoform of PTCH1 in subsets of Shh-MB as determined by real-time qPCR. Boxplot center lines show data median; box limits indicate the IQR from the 25th and 75th percentiles; lower and upper whiskers extend 1.5 times the IQR. Outliers are represented by individual points. Data represent means ± standard deviation. P-values were calculated using two-sided Wilcoxon-rank sum test.
f) Illustration of canonical isoforms and the cryptic alternative isoform of PTCH1. Putative translation start sites are indicated with an arrow. Resulting proteins (and size) are displayed for each isoform. UTR denotes an untranslated region. Amino acids are denoted aa.
Alternative splicing of the cell cycle gene CCND2, a known downstream target of Shh signaling that is recurrently amplified in Shh-MB, is detected in Shhδ U1-snRNA(r.3a>g) mutants, but not in Shhα (Extended Data Fig. 10g–l) 17,18. Curiously, focal amplifications of CDK6 are highly recurrent in Shhα U1-snRNA(r.3a>g) mutants, but not in Shhα U1-wildtype or Shhδ U1-snRNA(r.3a>g) mutants, suggesting convergence on dysregulation of the G1/S cell cycle checkpoint. The CCND2 alternative isoform is prematurely terminated, resulting in N-terminal sequences where the PEST domain is predicted to be deleted. Deletion of the PEST domain causes resistance to protein degradation, and impaired export from the nucleus, resulting in CCND2 accumulating in the nucleus to promote cell cycle progression19. PAX5, another known tumor suppressor gene is affected by cryptic 5′ alternative splicing in U1-snRNA(r.3a>g) mutants (Extended Data Fig. 10m–q). Both U1-mutant and U1-wildtype Shh-MBs express distinct cryptic isoforms. The cryptic isoform present in U1-wildtype Shh-MBs translates the complete DNA binding domain of PAX5. However, the cryptic exon (also called a poison exon20,21) present in U1-mutant Shh-MBs results in a stop codon, before the DNA binding domain. Mutations of PAX5 in cancer are typically concentrated in the DNA binding site22. Taken together, the data on alternative splicing of PTCH1, GLI2, CCND2, and PAX5 support a model in which cryptic alternative splicing mediated by mutant U1-snRNA(r.3a>g) functions as a driver in subsets of Shh-MB.
The U1-snRNA(r.3a>g) mutation is the most common SNV in MB. The restriction of these mutations not just to Shh-MB, but to the Shhα and Shhδ subtypes suggests a model in which either the specific cell of origin, the temporally specific microenvironment, or co-occurring mutations (i.e., TP53) are necessary for U1 to contribute to oncogenesis. While the almost universal occurrence of U1-snRNA mutation in Shhδ highly supports its role in tumor initiation, proof for the ongoing role of mutant U1-snRNA(r.3a>g) in tumor maintenance will await its knockdown in a tumor where it was the initiating genetic event.
Shhα patients with the U1-snRNA(r.3a>g) mutation are an extremely high-risk population that should be prioritized for the development of targeted therapies. Drugs are under development that directly target the spliceosome, which may show anti-tumor effects in cancers with spliceosomal mutations23. Loss of expression of specific genes through cryptic splicing or intron retention could create opportunities for synthetic lethal approaches. Finally, cryptic splicing in U1-mutant Shh-MB leads to a unique form of post-transcriptional hypermutation, which would be predicted to result in the expression of numerous cell surface neo-epitopes, which are never seen in healthy tissues, and which could be targeted using immunotherapies.
Methods
Subjects and materials
The study included two large cohorts of medulloblastomas from Toronto and International Cancer Genome Consortium (ICGC) (Extended Data Fig. 1). The Toronto cohort consisted of 294 cases (WGS 114 cases and RNA-seq 225 cases, overlapped 46 cases) which were collected at diagnosis after informed consent was obtained from subjects as part of the Medulloblastoma Advanced Genomics International Consortium. All patient recruitment and tumour sample collection was approved and in compliance with the ethical regulations of each of the following institutions: The Hospital for Sick Children, Seoul National University Children’s Hospital, The Children’s Memorial Health Institute, Mayo Clinic, The Chinese University of Hong Kong, John Hopkins University School of Medicine, Seattle Children’s Hospital, University of California San Francisco, McMaster University, Erasmus University Medical Center, Kitasato University School of Medicine, Fondazione IRCCS Istituto Nazionale Tumori, Emory University, Osaka National Hospital, Washington University School of Medicine, University of Calgary, Children’s Hospital of Pittsburgh, Hospital Pediatría CentroMé dico Nacional Century XXI, University of Debrecen, McGill University, Vanderbilt Medical Center, University of Colorado Denver, Istituto Giannina Gaslini, Université de Lyon. The whole genome sequence consists of 109 published3 and 5 unpublished. (Wnt, n = 2; Shh, n = 37; Group 3, n = 26; Group 4, n = 49). Sample were obtained as fresh frozen tissue from the time of diagnosis and stored at −80°C until processed for the purification of nucleic acids. Genomic DNA was isolated by incubation with proteinaseK overnight at 55°C followed by three sequential phenol extractions and ethanol precipitation. Messenger RNA library construction and sequencing were performed as previously described24. ICGC cohort consisted of 227 cases which were downloaded from ICGC under accession DACO-1036229.
Whole-genome sequencing
Whole genome sequencing (WGS) was performed at Canada’s Michael Smith Genome Science Centre at the BC Cancer Agency using the Illumina HiSeq 2000/2500 platform as previously described24.
Sequence Alignment of Whole Genome Sequencing Data
Whole genome sequencing reads were aligned to the human reference genome “hs37d5” by 1000 Genomes Project Phase II using Burrows-Wheeler Aligner (BWA) - MEM, version 0.7.8 with ‘-T 0’ parameter. Duplicates were marked using biobambam version 0.0.148. Sequencing coverages were calculated using GenomonQC software which is downloaded from Genomon-Project and shown in Supplementary Table 1.
Somatic Variant Calling
Somatic variants were called using eight variant callers: MuTect225, EBCall26, Varscan227, Strelka28, SomaticSniper29, Virmid30, Platypus31, and Seurat32.
MuTect2 was run using GATK v3.5.0 with the default setting. Candidate variants were filtered a panel of normal which was made by MuTect2 with ‘--artifact_detection_mode’ and GATK ‘CombineVariants’ function with ‘–minN 2’. EBCall v0.2.1 was run with the default setting. We used the following criteria, requiring P-value (by EBCall) <10−3, variant reads in Tumor ≥ 2 and variant reads in Normal ≤ 1. Varscan2 v2.4.3 was run with parameters ‘--strand-filter 1 –min-var-freq 0.08’. The results were filtered by ‘fpfilter’ function with the option ‘--dream3-settings’. Strelka v1.0.15 was run with default parameters. Virmid v1.1.0 was run with the option ‘-q 10’. Somatic Sniper v1.0.5.0 was run with the parameters ‘-Q 15 -q 1 -G -L’ and the results were filtered by the author’s recommendate filter using bam-readcount. The candidates with more than 0.03 of variant allele frequency in matched-normal sample are discarded. Platypus v0.8.1 was run with a default setting. Detected variants which passed the standard Platypus filtering criteria or showed “allele bias” were used. We used the following additional criteria, requiring likelihood (reference allele)/ likelihood (variant allele) <10−5 in tumor, likelihood (variant allele)/ likelihood (reference allele) <10−5 in matched control, variant reads in Tumor ≥ 2 and variant reads in Normal ≤ 1. Seurat v2.5 was run with the option ‘--indels’. We used variants which are called by at least two callers. Obtained results are filtered by ≤ 2 variants reads in matched-normal control calculated by realignment function of GenomonMutationFilter v0.2.1. Variants are annotated using ANNOVAR33. Correlation of U1 and U11 snRNA mutations with other somatic events were analyzed using R package “Epi” version 2.30. Asymptotic P-values from odds-ratio tests was calculated using twoby2 function followed by Benjamini and Hochberg adjustment for multiple testing.
Copy number calling for WGS
Copy number alterations were detected using Control-FREEC v10.3 with the following parameters: breakPointType=4, ploidy=”2,3,4”, step=10000, window=5000034.
Variant Calling of U1 and U11 snRNA genes
To explore mutations on low mappability regions, we first picked up reads from whole genome sequencing data on U1 and U11 snRNA genes and pseudogenes using samtools and biobambam. To accept multi-mapping, we employed STAR aligner35. To prevent gaps, we set the setting with ‘-scoreGap −20 --alignEndsType EndToEnd’. Mutations were called by EBCall with the same setting with WGS except for acceptance of secondary alignment. We used the following criteria, requiring P-value (by EBCall) <10−3, variant reads in Tumor ≥ 4, and variant reads in matched-control ≤ 1.
To evaluate exact loci of variant reads and multiple mutations of U1-snRNAs, we mapped variants reads to case specific reference again. First, we extracted all variant reads of U1-snRNA mutations (r.3a>g) with mate paired reads. Then, we constructed case specific reference which included U1-snRNA hotspot mutation (r.3a>g) and case specific germline variants detected from extracted variant reads using samtools mpileup function. Variant reads were mapped again on the case specific reference using bwa-mem with the same setting with WGS analysis. Using bam files with case specific reference, we called variants on flanking regions of the U1-snRNA hotspot mutation (r.3a>g) by samtools mpileup function to evaluate multiple mutations. No samples have recurrent variant reads. Therefore, we conclude that U1-snRNA mutation occur in one allele. To interpret the mutated genes, we extracted consecutive consensus sequence of upstream U1-snRNA sequences with two or more than two supported reads. Then, the consensus sequence was mapped using BLAST software to U1-snRNA genes and pseudogenes with 1,000bps upstream sequences from hg19 reference. Because of many variants and highly similarity in the upstream sequences, we cannot detect exact positions of mutated reads except for RNVU1–18 mutations. Therefore, we classified U1-snRNA mutations into 1) RNU1 genes (RNU1–1, RNU1–2, RNU1–3, or RNU1-4), 2) RNVU1–18, and 3) RNU1 pseudogenes (RNU1–27P or RNU1–28P) based on the similarity of sequences of flanking region. Finally, we performed manual review of detected mutations with Integrative Genome Viewer (IGV)36. Detected mutations are shown in Supplementary Table 2–4.
Secondary structure of U1 and U11 snRNAs
The conservation scores of U1 (RF00003) and U11 (RF00548) snRNAs are downloaded from Rfam37. U1 and U11 sequences of other species are downloaded from seed sequences from Rfam. The secondary structures are described based on the consensus structure in Rfam using VARNA software38. U2-type intron and U12-type intron sequences are downloaded from SpliceRack39.
rhAmp Genotyping
Genomic DNA from primary tumours was tested using custom rhAmp™ SNP assays (Integrated DNA Technology). Briefly, locus and allele specific primers were generated individually for RNU1_Batch (RNU1–1, RNU1–2, RNU1–3, RNU1–4, and RNVU1–18) and RNU1_Pseudo (RNU1–27P and RNU1–28P). Assays were run in technical triplicate in 5μL volume (DNA concentration is at least 5ng/μL), with control gBlocks for wildtype, mutant and heterozygous genotypes. Reporter mix used Yakima Yellow (mutant) and FAM (wildtype) dyes as well as ROX dye for passive reference. Plates were read on the StepOnePlus (Applied Biosystems) RT-PCR machine, and genotypes called using the StepOne v2.3 software. The primer sequences are available in Supplementary Table 19.
RNA sequencing
Sequencing reads are mapped by STAR version 2.5.1b on fasta which includes the human reference genome “hs37d5” by 1000 Genomes Project Phase II, spike-in sequences of profile C1_2 ERCC spike-in concentrations used for C1 fluidigm and Caltech profile 3 spike-ins by ENCODE with the option ‘--outFilterMultimapNmax 20 --alignSJoverhangMin 8 --alignMatesGapMax 200000 --alignIntronMax 200000 --alignSJDBoverhangMin 10 --alignSJstitchMismatchNmax 5 −1 5 5 --outSAMmultNmax 20 --twopassMode Basic’35. Mapping results are shown in Supplementary Table 20.
Intron-Centric Alternative Splicing Analysis
Intro-Centric alternative splicing analysis was performed using LeafCutter11. Leafcutter is an annotation-free quantification method. Intron clustering was run with minimum required read = 50 and max_intron= 500000. LeafCutter was run with the option “-g 0”. Each 30 cases of Shh subtype was compared with other Shh subtype samples, five adult brain, and four fetal brain with default setting. Shhα U1-snRNA(r.3a>g) mutants (n = 13) were compared with Shhα U1-snRNA wildtype cases (n = 39). Obtained results were filtered by q-value of each cluster < 0.01 where at least one absolute effect size calculated by LeafCutter is more than 1.5. Each event was annotated by LeafViz with GENCODE v19 gtf file. Then, events with unknown strand directions are not analyzed. Logo sequences are built using R package “ggseqlogo” v0.140. Statistical analysis for comparison of sequences are performed by Chi-square test. Adjusted standardized residual was calculated by Haberman’s method. We selected cryptic 5´ splicing events with a C base at the sixth base in the intron. Subsequently, we further prioritized alternatively spliced genes which are reported as recurrent genetic aberrations in Shh-MB3,41, are transcriptionally up-regulated or down-regulated in both the Shhα and Shhδ subtypes7, or registered as tier 1 in Cancer Gene Census.
t-SNE analysis is performed using R package “Rtsne” v0.13. Analyzed events are choose with the following, 1) Significant events in at least one Shh subtype. 2) Length of cluster of junction reads are same among all subtype. Percent Spliced In (PSI) is calculated by the number of junction reads of alternative splicing events divided by the total number of junction reads in a cluster. t-SNE is run with a default setting along with 3 Wnt, 20 Group 3, and 22 Group 4 medulloblastomas which are used for our previous study42.
Exon-Centric Alternative Splicing Analysis
Exon-Centric alternative splicing analysis was performed using rMATS version 4.0.112. rMATS was run with default setting with GENCODE v19 for alternative 3 splice site, alternative 5 splice site, retained intron, and skipped exon. We filtered the events with FDR < 0.01 and change of splicing inclusion calculated by rMATS > 0.05. Sashimi_plot was described using MISO v0.5.443.
Gene set enrichment analysis of nonsense mediated decay
We counted reads using GENCODE v19 gtf file and htseq version 0.6.0 with the setting “--stranded reverse -m union”. Differential expression analysis was performed using DESeq2 version 1.16.1 with the default setting after extracting genes expressed at >5 counts per million in at least 20% of cases. We performed two comparison, which are U1-mutant Shhδ (n = 30) vs U1-wildtype other Shh subtypes (n = 90) and U1-mutant Shhα (n = 13) vs U1-wildtype Shhα (n = 39). Gene set enrichment analysis (GSEA) for differentially expressed genes was performed using pre-ranked gene lists ordered by -log10(P-value) multiplied by +1 for up regulation or −1 for down regulation with gsea v3.0. We used two datasets for a pathway of nonsense mediated decay, “GO NUCLEAR TRANSCRIBED MRNA CATABOLIC PROCESS NONSENSE MEDIATED DECAY” from C5 gene set and “REACTOME NONSENSE MEDIATED DECAY ENHANCED BY THE EXON JUNCTION COMPLEX” from C2 gene set.
TP53 mutation status
Germline mutations of TP53 were analyzed using EBCall v.0.2.1. EBCall was run with the default setting. We used the following criteria, requiring P-value (by EBCall) <10−3, 90% posterior quantile calculated by EBCall > 0.3. The results were annotated using ANNOVAR.
Mutation call from RNA-seq was run using GATK v3.8.0. Adding read groups and flagging duplicate reads were performed using Picard tool v2.18.0. Then, we split reads into exon segments using GATK with the setting ‘-rf ReassignOneMappingQuality -RMQF 255 -RMQT 60 -U ALLOW_N_CIGAR_READS’. Base recalibration was performed using GATK. Mutation call was performed using ‘HaplotypeCaller’ function of GATK with the setting ‘-dontUseSoftClippedBases -stand_call_conf 20.0’. Variants were filtered using ‘VariantFiltration’ function of GATK with the setting ‘-window 35 -cluster 3 -filterName FS -filter “FS > 30.0” -filterName QD -filter “QD < 2.0”‘. The variants were filtered using a panel of normal which was generated from nine normal brain samples. Sanger sequencing was performed in the previous study44. We discarded the mutations which showed 0.01 or more frequency in 1000 Genomes v5b or ESP-6500, or dbSNP138.
Survival analysis
Overall survival and progression-free survival were evaluated using the log-rank with R package “survival” version 2.40.1. Overall survival was defined as the time from date of surgery to death or date of last follow-up and progression-free survival as the time from date of surgery to first event (progression or relapse) or date of last follow-up.
Pan-cancer analysis
We analyzed 2,442 cases across 36 tumor types from ICGC. The hotspot mutations are analyzed with the same method described above except for mapping tool. For pan-cancer data, we use bowtie aligner instead of STAR45.
SNP6 Copy Number analysis
Array files were downloaded Gene Expression Omnibus (GEO) under GSE37385, and the relevant Affymetrix SNP6 arrays were extracted. Affymetrix Power Tools v1.18.2 was used to process and normalize the probe intensities to generate Log R Ratio (LRR) and B Allele Frequency (BAF) using the PennCNV-Affy pipeline46. The affygw6.hg19.pfb file was used to map the probes onto the hg19 genome. All other parameters were left on default.
The resulting probe level LRR and BAF were taken into ASCAT v2.4.347. GC wave correction was then performed, followed by predicting germline genotypes, finally leading to running the ASCAT algorithm to determine the copy number values for each genomic region as well as the overall ploidy and purity of the sample. Samples whose model fit was less than 80% failed their ASCAT processing stage. Log ratios for each segment were calculated by using the copy number of each segment as well as the average ploidy of the sample, according to the equation:
Adjacent segments whose log rations differed by less than 0.25 were then merged using their size weighted mean:
Copy number states were assigned to each segment based on their log ratio and their ploidy values, according to the Supplementary Table 21. Broad copy number changes are defined as in 75% or more of chromosome arm in size. Focal copy number variants were analyzed using GISTIC v.2.0.2348. GISTIC was run with the setting ‘-ta 0.25 -td 0.3 -js 10 -brlen 0.7 -gcm “extreme” -armpeel’.
RT-PCR and qPCR analysis
RNA was obtained for 18 patient samples which has more than 2 FPKM values of targeted genes from our larger cohort (6 U1-Wildtype Shhα, 6 U1-mutant Shhα, 6 U1-mutant Shhδ). cDNA was synthesized using SuperScript III (ThermoFisher 18080400). PCRs were performed with cDNA and Taq polymerase using 35 cycles, and products run on a 2% agarose gel. qPCRs were performed using SYBR-Green with ROX (ThermoFisher 11744500), two-step at 35 cycles. Calculation of ΔΔCT was done comparing mutant isoform to WT isoform expression. The primer sequences are available in Supplementary Table 19.
Generation of a lentiviral vector for the expression of U1 r.3a>g
The pLKO.1-puro U6 sgRNA BfuAI stuffer lentiviral vector (Addgene #50920) was modified by removing the internal U6 promoter (between NdeI and EcoRI), and it was replaced by the U1 locus, including 393 bases of internal native U1 promoter, the U1 sequence, and 39 bases of 3’-flanking region using the following oligonucleotides (5’-GTCGAGAATTCTTGGCGTACAGTCTGTTTTTG and 5’-CTATCATATGTAAGGACCAGCTTCTTTGGGA). The PCR products were digested with NdeI and EcoRI, and cloned in the modified pLKO.1 plasmid. The r.3a>g mutation was introduced by site-directed mutagenesis. All plasmids were verified by Sanger sequencing.
Exogenous expression of the U1 r.3a>g mutation
Human embryonic kidney 293T (HEK-293T) cells were grown in DMEM, 10%FBS, 1%PSG. For exogenous expression of U1-snRNA, HEK-293T cells (5 × 10⁶ cells) were cultured in 10 cm plates and transfected using Lipofectamine Plus (Invitrogen) with 2 μg of either pLKO.1-U1wt (containing the wild-type U1 locus) or pLKO.1-U1r.3a>g (containing the r.3a>g mutation) in duplicate. Twelve hours after transfection the medium was replaced with complete media, and 48 hours later total RNA was extracted with the Trizol method.
Verification of the expression of the U1 r.3a>g mutation
Rapid amplification of cDNA ends (RACE) was performed using 1 μg of total RNA from HEK-293T cells transfected with either pLKO.1-U1wt or pLKO.1-U1r.3a>g following the recommendations of the manufacturer (Sigma-Aldrich 3353621001), and the following specific oligonucleotides (U1-RACE-SP1: 5’- CAGGGGAAAGCGCGAACGCAGT and U1-RACE-SP2: 5’- CCCACTACCACAAATTATGC). A single amplification band of the expected size (160 bps) was excised from the gel, purified and sequenced with the internal oligonucleotide U1-RACE-SP2.
Sequence analyses of Exogenous expression analysis
Messenger RNA library construction was performed based on oligo dT-based mRNA isolation using NEBNext® Poly(A) mRNA Magnetic Isolation Module. RNA Sequence was performed on NextSeq 550 using 100-bp paired-end mode. Mapping and intron clustering were performed with the same methods described above. LeafCutter was run with the option “-g 0 -i 2” and the obtained results were filtered by q-value of each cluster < 0.1 where at least one absolute effect size calculated by LeafCutter is more than 1.5.
Data availability
Sequencing data have been deposited in the European Genome-Phenome Archive (EGA) and Gene Expression Omnibus (GEO): RNA-seq (EGAD00001001899, and EGAD00001004958), whole genome sequence (EGAD00001003125 and EGAD00001004347) and RNA-seq of exogenous expression analyses (GSE128005).
Extended Data
Extended Data Fig. 1. – Overview of analyzed cohorts and methods.
a) The detection methods for U1-snRNA mutations by each cohort and comparison methods for alternative splicing analysis. b) Cohort specification. c) Subgroup distribution of whole genome sequencing cohorts.
Extended Data Fig. 2. – U11-snRNA mutations and conservation of U1 and U11 snRNA genes across evolution.
a) Seed sequences of the U1-snRNA obtained from the Rfam database demonstrates high level conservation across a variety eukaryotic species, particularly at the site of the Shh-MB mutation. The consensus sequence, and first 50 nucleotides of reference sequences are included for comparison. Grey indicates nucleotide differences, and red identifies the Shh-MB hotspot mutation.
b) Cartoon illustrating the number of somatic mutations in the U11-snRNA genes. U11-snRNA sequence conservation scores as determined by Rfam database.
b) Secondary structure of the mutant U11-snRNA. The red circle identifies the location of the hotspot mutation. The yellow and green rectangles indicate the 5′ splice site recognition site and the Sm protein binding site respectively. Numerals I to IV indicate stem-loops.
d) Seed sequences of the U11-snRNA obtained from the Rfam database demonstrates high level conservation across a variety eukaryotic species, particularly at the site of the Shh-MB mutation. The consensus sequence, and first 30 nucleotides of reference sequences are included for comparison. Grey indicates nucleotide differences, and red identifies the Shh-MB hotspot mutation.
Extended Data Fig. 3. – High levels of genomic conservation surrounding human U1-snRNAs complicate the specific PCR amplification of any one individual locus.
a) Genomic locations of the four expressed U1 spliceosomal RNA genes (on Chromosome 1p, red), and 136 pseudogenes across the H. Sapiens genome as indicated. Three pseudogenes with sequences identical (hg19) to the expressed U1 genes are indicated in orange.
b) Average mapping quality of bwa-mem and coverage of each expressed U1 and U11 spliceosomal RNA genes from WGS from germline samples of medulloblastoma patients are illustrated (n = 341). Blue bars represent Alignability of 100mers by GEM from ENCODE/CRG. Scales of >1,000 bases upstream and downstream are logarithm 10. Red bar indicates the gene body.
c) Average number of multi-mapped reads overlapped for each gene pair by STAR aligner. Heatmap shows the average number of mapped reads across WGS from germline samples of medulloblastoma patients (n = 341).
d) Sequence similarity of U1-snRNA genes, U1-snRNA pseudogenes with identical 164 bps, and U11-snRNA gene. The numbers in each square and heatmap indicate identity scores and bit scores calculated by blast software. Blank indicates no hit found.
Extended Data Fig. 4. – Allele-specific rhAmp SNP PCR of RNU1 loci, significant copy number changes in U1- mutant versus U1- wildtype Shh-MB and prognostic analysis.
a) The frequency of any U1-snRNA mutation by RNU1_Batch primer set (RNU1–1, RNU1–2, RNU1–3, RNU1–4, and RNVU1–18) (left) and RNU1_Pseudo primer set (RNU1–27P and RNU1–28P) (right).
b) Hotspot mutations of RNU1–27P/RNU1–28P U1-snRNA pseudogenes as confirmed by Sanger sequencing.
c) Broad copy number aberrations in U1-wildtype Shhα (n = 25), U1-mutant Shhα (n = 8), and U1-mutant Shhδ (n = 41). Dark blue and dark red bars, as well as asterisks, identify statistically significant regions comparing Shhα U1-mutant versus wildtype (P < 0.05, two-sided Fisher’s exact test).
d) Significant focal copy number aberrations in U1-wildtype Shhα (n = 25), U1-mutant Shhα (n = 8), and U1-mutant Shhδ (n = 41) illustrate significant genomic differences between U1-wildtype and U1-mutant cases. Candidate target genes within the corresponding loci are indicated. q-values were calculated by GISTIC see Methods.
e–g) Overall survival of Shhα stratified by mutational status of U1-snRNA mutation (n = 10 for mutant, n = 27 for wildtype) (e), TP53 (n = 15 for mutant, n = 22 for wildtype) (f), or both (n = 9 for both mutant, n = 1 for U1 mutation only, n = 6 for TP53 mutation only, n = 21 for both wildtype) (g). P-values were determined using the two-sided log-rank test. + indicates censored cases.
h, i) Progression-free survival (h) and overall survival (i) stratified by U1-snRNA mutation and Shh subtypes (n = 10 for U1-mutant Shhα, n = 27 for U1-wildtype Shhα, n = 23 for U1-wildtype Shhβ, n = 24 for U1-wildtype Shhγ, n = 46 for U1-mutant Shhδ). P-values were determined using the two-sided log-rank test. + indicates censored cases.
Extended Data Fig. 5. – Intron-centric analysis of Shhδ medulloblastomas.
a) Quantitation of alternative splicing events by Shh subtype as detected by intron-centric alternative splicing analysis (n = 30 each subtype). Bar plot shows adjusted standardized residual of included alternative splicing events, of which positive values indicate relatively higher number, and negative values indicate relatively lower number among subtypes.
b) Volcano plots of alternative splicing events (n = 30 each subtype). Significant events (FDR < 0.01 and absolute log effect size > 1.5 calculated by Leafcutter see Methods) are illustrated by color. Alternative splicing events of PTCH1 and GLI2 with the highest effect size are annotated.
c) Splice site sequences of included alternative splicing events by subtype (n = 30 each subtype). Asterisk denotes nucleotide sites with q-value < 10−2 (Chi-Squared Test and BH Method).
Extended Data Fig. 6. – Intron-centric analysis of Shhα medulloblastomas.
a,b) Quantitation (a) and proportion (b) of alternative splicing events between U1-mutant Shhα medulloblastoma (n = 13), and U1-wildtype Shhα medulloblastoma (n = 39) as detected by intron-centric alternative splicing analysis. P-value was calculated by Chi-Squared Test.
c) Volcano plots of alternative splicing events (n = 13 for U1-mutant Shhα, n = 39 for U1-wildtype Shhα). X axis shows the difference of PSI (percent spliced in) calculated by Leafcutter. Significant events (FDR < 0.01 and absolute log effect size > 1.5 calculated by Leafcutter, see Methods) are illustrated by color.
d) Splice site sequences of included alternative splicing events in U1-mutant Shhα subtype (n = 13 for U1-mutant Shhα, n = 39 for U1-wildtype Shhα). Size and color for each circle indicate the q-values and Cramer’s V values for each nucleotide position (q-values were calculated by Chi-square Test and BH method, the precise values were described in Supplementary Table 11).
e) Residual analysis of 5′ splice site sequences of Annotated and Cryptic 5′ alternative splicing (n = 13 for U1-mutant Shhα, n = 39 for U1-wildtype Shhα). The size and color for each circle denote the two-sided P-value, and adjusted standardized residual calculated by Haberman’s method. The precise values were described in Supplementary Table 11.
Extended Data Fig. 7. – Nonsense mediated decay pathway in U1-mutant Shh-MB and exogenous expression analyses.
a) Enrichment plots of “GO NUCLEAR TRANSCRIBED MRNA CATABOLIC PROCESS NONSENSE MEDIATED DECAY” by GSEA between U1-mutant Shhδ (n = 30) and U1-wildtype other Shh subtypes (n = 90) and U1-mutant Shhα (n = 13) and U1-wildtype Shhα (n = 39). P-values were calculated gsea see Methods.
b) Quantitation of alternative splicing events between U1-mutant HEK-293T and U1-wildtype HEK293T as detected by intron-centric alternative splicing analysis.
c) Splice site sequences of included alternative splicing events in U1-mutant HEK-293T. Asterisk denotes nucleotide sites with q-value < 10−2 (Chi-Squared Test and BH Method).
d) Comparison of the extent of overlap between detected alternative splicing events by U1-mutant Shh (either of Shhα or δ), U1-wildtype Shh (either of Shhα, β or γ) and HEK293T with U1-Mut exogenous expression. (Left) alternatively spliced events with cryptic 5 prime sites, and (Right) alternatively spliced events with cryptic 5 prime sites and ‘C’ base at 6th intron.
e) Alternative splicing signatures by t-SNE analysis. Left: The percent spliced-in (psi) values of detected cryptic 5′ alternative splicing events, with a ‘C’ nucleotide at the 6th base in the intron from 5′ splice site. Right Upper: psi values of all cryptic 5′ alternative-splicing events. Right Lower: psi values of all alternative splicing events.
Extended Data Fig. 8. – Retained introns inactivate tumor suppressor genes in U1-snRNA(r.3a>g) mutant tumors.
a) Illustration of the different types of alternative splicing events analyzed by rMATS (n = 30 each subtype). Red arrows indicate expected 5′ prime sites recognized by the mutant U1-snRNA.
b) Quantitation of alternative splicing events by Shh subtype, as detected by exon-centric alternative splicing analysis.
c) Scatter plots of alternative splicing events (n = 30 each subtype). X axis shows the difference of PSI (percent spliced in) calculated by rMATS. Different types of significant events (FDR < 0.01 and absolute differential PSI > 0.05 calculated by rMATS see Methods) are illustrated by different colors as annotated.
d) Splice site sequences of alternative five prime splice site, included cassette exon (CE) and included retained intron (RI) events in U1-snRNA mutant Shhδ (n = 30). Each event corresponds to a red arrow cartoon in ‘a’. Asterisk denotes nucleotide sites with q-value < 10−2 (Chi-Squared Test and BH Method).
e) Distribution of percent spliced in for PAX6 based on U1-snRNA mutation status (n = 13 for Shhα U1-mutant, n = 30 for Shhδ U1-mutant, n = 99 for U1-wildtype Shh (n = 90) and normal brain tissue (n = 9)). Dashed line defines threshold that divides the dataset into two groups (k-means method). Table displays number of samples above the threshold (high) or below (low) based on mutational status. P-value is calculated using two-sided Fisher’s exact test compared to U1-wildtype samples. U1-snRNA Mutant samples are indicated in pink, and wildtype samples in blue.
f) Sashimi-plot of splicing of PAX6 based on mutational status determined by exon-centric alternative splicing analysis (rMATS). The bar plot shows modified fragments per kilobase per millions mapped (mFPKM). Numbers enumerate average junctional reads across all samples. Annotated exon tracks are shown below with genomic positions marked.
g) Distribution of percent spliced in for TOX4 based on U1-snRNA mutation status status (n = 13 for U1-mutant Shhα, n = 30 for U1-mutant Shhδ, n = 99 for U1-wildtype Shh (n = 90) and normal brain tissue (n = 9)). Dashed line defines threshold that divides the dataset into two groups (k-means method). Table displays number of samples above the threshold (high) or below (low) based on mutational status. P-value is calculated using two-sided Fisher’s exact test compared to U1-wildtype samples. U1-snRNA mutant samples are indicated in pink, and wildtype samples in blue.
h) Sashimi-plot of splicing of TOX4 based on mutational status determined by exon-centric alternative splicing analysis (rMATS). The bar plot shows modified fragments per kilobase per millions mapped (mFPKM). Numbers enumerate average junctional reads across all samples. Annotated exon tracks are shown below with genomic positions marked.
Extended Data Fig. 9. – Exon-centric analysis of Shhα medulloblastomas and overlapped splicing events.
a) Quantitation of alternative splicing events between U1-mutant Shhα medulloblastoma, and U1-wildtype Shhα medulloblastoma, as detected by exon-centric alternative splicing analysis.
b) Scatter plots of alternative splicing events (n = 13 for U1-mutant Shhα, n = 39 for U1-wildtype Shhα). X axis shows the difference of PSI (percent spliced in) calculated by rMATS. Different types of significant events (FDR < 0.01 and absolute differential PSI > 0.05 calculated by rMATS, see Methods) are illustrated by different colors as annotated.
c) Splice site sequences of alternative five prime splice site, included cassette exon (CE), included retained intron (RI) events in U1-mutant Shhα medulloblastoma and U1-wildtype Shhα medulloblastoma. Each event corresponds to a red arrow cartoon in ‘a’. Asterisk denotes nucleotide sites with q-value < 10−2 (Chi-Squared Test and BH Method).
d) Boxplot of fold changes in expression of the alternatively spliced isoform as compared to the wildtype isoform in subsets of Shh-MB as determined by real-time qPCR. Boxplot center lines show data median; box limits indicate the IQR from the 25th and 75th percentiles; lower and upper whiskers extend 1.5 times the IQR. Outliers are represented by individual points. P-values were calculated using two-sided Wilcoxon-rank sum test.
e) Comparison of the extent of overlap between splicing events by Shh subtype and U1 mutational status. Effect sizes are calculated by LeafCutter with an absolute effect size threshold of 1.5.
Extended Data Fig. 10. – Aberrant splicing of oncogenes and tumor suppressor genes in U1- mutant Shh-MB.
a) Overview of cryptic alternative splicing of GLI2 demonstrating the position of a cryptic cassette exon with the 5′ splice site sequence.
b) Sashimi-plot of splicing of GLI2 in representative cases. The bar plot shows counts per million reads. Numbers enumerate junctional reads, with U1-mutant isoform reads in red.
c) Scatter plot comparing detected alternatively spliced read and total junction reads which shared 3 prime splice site. Jittering was performed for both values.
d) ‘Percent spliced in’ values by U1-mutant Shhα, U1-mutant Shhδ, and U1-wildtype Shh (all Shh subtypes). Boxplot center lines show data median; box limits indicate the IQR from the 25th and 75th percentiles; lower and upper whiskers extend 1.5 times the IQR. Outliers are represented by individual points. P-values were calculated using two-sided Wilcoxon-rank sum test.
e) Boxplot of fold changes in expression of the alternatively spliced isoform as compared to the wildtype isoform of GLI2 in subsets of Shh-MB as determined by real-time qPCR. Boxplot center lines show data median; box limits indicate the IQR from the 25th and 75th percentiles; lower and upper whiskers extend 1.5 times the IQR. Outliers are represented by individual points. P-values were calculated using two-sided Wilcoxon-rank sum test.
f) Illustration of canonical and cryptic isoform of GLI2. Translation start sites are indicated with an ATG arrow. Resulting proteins (and size) are displayed for each isoform. Repression and activation domains are indicated in blue and orange respectively. aa denotes amino acids.
g) Overview of cryptic alternative splicing of CCND2 illustrating the position of a cryptic cassette exon with the 5′ splice site sequence.
h) Sashimi-plot of representative cases demonstrates alternative splicing at the CCND2 locus. Numbers illustrate junctional reads. Junctional reads specific to U1-mutants are in red.
i) The canonical isoform and the cryptic isoform of CCND2.
j) Scatter plot comparing detected alternatively spliced read and total junction reads which shared 3 prime splice. Jittering was performed for both values.
k) ‘Percent spliced in’ values by U1-mutant Shhα (n = 13), U1-mutant Shhδ (n = 58), and U1-wildtype Shh (all Shh subtypes, n = 104). Boxplot center lines show data median; box limits indicate the IQR from the 25th and 75th percentiles; lower and upper whiskers extend 1.5 times the IQR. Outliers are represented by individual points. P-values were calculated using two-sided Wilcoxon-rank sum test.
l) Real-time qPCR comparing the expression of the cryptic isoform of CCND2 demonstrates high levels of expression of CCND2 restricted to Shhδ cases (n = 6 for U1-mutant Shhα, n = 6 for U1-mutant Shhδ, n = 6 for U1-wildtype Shhα). Boxplot center lines show data median; box limits indicate the IQR from the 25th and 75th percentiles; lower and upper whiskers extend 1.5 times the IQR. Outliers are represented by individual points. P-values were calculated using two-sided Wilcoxon-rank sum test.
m) Overview of cryptic alternative splicing of PAX5 illustrating the position of a cryptic cassette exon with the 5′ splice site sequence.
n) Sashimi-plot of representative cases demonstrates alternative splicing at the PAX5 locus. Numbers illustrate junctional reads. Junctional reads specific to U1-mutants are in red.
o) The canonical isoform and the cryptic isoform of PAX5.
p) Scatter plot comparing detected alternatively spliced read and total junction reads which shared 3 prime splice site. Jittering was performed for both values.
q) ‘Percent spliced in’ values by U1-mutant Shhα (n = 5), U1-mutant Shhδ (n = 27), and U1-wildtype Shh (all Shh subtypes, n = 7). Boxplot center lines show data median; box limits indicate the IQR from the 25th and 75th percentiles; lower and upper whiskers extend 1.5 times the IQR. Outliers are represented by individual points. P-values were calculated using two-sided Wilcoxon-rank sum test.
Supplementary Material
Acknowledgements
M.D.T. is supported by the NIH (R01CA148699 and R01CA159859), The Pediatric Brain Tumour Foundation, The Terry Fox Research Institute, The Canadian Institutes of Health Research, The Cure Search Foundation, b.r.a.i.n.child, Meagan’s Walk, Genome Canada, Genome BC, Genome Quebec, the Ontario Research Fund, Worldwide Cancer Research, V-Foundation for Cancer Research, and the Ontario Institute for Cancer Research through funding provided by the Government of Ontario. M.D.T. is also supported by a Canadian Cancer Society Research Institute Impact grant and by a Stand Up To Cancer (SU2C) St. Baldrick’s Pediatric Dream Team Translational Research Grant (SU2C-AACR-DT1113) and SU2C Canada Cancer Stem Cell Dream Team Research Funding (SU2C-AACR-DT-19–15) provided by the Government of Canada through Genome Canada and the Canadian Institutes of Health Research, with supplementary support from the Ontario Institute for Cancer Research through funding provided by the Government of Ontario. Stand Up To Cancer is a program of the Entertainment Industry Foundation administered by the American Association for Cancer Research. M.D.T. is also supported by the Garron Family Chair in Childhood Cancer Research at the Hospital for Sick Children and the University of Toronto. E.G.V.M. is supported by the NIH (R01-NS096236 and R01CA235162) and the CURE Childhood Cancer Foundation. X. S. P. is supported by Ministerio de Economía y Competitividad (MINECO) (SAF2013–45836-R). A.K. was supported by 2017–1.2.1-NKP-2017–00002 National Brain Research Program NAP 2.0. M. L. G. is supported by AIRC (Italian Association for Cancer Research) and by Fondazione Berlucchi.
H.S. is a recipient of a Research Fellowship (Astellas Foundation for Research on Metabolic Disorders). S.A.K. is a recipient of funding from the Restracomp Research Fellowship (SickKids Research Institute) and the MD/PhD Studentship Award (Canadian Institute of Health Research). A. D-N is a recipient of the Department of Education of the Basque Government (PRE_2017_1_0100). J.R. is supported by Genome Canada Genome Technology Platform Grant 12505, Canada Foundation for Innovation Project 33408. Computations were partially performed on the NIG supercomputer at ROIS National Institute of Genetics and on the Niagara supercomputer at the SciNet HPC Consortium. SciNet is funded by the Canada Foundation for Innovation under the auspices of Compute Canada; the Government of Ontario; Ontario Research Fund - Research Excellence; and the University of Toronto.
Footnotes
Competing interests
The authors declare no competing interests.
References
- 1.Pugh TJ et al. Medulloblastoma exome sequencing uncovers subtype-specific somatic mutations. Nature 488, 106–110, doi: 10.1038/nature11329 (2012). [DOI] [PMC free article] [PubMed] [Google Scholar]
- 2.Jones DT et al. Dissecting the genomic complexity underlying medulloblastoma. Nature 488, 100–105, doi: 10.1038/nature11284 (2012). [DOI] [PMC free article] [PubMed] [Google Scholar]
- 3.Northcott PA et al. The whole-genome landscape of medulloblastoma subtypes. Nature 547, 311–317, doi: 10.1038/nature22973 (2017). [DOI] [PMC free article] [PubMed] [Google Scholar]
- 4.Northcott PA, Korshunov A, Pfister SM & Taylor MD The clinical implications of medulloblastoma subgroups. Nat Rev Neurol 8, 340–351, doi: 10.1038/nrneurol.2012.78 (2012). [DOI] [PubMed] [Google Scholar]
- 5.Northcott PA et al. Medulloblastoma comprises four distinct molecular variants. Journal of clinical oncology : official journal of the American Society of Clinical Oncology 29, 1408–1414, doi: 10.1200/JCO.2009.27.4324 (2011). [DOI] [PMC free article] [PubMed] [Google Scholar]
- 6.Taylor MD et al. Molecular subgroups of medulloblastoma: the current consensus. Acta Neuropathol 123, 465–472, doi: 10.1007/s00401-011-0922-z (2012). [DOI] [PMC free article] [PubMed] [Google Scholar]
- 7.Cavalli FMG et al. Intertumoral Heterogeneity within Medulloblastoma Subgroups. Cancer Cell 31, 737–754 e736, doi: 10.1016/j.ccell.2017.05.005 (2017). [DOI] [PMC free article] [PubMed] [Google Scholar]
- 8.Huang FW et al. Highly recurrent TERT promoter mutations in human melanoma. Science 339, 957–959, doi: 10.1126/science.1229259 (2013). [DOI] [PMC free article] [PubMed] [Google Scholar]
- 9.Gan KA, Carrasco Pro S, Sewell JA & Fuxman Bass JI Identification of Single Nucleotide Non-coding Driver Mutations in Cancer. Front Genet 9, 16, doi: 10.3389/fgene.2018.00016 (2018). [DOI] [PMC free article] [PubMed] [Google Scholar]
- 10.Manser T & Gesteland RF Human U1 loci: genes for human U1 RNA have dramatically similar genomic environments. Cell 29, 257–264 (1982). [DOI] [PubMed] [Google Scholar]
- 11.Li YI et al. Annotation-free quantification of RNA splicing using LeafCutter. Nat Genet, doi: 10.1038/s41588-017-0004-9 (2017). [DOI] [PMC free article] [PubMed] [Google Scholar]
- 12.Shen S et al. rMATS: robust and flexible detection of differential alternative splicing from replicate RNA-Seq data. Proc Natl Acad Sci U S A 111, E5593–5601, doi: 10.1073/pnas.1419161111 (2014). [DOI] [PMC free article] [PubMed] [Google Scholar]
- 13.Lee JH, You J, Dobrota E & Skalnik DG Identification and characterization of a novel human PP1 phosphatase complex. J Biol Chem 285, 24466–24476, doi: 10.1074/jbc.M110.109801 (2010). [DOI] [PMC free article] [PubMed] [Google Scholar]
- 14.Tessema M et al. Differential epigenetic regulation of TOX subfamily high mobility group box genes in lung and breast cancers. PLoS One 7, e34850, doi: 10.1371/journal.pone.0034850 (2012). [DOI] [PMC free article] [PubMed] [Google Scholar]
- 15.Kogerman P et al. Alternative first exons of PTCH1 are differentially regulated in vivo and may confer different functions to the PTCH1 protein. Oncogene 21, 6007–6016, doi: 10.1038/sj.onc.1205865 (2002). [DOI] [PubMed] [Google Scholar]
- 16.Sasaki H, Nishizaki Y, Hui C, Nakafuku M & Kondoh H Regulation of Gli2 and Gli3 activities by an amino-terminal repression domain: implication of Gli2 and Gli3 as primary mediators of Shh signaling. Development 126, 3915–3924 (1999). [DOI] [PubMed] [Google Scholar]
- 17.Huard JM, Forster CC, Carter ML, Sicinski P & Ross ME Cerebellar histogenesis is disturbed in mice lacking cyclin D2. Development 126, 1927–1935 (1999). [DOI] [PubMed] [Google Scholar]
- 18.Kenney AM & Rowitch DH Sonic hedgehog promotes G(1) cyclin expression and sustained cell cycle progression in mammalian neuronal precursors. Mol Cell Biol 20, 9055–9067 (2000). [DOI] [PMC free article] [PubMed] [Google Scholar]
- 19.Mirzaa G et al. De novo CCND2 mutations leading to stabilization of cyclin D2 cause megalencephaly-polymicrogyria-polydactyly-hydrocephalus syndrome. Nat Genet 46, 510–515, doi: 10.1038/ng.2948 (2014). [DOI] [PMC free article] [PubMed] [Google Scholar]
- 20.Dvinge H, Kim E, Abdel-Wahab O & Bradley RK RNA splicing factors as oncoproteins and tumour suppressors. Nat Rev Cancer 16, 413–430, doi: 10.1038/nrc.2016.51 (2016). [DOI] [PMC free article] [PubMed] [Google Scholar]
- 21.Kim E et al. SRSF2 Mutations Contribute to Myelodysplasia by Mutant-Specific Effects on Exon Recognition. Cancer Cell 27, 617–630, doi: 10.1016/j.ccell.2015.04.006 (2015). [DOI] [PMC free article] [PubMed] [Google Scholar]
- 22.Mullighan CG et al. Genome-wide analysis of genetic alterations in acute lymphoblastic leukaemia. Nature 446, 758–764, doi: 10.1038/nature05690 (2007). [DOI] [PubMed] [Google Scholar]
- 23.Seiler M et al. H3B-8800, an orally available small-molecule splicing modulator, induces lethality in spliceosome-mutant cancers. Nat Med 24, 497–504, doi: 10.1038/nm.4493 (2018). [DOI] [PMC free article] [PubMed] [Google Scholar]
Methods References
- 24.Morrissy AS et al. Divergent clonal selection dominates medulloblastoma at recurrence. Nature 529, 351–357, doi: 10.1038/nature16478 (2016). [DOI] [PMC free article] [PubMed] [Google Scholar]
- 25.Cibulskis K et al. Sensitive detection of somatic point mutations in impure and heterogeneous cancer samples. Nat Biotechnol 31, 213–219, doi: 10.1038/nbt.2514 (2013). [DOI] [PMC free article] [PubMed] [Google Scholar]
- 26.Shiraishi Y et al. An empirical Bayesian framework for somatic mutation detection from cancer genome sequencing data. Nucleic acids research 41, e89, doi: 10.1093/nar/gkt126 (2013). [DOI] [PMC free article] [PubMed] [Google Scholar]
- 27.Koboldt DC et al. VarScan 2: somatic mutation and copy number alteration discovery in cancer by exome sequencing. Genome research 22, 568–576, doi: 10.1101/gr.129684.111 (2012). [DOI] [PMC free article] [PubMed] [Google Scholar]
- 28.Saunders CT et al. Strelka: accurate somatic small-variant calling from sequenced tumor-normal sample pairs. Bioinformatics 28, 1811–1817, doi: 10.1093/bioinformatics/bts271 (2012). [DOI] [PubMed] [Google Scholar]
- 29.Larson DE et al. SomaticSniper: identification of somatic point mutations in whole genome sequencing data. Bioinformatics 28, 311–317, doi: 10.1093/bioinformatics/btr665 (2012). [DOI] [PMC free article] [PubMed] [Google Scholar]
- 30.Kim S et al. Virmid: accurate detection of somatic mutations with sample impurity inference. Genome Biol 14, R90, doi: 10.1186/gb-2013-14-8-r90 (2013). [DOI] [PMC free article] [PubMed] [Google Scholar]
- 31.Rimmer A et al. Integrating mapping-, assembly- and haplotype-based approaches for calling variants in clinical sequencing applications. Nat Genet 46, 912–918, doi: 10.1038/ng.3036 (2014). [DOI] [PMC free article] [PubMed] [Google Scholar]
- 32.Christoforides A et al. Identification of somatic mutations in cancer through Bayesian-based analysis of sequenced genome pairs. BMC Genomics 14, 302, doi: 10.1186/1471-2164-14-302 (2013). [DOI] [PMC free article] [PubMed] [Google Scholar]
- 33.Wang K, Li M & Hakonarson H ANNOVAR: functional annotation of genetic variants from high-throughput sequencing data. Nucleic acids research 38, e164, doi: 10.1093/nar/gkq603 (2010). [DOI] [PMC free article] [PubMed] [Google Scholar]
- 34.Boeva V et al. Control-FREEC: a tool for assessing copy number and allelic content using next-generation sequencing data. Bioinformatics 28, 423–425, doi: 10.1093/bioinformatics/btr670 (2012). [DOI] [PMC free article] [PubMed] [Google Scholar]
- 35.Dobin A et al. STAR: ultrafast universal RNA-seq aligner. Bioinformatics 29, 15–21, doi: 10.1093/bioinformatics/bts635 (2013). [DOI] [PMC free article] [PubMed] [Google Scholar]
- 36.Robinson JT et al. Integrative genomics viewer. Nat Biotechnol 29, 24–26, doi: 10.1038/nbt.1754 (2011). [DOI] [PMC free article] [PubMed] [Google Scholar]
- 37.Kalvari I et al. Rfam 13.0: shifting to a genome-centric resource for non-coding RNA families. Nucleic acids research 46, D335–D342, doi: 10.1093/nar/gkx1038 (2018). [DOI] [PMC free article] [PubMed] [Google Scholar]
- 38.Darty K, Denise A & Ponty Y VARNA: Interactive drawing and editing of the RNA secondary structure. Bioinformatics 25, 1974–1975, doi: 10.1093/bioinformatics/btp250 (2009). [DOI] [PMC free article] [PubMed] [Google Scholar]
- 39.Sheth N et al. Comprehensive splice-site analysis using comparative genomics. Nucleic acids research 34, 3955–3967, doi: 10.1093/nar/gkl556 (2006). [DOI] [PMC free article] [PubMed] [Google Scholar]
- 40.Wagih O ggseqlogo: a versatile R package for drawing sequence logos. Bioinformatics 33, 3645–3647, doi: 10.1093/bioinformatics/btx469 (2017). [DOI] [PubMed] [Google Scholar]
- 41.Northcott PA et al. Subgroup-specific structural variation across 1,000 medulloblastoma genomes. Nature 488, 49–56, doi: 10.1038/nature11327 (2012). [DOI] [PMC free article] [PubMed] [Google Scholar]
- 42.Pei Y et al. HDAC and PI3K Antagonists Cooperate to Inhibit Growth of MYC-Driven Medulloblastoma. Cancer Cell 29, 311–323, doi: 10.1016/j.ccell.2016.02.011 (2016). [DOI] [PMC free article] [PubMed] [Google Scholar]
- 43.Katz Y, Wang ET, Airoldi EM & Burge CB Analysis and design of RNA sequencing experiments for identifying isoform regulation. Nat Methods 7, 1009–1015, doi: 10.1038/nmeth.1528 (2010). [DOI] [PMC free article] [PubMed] [Google Scholar]
- 44.Zhukova N et al. Subgroup-specific prognostic implications of TP53 mutation in medulloblastoma. Journal of clinical oncology : official journal of the American Society of Clinical Oncology 31, 2927–2935, doi: 10.1200/JCO.2012.48.5052 (2013). [DOI] [PMC free article] [PubMed] [Google Scholar]
- 45.Langmead B, Trapnell C, Pop M & Salzberg SL Ultrafast and memory-efficient alignment of short DNA sequences to the human genome. Genome Biol 10, R25, doi: 10.1186/gb-2009-10-3-r25 (2009). [DOI] [PMC free article] [PubMed] [Google Scholar]
- 46.Wang K et al. PennCNV: an integrated hidden Markov model designed for high-resolution copy number variation detection in whole-genome SNP genotyping data. Genome research 17, 1665–1674, doi: 10.1101/gr.6861907 (2007). [DOI] [PMC free article] [PubMed] [Google Scholar]
- 47.Van Loo P et al. Allele-specific copy number analysis of tumors. Proc Natl Acad Sci U S A 107, 16910–16915, doi: 10.1073/pnas.1009843107 (2010). [DOI] [PMC free article] [PubMed] [Google Scholar]
- 48.Mermel CH et al. GISTIC2.0 facilitates sensitive and confident localization of the targets of focal somatic copy-number alteration in human cancers. Genome Biol 12, R41, doi: 10.1186/gb-2011-12-4-r41 (2011). [DOI] [PMC free article] [PubMed] [Google Scholar]
Associated Data
This section collects any data citations, data availability statements, or supplementary materials included in this article.
Supplementary Materials
Data Availability Statement
Sequencing data have been deposited in the European Genome-Phenome Archive (EGA) and Gene Expression Omnibus (GEO): RNA-seq (EGAD00001001899, and EGAD00001004958), whole genome sequence (EGAD00001003125 and EGAD00001004347) and RNA-seq of exogenous expression analyses (GSE128005).


