

Abstract
Siniperca chuatsi is currently one of the most important economic farmed freshwater fish in China. The aim of this study was to evaluate the metabolic profile of recirculating ponds aquaculture system (RAS)-farmed S. chuatsi. Gas Chromatography-Mass Spectrophotometry (GC-MS) metabolomic platform was used to comprehensively analyze the effects of recirculating ponds aquaculture system (RAS) on the Mandarin fish S. chuatsi metabolism. Database searching and statistical analysis revealed that there were altogether 335 metabolites quantified (similarity > 0) and 205 metabolites were identified by mass spectrum matching with a spectral similarity > 700. Among the 335 metabolites quantified, 33 metabolites were significantly different (VIP > 1 and p < 0.05) between RAS and pond groups. In these thirty-three metabolites, taurine, 1-Hexadecanol, Shikimic Acid, Alloxanoic Acid and Acetaminophen were higher in the pond group, while 28 metabolites were increased notably in the RAS group. The biosynthesis of unsaturated fatty acids, lysosome, tryptophan metabolism were recommended as the KEGG pathway maps for S. chuatsi farmed in RAS. RAS can provide comprehensive benefits to the effects of Siniperca chuatsi metabolism, which suggest RAS is an efficient, economic, and environmentally friendly farming system compared to pond system.
Subject terms: Metabolomics, Metabolism
Introduction
The Chinese mandarin fish Siniperca chuatsi (Basilewsky) is a freshwater fish with high economic value and is endemic to East Asia, specially distributed in the Yangtze River drainage in China1. The resources of wild S. chuatsi have declined dramatically because of water pollution, damming and over-fishing in recent years2. At present, with the social and economic development, the popularity of the fish has increased, the catches from the wild could not meet the demand, and the resulting market price has created much interest in the aquaculture of S. chuatsi. In order to adapt to market demand, the stocking and culture techniques were developed for the S. chuatsi. The mandarin fish is widely cultured throughout the country, and is also important in stocking fisheries in lakes and reservoirs3. However, outbreaks of the diseases caused by viruses, bacteria and parasites have brought severe economic losses to the S. chuatsi breeding industry4,5. Due to water pollution, low survival rate and the nutrients issue of a serious waste of water, traditional ponds of S. chuatsi at this stage have encountered many difficulties, which have largely hindered its commercial exploitation. Recirculating ponds aquaculture system (RAS) is a new ecological ponds aquaculture guided by the idea of cyclic economy6. RAS have gained increasing interest in recent years as a means to intensify fish production while at the same time reduce water and land usage, minimizing the adverse environmental impact7,8. The pond healthy breeding technology demonstration and promotion of Siniperca chuatsi was carried out to meet the needs of high-quality aquatic products and promote the aquaculture industry in restructuring.
Metabolomics is an “omics” technique that is situated downstream of proteomics, transcriptomics and genomics9. Metabolomics is defined as the quantitative measurement of the dynamic multiparametric metabolic response of living systems to pathophysiological stimuli or genetic modification10, which has been proposed as a powerful tool for exploring the complex relationship between nutrition and health in nutrition research11–13. Gas chromatography-mass spectrometry (GC-MS) has many merits, for example powerful resolving capability and high reproducibility, that render it extensively useful in the field of metabolomic profiling14. Serum metabonomic profiles of RAS- and pond-cultured S. chuatsi were detected using GC-MS techniques employed to globally characterize changes. So far, this is the first time that GC-MS techniques were applied to identify the metabolic profile of the RAS- and pond-cultured S. chuatsi.
Results
Metabolomic profiling through GC- MS
A total of 775 valid peaks were identified in the serum. 335 peaks were retained after filtering and de-noising, and most peaks were identified and attributed to endogenous metabolites (similarity > 0) (Table S1). Among these, 205 metabolites based on mass spectrum matching were identified (spectral similarity value > 700), which indicated high credibility (Table S1). The specific variable quantities were indicated in the RAS compared with the pond by fold-change (FC) value. The metabolites of RAS- and pond- farmed S. chuatsi could be visually divided into down-regulation (FC value < 1) and up-regulation (FC value > 1). As shown in Fig. 1, metabolites down-regulation was more common than up-regulation at RAS- and pond- farmed S. chuatsi groups. Compared with the RAS group, only 3 metabolites were upregulated in the pond group. 33 metabolites were significantly different (p < 0.05 and VIP > 1) between pond and RAS groups in the total 335 metabolites quantified (Table 1), which consisted of 19 metabolites with similarity > 700 and 14 metabolites with similarity <700. In the 19 metabolites with similarity >700, inositol-4-monophosphate, mannonic acid, linoleic acid, isohexonic acid, 2-hydroxybutanoic acid, 2-deoxytetronic acid, uric acid, 2-hydroxyhexanoic acid, 1-monopalmitin, behenic acid, isoheptadecanoic acid, diglycerol, mannose-6-phosphate, 2-ketoisovaleric acid, lauric acid, arachidic acid and xanthurenic acid were higher in the RAS group, while taurine and 1-hexadecanol were higher in the pond group.
Figure 1.
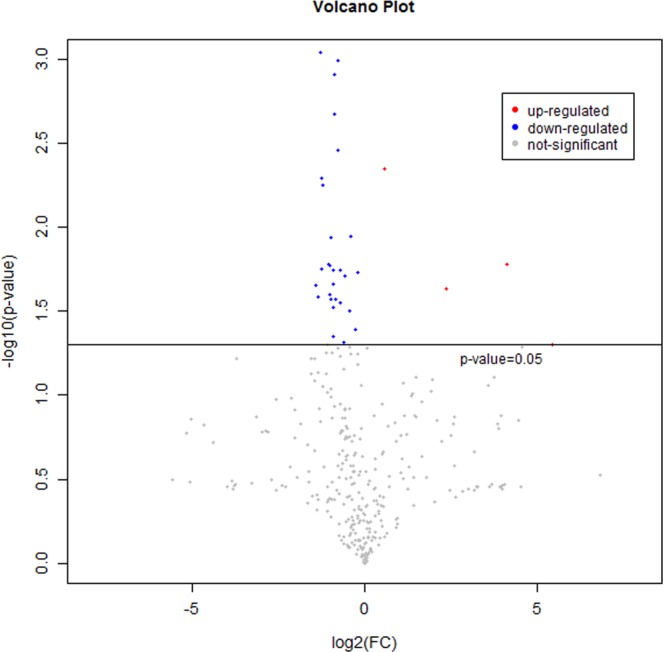
Scatter plots of metabolomics between the RAS group and pond group. The horizontal and vertical axes indicate expression levels of the metabolites in the two groups. The red and blue dots represent up- and down-regulated metabolites with significant differential metabolites (−log10 (p value) and log2 (FC), P value < 0.05) in Siniperca chuatsi, respectively. The gray dots represent the metabolites without significant differential metabolites.
Table 1.
Identification of significantly different metabolites in serum between the RAS and Pond groups.
| Metabolite name | Similarity | Average RT (min) | VIP | p-value | log2(FC) | RAS group | Pond group |
|---|---|---|---|---|---|---|---|
| Inositol-4-Monophosphate | 956 | 30.91 | 2.077 | 0.001 | −0.776 | 0.2269 | 0.1325 |
| Mannonic Acid | 918 | 25.40 | 1.613 | 0.031 | −0.444 | 0.1943 | 0.1429 |
| Linoleic Acid | 910 | 28.81 | 1.725 | 0.025 | −1.002 | 0.0883 | 0.0441 |
| Taurine | 890 | 18.80 | 1.700 | 0.023 | 2.359 | 0.0956 | 0.4903 |
| Isohexonic Acid | 875 | 25.80 | 1.639 | 0.049 | −0.600 | 0.0042 | 0.0028 |
| 2-Hydroxybutanoic Acid | 869 | 7.89 | 2.006 | 0.001 | −0.865 | 0.0342 | 0.0188 |
| 2-Deoxytetronic Acid | 867 | 12.06 | 1.956 | 0.012 | −0.976 | 0.0053 | 0.0027 |
| Uric Acid | 845 | 27.15 | 1.678 | 0.028 | −0.706 | 0.0014 | 0.0009 |
| 2-Hydroxyhexanoic Acid | 841 | 9.76 | 2.035 | 0.001 | −1.282 | 0.0141 | 0.0058 |
| 1-Monopalmitin | 830 | 32.47 | 1.674 | 0.027 | −0.851 | 0.0867 | 0.0481 |
| Behenic Acid | 795 | 32.85 | 1.940 | 0.002 | −0.892 | 0.0097 | 0.0053 |
| Isoheptadecanoic Acid | 787 | 27.45 | 1.763 | 0.018 | −0.925 | 0.0157 | 0.0083 |
| Diglycerol | 773 | 20.65 | 1.331 | 0.045 | −0.916 | 0.0367 | 0.0195 |
| Mannose-6-Phosphate | 773 | 30.27 | 1.982 | 0.003 | −0.758 | 0.0235 | 0.0139 |
| 2-Ketoisovaleric Acid | 769 | 7.58 | 1.839 | 0.026 | −1.340 | 0.0023 | 0.0009 |
| Lauric Acid | 762 | 18.62 | 1.646 | 0.019 | −0.201 | 0.0026 | 0.0023 |
| Arachidic Acid | 758 | 31.27 | 1.695 | 0.017 | −1.041 | 0.0172 | 0.0084 |
| 1-Hexadecanol | 752 | 24.93 | 2.019 | 0.001 | 0.462 | 0.0095 | 0.0131 |
| Xanthurenic Acid | 745 | 29.3 | 1.931 | 0.022 | −1.418 | 0.0043 | 0.0016 |
| Shikimic Acid | 688 | 21.65 | 1.441 | 0.050 | 5.448 | 0.0022 | 0.0963 |
| 1-Monostearin | 680 | 33.89 | 1.625 | 0.018 | −1.251 | 0.0140 | 0.0059 |
| Monomyristin | 679 | 30.81 | 1.728 | 0.027 | −0.994 | 0.0038 | 0.0019 |
| Vanillic Acid | 671 | 21.06 | 1.890 | 0.005 | −1.246 | 0.2311 | 0.0974 |
| Alloxanoic Acid | 664 | 29.12 | 1.576 | 0.017 | 4.139 | 0.0012 | 0.0220 |
| Trisaccharide | 656 | 35.35 | 1.841 | 0.022 | −0.911 | 0.0065 | 0.0034 |
| Urocanic Acid | 637 | 25.85 | 1.780 | 0.018 | −0.709 | 0.0035 | 0.0022 |
| Spermine | 616 | 33.04 | 1.838 | 0.020 | −0.560 | 0.0060 | 0.0041 |
| Glycyl Tyrosine | 610 | 32.88 | 1.575 | 0.030 | −0.923 | 0.0020 | 0.0010 |
| Glutamyl-Valine | 608 | 26.71 | 1.725 | 0.006 | −1.210 | 0.0065 | 0.0028 |
| Indole-3-Acetate | 578 | 25.2 | 1.739 | 0.017 | −1.010 | 0.0098 | 0.0049 |
| Glucose D7 Labeled | 538 | 23.82 | 1.710 | 0.011 | −0.405 | 0.0030 | 0.0023 |
| Acetaminophen | 493 | 17.85 | 1.793 | 0.005 | 0.569 | 0.0031 | 0.0047 |
| Tyramine | 397 | 24.6 | 1.561 | 0.041 | −0.256 | 0.0013 | 0.0011 |
Principal component analysis
To reduce the complexity of the datasets, PCA was applied. The PCA score plot of QC (Quality control), RAS and Pond groups from Siniperca chuatsi serum metabolites was shown in Fig. 2A. PCA score plot indicated a clear difference in all metabolites between the pond and RAS groups (Fig. 2B). The R2X value of the PCA model was 0.255 in the Siniperca chuatsi serum. All samples from RAS and Pond groups fell outside the Hotelling’s T2 tolerance ellipse with 95% confidence, which indicated that no outlier was observed among the samples analysed. The validation plot for the PLS-DA model obviously revealed that the permutation tests of the serum were valid (R2X = 0.244, R2Y = 0.095) (Fig. 2C), which was the satisfactory effectiveness of the model. All the samples between the RAS and Pond groups were within the 95% Hotelling’s T2 ellipse based on the score plots of OPLS-DA model (Fig. 2D). As shown in Table 1, a total of 33 differential metabolites were identified between the RAS and pond groups (VIP > 1, p < 0.05), which was made of four amino acids and their derivatives, three saccharides, eleven organic acids, nine fatty acids and six other metabolites. Further, 33 identified metabolites revealed the existence of distinct differences between the RAS and pond groups by hierarchical cluster analysis (Fig. 3). Based on the clustering result of metabolites, serine, glycine, threonine, proline, asparagine, valine, glutamic acid, propanoic acid, lysine, hexadecanoic acid, octadecanoic acid and ornithine were abundant in each sample of the RAS groups, alloxanoic acid, 1-hexadecanol, acetaminophen, taurine, shikimic acid were abundant in each sample of the pond group. The KEGG pathway analysis was performed by MetaboAnalyst 3.0. Functional pathway analysis facilitating further biological interpretation revealed the most relevant pathways such as Biosynthesis of unsaturated fatty acids, Lysosome, Tryptophan metabolism, Taurine and hypotaurine metabolism, Neuroactive ligand-receptor interaction, Linoleic acid metabolism, Pantothenate and CoA biosynthesis; Phenylalanine, tyrosine and tryptophan biosynthesis; Valine, leucine and isoleucine biosynthesis; beta-Alanine metabolism, Propanoate metabolism, Glutathione metabolism, isoleucine degradation, leucine and Valine; Histidine metabolism, Mannose and fructose metabolism, Primary bile acid biosynthesis, Fatty acid biosynthesis, Fatty acid metabolism, Tyrosine metabolism, Nucleotide sugar and amino sugar metabolism, Proline and arginine metabolism, ABC transporters, Purine metabolism, Biosynthesis of secondary metabolites (Table S2). KEGG pathway mapper indicated that ten metabolic signaling pathways were significantly different among two groups (p < 0.05), including Biosynthesis of unsaturated fatty acids, Lysosome, Tryptophan metabolism, Taurine and hypotaurine metabolism, Neuroactive ligand-receptor interaction, Linoleic acid metabolism, Pantothenate and CoA biosynthesis, Tryptophan and tyrosine biosynthesis, Leucine, Phenylalanine, Isoleucine and Valine biosynthesis and beta-Alanine metabolism (Table S2). The three metabolic pathways of Biosynthesis of unsaturated fatty acids, Lysosome and Tryptophan metabolism were significant differences between the RAS and pond groups (Fig. 4).
Figure 2.

Score plot of PCA (principal component analysis) modeling for different treatments. (A) The PCA (principal component analysis) score plot of QC (Quality control), RAS and Pond groups in Siniperca chuatsi serum metabolites. (B) PCA score plots for pairwise comparisons between RAS and Pond group. (C) PLS-DA score plots for pairwise comparisons between RAS and Pond group. (D) OPLS-DA score plots for pairwise comparisons between RAS and Pond group.
Figure 3.

Heat map of varied abundance of metabolites. Red and green indicate increase and decrease of metabolites relative to the median metabolite level, respectively (see color scale).
Figure 4.
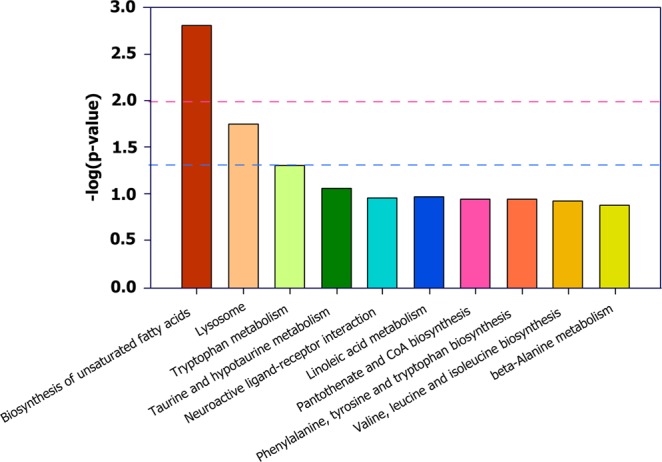
Kyoto encyclopedia of genes and genomes (KEGG) pathway enrichment analysis of Siniperca chuatsi serum differential metabolites in RAS and Pond groups. All the matched pathways are displayed in columns, and the length represents the fold change of enrichment, the pink dotted line represents the 0.01 P-value and the blue dotted line represents the 0.05 P-value. Total: the total number of metabolite in that set pathway; Expected = the expectation value; Hits = the number of metabolites in the experimental set matching the pathway set; Holm P = the P-value adjusted by Holm-Bonferroni method; FDR = the P-value adjusted using False Discovery Rate; Impact = the pathway impact value.
Discussion
The mandarin fish has a relatively high market value in China3,15, which is widely cultured throughout the country due to their rapid growth, large size, high nutritional value and delicious flesh and high price3,15,16. The successful artificial reproduction, fry and fingerling rearing technology of S. chuatsi could have potential for meeting the demands of S. chuatsi for commercial fish culture in China1,17. Mandarin fish is a key demersal piscivore in lakes and river systems, which feed on live shrimps, fish and other aquatic animals that are smaller than themselves, particularly fish. In the wild the fry of S. chuatsi start feeding, they prefer to take live prey fish and not take dead prey fish or artificial diets18–20. Recently, RAS have been well studied, and it has been proven major leaps in fish culture to maximize profit by increasing production, lowering costs and conserving water21–23. Therefore, in the present study, S. chuatsi were farmed in the RAS and pond, respectively, which were fed on live fry of cultivated Hypophthalmichthys molitrix and Aristichthys nobilis. In this study, the metabolite profiling was investigated using GC/MS to determine the metabolic characteristics of RAS and pond-cultured S. chuatsi, which could be regarded as the ultimate responses of biological systems to the environmental changes24–26. Up to now, many powerful analytical techniques have been used for identifying metabolite profiling, such as GC-MS and HPLC-MS (high performance liquid chromatography with mass spectrometry)27–29. GC-MS as a mature technology has a lot of advantages, such as good reproducibility, high sensitivity, high resolution, with a large standard library, relatively low cost and powerful analysis, which can be used for analyzing the primary metabolism products, including carbohydrates, organic acids, amino acids, and fatty acids30–32. For instance, glucose, oxypurinol, taurine, lactate, creatine, glutamate, alanine, sn-glycerol-3-phosphorylcholine, glycine, phenol, hypoxanthine, acetic acid, lysine, leucine and valine were main hepatopancreas metabolites differing in serum of normal grass carp based on 1H-NMR33. The metabolic differences were revealed in Eriocheir sinensis fed with dietary olive oil or palm oil using untargeted GC-MS metabolomics31. 68 metabolites were identified with high credibility and five metabolites were significantly different between PO group and OO group31. The derivatization is required in order to achieve prior to the analysis using GC-MS because of most of these metabolites are nonvolatile34.
Currently, we applied the GC-MS metabolomics approach revealed metabolic differences in the RAS- and pond-farmed S. chuatsi fed with dietary Hypophthalmichthys molitrix and Aristichthys nobilis because of the metabolites in circulation have been commonly employed to analyze the physiological status in response to multiple factors, including stresses, feed change, disease and so on35. So far, this is the first time to evaluate metabolic changes in the RAS-farmed S. chuatsi. We have discriminated the Siniperca chuatsi from RAS and pond in a PCA analysis of GC-MS metabolites. PCA is an unsupervised pattern recognition method, which was performed to examine the intrinsic variation in the dataset36,37. The greatest metabolic variance in our studies were related to fish culture environment and not caused from farmed Siniperca chuatsi. Since the S. chuatsi were farmed in recirculating ponds aquaculture system and pond, respectively. 33 metabolites were significantly different (p < 0.05 and VIP > 1) between RAS and pond groups in the S. chuatsi. Among all of them, organic acids accounted for approximately 60.6%, and most of which were related to fatty acid metabolism. These metabolites were comprised of 19 metabolites with the similarity over 700 and 14 metabolites with similarity under700. Some marker metabolites were worth investigating in the future. Compared with the RAS group, the levels of taurine, 1-hexadecanol, shikimic acid, alloxanoic acid and acetaminophen were higher in the pond group. In fish, taurine is mainly conjugated with choline to produce bovine bile sulfonate in the liver. In contrast to fish, bilirubin is conjugated with sugar (mainly glucuronic acid), and excreted in the bile in mammals38. Since taurine is involved in various functions, like exogenous substances, cell protection, neuro-modulation or neuro-transmission, detoxification of endogenous39. A large amount of taurine accumulated in the fish body, but its precise physiological significance is uncertain38. The contents of twenty-eight metabolites increased notably in the RAS group, including vanillic acid, inositol-4-monophosphate, mannonic acid, linoleic acid, isohexonic acid, 2-hydroxyhexanoic acid, 2-deoxytetronic acid, uric acid, 2-hydroxybutanoic acid, 1-monopalmitin, behenic acid, isoheptadecanoic acid, diglycerol, mannose-6-phosphate, 2-ketoisovaleric acid, lauric acid, arachidic acid and xanthurenic acid, 1-monostearin, monomyristin, trisaccharide, urocanic acid, spermine, glycyl tyrosine, glutamyl-valine, indole-3-acetate, glucose D7 labeled and tyramine. In this study, RAS has a lot of advantages, such as more dissolved oxygen and improving lots of environmental factors (TAN, NO−2-N, P and COD), which can provide comprehensive benefits to the S. chuatsi. The content of vanillic acid is the highest in the RAS group. Vanillic acid belonged to cinnamic acid derivative with strong antioxidant and antibacterial activity40. Inositol-phosphates, as a class of signal molecule, play an important role in cell signal transduction, and are related to a lot of physical activities. The mechanism of inositol phosphate signal transduction is closely related to the generation, metabolism and biological transformation of inositol phosphate. The nature is various chemical reactions (phosphorylation/dephosphorylation, interactions with inositol phosphate receptors). Mutual transformations of these reactions present a very complex network control system41. As compared to the pond group, Oleic acid and1-Monopalmitin in RAS group showed a clear increasing trend, which might be originated from the desaturation of saturated fatty acids42. Besides, other kinds of compounds, like amines, esters, alcohols and so on, were also identified in the RAS and pond groups, which could devote to the formation of the secondary metabolites that played a key role in the flavor components43. Significant changes in the levels of the main metabolites might show its key role in a number of metabolic pathways for regulating adaptation of the RAS- and pond-cultured S. chuatsi. The present study revealed that integration of metabolomics could be used to produce complementary data, which contribute to a better understand regarding correlation of fermentation process. However, there are still few limitations with metabolic differences of RAS- and pond-farmed S. chuatsi. The most obvious reason was only 335 identified metabolites in the RAS and pond groups, which might be attributed to high molecular weight metabolites and some volatile metabolites being missed. Thus, more sensitive high-throughput and advanced omics technologies should be used to accounts for the entire metabolic network. KEGG pathway mapper and metabolite set enrichment analysis suggested that these metabolites were related mainly to unsaturated fatty acid synthesis, Lysosome and amino acid metabolism.
In conclusion, this study was conducted to evaluate the use of GC-MS metabolomic platform to comprehensively analyze the effects of recirculating ponds aquaculture system (RAS) on the S. chuatsi metabolism. Database searching and statistical analysis revealed that there were altogether 335 metabolites quantified (similarity > 0) and 205 metabolites were described by mass spectrum matching with the similarity over 700. Among the total 335 metabolites quantified, 33 metabolites were significantly different (p < 0.05and VIP > 1) between RAS and pond groups. Biosynthesis of unsaturated fatty acids, lysosome, tryptophan metabolism were recommended as the KEGG pathway maps for S. chuatsi farmed in RAS. The present study revealed that RAS could provide comprehensive benefits to the effects of S. chuatsi metabolism, which suggested RAS was an efficient, economic, and environmentally friendly farming system compared to pond system.
Methods
Ethics statement
Investigations and protocols were conducted according to the guiding principles for the use and care of laboratory animals and in compliance with Anhui Science and Technology University Institute of Animal Care and Use Committee. The institutional review board approved this procedure. Our study had been submitted to and approved by the Academic Ethics Committee of Anhui Science and Technology University. All sample collection was undertaken in accordance with relevant Academic Ethics Committee of Anhui Science and Technology University guidelines and regulations.
Fish housing and feeding
S. chuatsi juveniles were farmed in the RAS and pond of Chuzhou Nanqiao District Yangtze River Aquaculture Breeding Ground (Chuzhou, China) from July to September 2018. The fish were cultivated with a 300 m3 running water aquaculture pond (30 × 5 × 2 m) and 4200 m3 pond (60 × 35 × 2 m). The culturing density in RAS and pond were 180.6 g /m3 and 8.0 g /m3, respectively. The dissolved oxygen (DO), ammonia nitrogen (NH4-N), pH, nitrite content (NC), etc., were monitored in two RAS and pond of S. chuatsi. The RAS and pond of water quality indicators were DO 7.50 ± 0.29 mg/ L, 6.48 ± 0.38 mg/ L, 0.0016 ± 0.0007 mg/ L, 0.0021 ± 0.0009 mg/ L, pH 7.33 ± 0.41, 7.09 ± 0.51, NC 0.048 ± 0.014 mg/ L, 0.198 ± 0.065 mg/ L, respectively. The perch were provided a live prey fish (Hypophthalmichthys molitrix and Aristichthys nobilis) during 3- month experiments. The mandarin fish reached average terminal body length of 28.98 ± 0.65 cm and 18.64 ± 0.83 cm, average terminal body weight of 426.68 ± 60.85 g and 135.6 ± 27.85 g after 90 days rearing from average initial body length of 7.12 ± 0.53 cm, average initial body weight of 2.58 ± 1.15 g, respectively. Five samples of S. chuatsi were caught by brail fishing net in the RAS and pond, respectively. All captured fish were transferred to the laboratory maintaining a continuous supply of oxygenated water in refrigerated van for 1.5 h at 25 °C. Each fish was anesthetized by tricaine methanesulfonate (MS-222, 0.2 g/L) for 4 min, and blood was obtained by venipuncture from the tail vein of S. chuatsi, and placed in serum-separating tubes. The blood of Mandarin fish was allowed to clot at room temperature for 30 min. Serum was obtained by centrifugation (10 min, 2000 rpm at 4 °C), and stored frozen at −80 °C.
Sample preparation
To evaluate the metabolism status, serum metabonomic profiles of RAS- and pond-cultured S. chuatsi were detected using GC-MS techniques employed to globally characterize changes in this study. Ten serum samples were slowly thawed at room temperature for calibration curves and quality control (QC) samples. 20 μL internal standard (2-chloro-l-phenylalanine, 0.3 mg/mL) and 600 μL extraction solvent with methanol/water (4/1, v/v) were added to each sample. Samples were stored at −80 °C for 2 min and then grinded at 60 HZ for 2 min. 120 μL of chloroform was added to the samples, then the samples were vigorously vortexed and followed by 10 min ultrasound-associated extraction at ambient temperature, then stored at 4 °C (10 min). The samples were centrifuged at 12000 rpm for 10 min at 4 °C. QC sample was prepared by mixing aliquots of the all samples to be a pooled sample. An aliquot of the 150 μL supernatant was transferred to a glass sampling vial for vacuum-dry at room temperature. And 80 μL of methoxylamine hydrochloride (dissolved in pyridine, 15 mg/mL) was subsequently added. The resultant mixture was vortexed vigorously for 2 min and incubated at 37 °C for 90 min. 80 μL of BSTFA (with 1% TMCS) and 20 μL n-hexane were added into the mixture, which was vortexed vigorously for 2 min and then derivatized at 70 °C for 60 min. The samples were allowed to placed at ambient temperature for 30 min before GC-MS analysis.
GC–MS analysis
After the completion of sample pretreatment, the samples were sent to Shanghai OE Biotech. Co., Ltd. (Shanghai, China) for GC-MS analysis. Data were log2 transformed by using Microsoft Excel, and the resulting data matrix was then imported into SIMCA-P software (version 14.0, Umetrics, Umea, Sweden). Principle component analysis (PCA) and (orthogonal) partial least-squares-discriminant analysis (O) PLS-DA31 were used to evaluate the metabolic difference among RAS and pond groups, after mean centering and unit variance scaling. The ellipse represents the Hotelling’s T2 with 95% confidence interval of the modeled variation44. The heat map was produced in the R environment for statistical computing. The heat map color drawn using R with ggplot2 represents the z-score transformed raw data for RAS-farmed S. chuatsi metabolites45. Variable importance in the projection (VIP) statistics from OPLS-DA modeling was used to identify the overall contribution of each variable. Those variables (p < 0.05, VIP >1.0) are considered relevant for group discrimination. Furthermore, the proteins were further identified according to Kyoto Encyclopedia of Genes and Genomes (KEGG, http://www.genome.jp/kegg/)32.
Supplementary information
Acknowledgements
The authors gratefully express appreciation to the efforts and contributions of Shanghai OE Biotech. Co., Ltd., China. This work was supported by the Key Research and Development Plan Project of Anhui Province, China, Grant/Award Number: 1804a07020119; Anhui Provincial Major Scientific Research Projects in Universities, China, Grant/Award Number: KJ2019ZD59; Natural Science Foundation of Anhui Province, China, Grant/Award Number:1708085MC78.
Author contributions
M.X. designed the study. K.Q. and F.B. collected and analyzed the data. Y.W. edited Figures. M.X. and F.B. contributed to the discussion and reviewed/edited the manuscript. All the authors have read and approved the final submitted version.
Competing interests
The authors declare no competing interests.
Footnotes
Publisher’s note Springer Nature remains neutral with regard to jurisdictional claims in published maps and institutional affiliations.
Supplementary information
is available for this paper at 10.1038/s41598-020-63252-9.
References
- 1.Liang, X. F. Study on mandarin fish and its culture home and abroad. Fish Sci Technol Informat. 23, 13–17 (in Chinese) (1996).
- 2.Tian CG, et al. Population genetic structure of Siniperca chuatsi in the middle reach of the Yangtze River inferred from mitochondrial DNA and microsatellite loci. Mitochondrial DNA. 2015;26(1):61–67. doi: 10.3109/19401736.2013.823169. [DOI] [PubMed] [Google Scholar]
- 3.Liu J, Cui Y, Liu J. Food consumption and growth of two piscivorous fishes, the mandarin fish and the Chinese snakehead. J. Fish Biol. 1998;53:1071–1083. doi: 10.1111/j.1095-8649.1998.tb00464.x. [DOI] [Google Scholar]
- 4.Wu, S. Q. et al. Preliminary study on the transmission route of Siniperca chuatsi virus. Chinese Journal of Fisheries25, 460–463 (in Chinese) (2001).
- 5.Tian JY, Sun BJ, Luo YP, Zhang YA, Nie P. Distribution of IgM, IgD and IgZ in Mandarin fish, Siniperca chuatsi lymphoid tissues and their transcriptional changes after Flavobacterium columnare stimulation. Aquaculture. 2009;288(1):14–21. doi: 10.1016/j.aquaculture.2008.11.023. [DOI] [Google Scholar]
- 6.Wang, H. W. Ecologicai and economic analysis and evaluation of Grass Carppond recirculating aquaculture system [D]. Nanjing Agricult University. (in Chinese) (2015).
- 7.Lin YF, et al. Performance of a constructed wetland treating intensive shrimp aquaculture wastewater under high hydraulic loading rate. Environmental Pollution. 2005;134:411–421. doi: 10.1016/j.envpol.2004.09.015. [DOI] [PubMed] [Google Scholar]
- 8.Johanne D, et al. Farming different species in RAS in Nordic countries: Current status and future perspectives. Aquacultural Engineering. 2013;53:2–13. doi: 10.1016/j.aquaeng.2012.11.008. [DOI] [Google Scholar]
- 9.Lindon JC, Nicholson JK. Spectroscopic and statistical techniques for information recovery in metabonomics and metabolomics. Annual review of analytical chemistry (Palo Alto, Calif). 2008;1:45–69. doi: 10.1146/annurev.anchem.1.031207.113026. [DOI] [PubMed] [Google Scholar]
- 10.Amathieu R, et al. Nuclear magnetic resonance based metabolomics and liver diseases: Recent advances and future clinical applications. World Journal of Gastroenterology. 2016;22(1):417–426. doi: 10.3748/wjg.v22.i1.417. [DOI] [PMC free article] [PubMed] [Google Scholar]
- 11.Patti GJ, Yanes O, Siuzdak G. Innovation: Metabolomics: the apogee of the omics trilogy. Nature Reviews Molecular Cell Biology. 2012;13:263–269. doi: 10.1038/nrm3314. [DOI] [PMC free article] [PubMed] [Google Scholar]
- 12.Wolfender J, Marti G, Thomas A, Bertrand S. Current approaches and challenges for the metabolite profiling of complex natural extracts. Journal of Chromatography. 2015;A1382:136–164. doi: 10.1016/j.chroma.2014.10.091. [DOI] [PubMed] [Google Scholar]
- 13.Xie S, Niu J, Zhou W, Liu Y, Tian L. Developing a low fishmeal diet for juvenile Pacific white shrimp, Litopenaeus vannamei, using the nutritional value of FM as the reference profile. Aquaculture Nutrition. 2018;24(4):1184–1197. doi: 10.1111/anu.12657. [DOI] [Google Scholar]
- 14.Childs S, Williams L. An Introduction into the Role of Gas Chromatography - Mass Spectrometry (GC-MS) in Metabolomic Analysis. Chromatography Today. 2014;7(1):3–4. [Google Scholar]
- 15.Sun BJ, Xie HX, Song Y, Nie P. Gene structure of an antimicrobial peptide from mandarin fish, Siniperca chuatsi (Basilewsky), suggests that moronecidins and pleurocidins belong in one family: the piscidins. Journal of Fish Diseases. 2007;30:335–343. doi: 10.1111/j.1365-2761.2007.00789.x. [DOI] [PubMed] [Google Scholar]
- 16.Liu, J. K. & He, B. W. Cultivation of the Chinese Freshwater Fishes. Science Press, Beijing, China. 750 (in Chinese) (1992).
- 17.Jia, C., Wang, H., Song, R., Zhou, Y. Artificial propagation of Chinese perch. Fish Science and Technology Information2, 12–17 (in Chinese) (1974).
- 18.Chiang, I. On the biology of mandarin fish, Siniperca chuatsi of liang-tze lake. Acta Hydrobiologica Sinica3, 375–385 (in Chinese) (1959).
- 19.He S, et al. Insights into food preference in hybrid f1 of Siniperca chuatsi (♀) × Siniperca scherzeri (♂) mandarin fish through transcriptome analysis. BMC Genomics. 2013;14:601. doi: 10.1186/1471-2164-14-601. [DOI] [PMC free article] [PubMed] [Google Scholar]
- 20.Dou YQ, et al. Memory Function in Feeding Habit Transformation of Mandarin Fish (Siniperca chuatsi) International Journal of Molecular Sciences. 2018;19:1245. doi: 10.3390/ijms19041254. [DOI] [PMC free article] [PubMed] [Google Scholar]
- 21.Schuenhoffa A, et al. A semi-recirculating integrated system for the culture of fish and seaweed. Aquaculture. 2003;221(1-4):167–181. doi: 10.1016/S0044-8486(02)00527-6. [DOI] [Google Scholar]
- 22.Lazur M, Britt D. Pond Re-circulating Production Systems. SRAC Publication. 1997;455:146. [Google Scholar]
- 23.Mohammad A1-Z. Growth Profile of Gilthead Bream Reared in Mega Flow Re-circulating Aquaculture System. Journal of Agricultural Science and Technology A. 2014;4:307–314. [Google Scholar]
- 24.Fiehn O. Metabolomics – The link between genotypes and phenotypes. Plant Molecular Biology. 2002;48:155–171. doi: 10.1023/A:1013713905833. [DOI] [PubMed] [Google Scholar]
- 25.Rai AK, Swapna JR, Sachindra HC, Bhaskar NM, Baskaran NV. Application of native lactic acid bacteria (LAB) for fermentative recovery of lipids and proteins from fish processing wastes: bioactivities of fermentation products. Journal of Aquatic Food Product Technology. 2011;20(1):32–44. doi: 10.1080/10498850.2010.528174. [DOI] [Google Scholar]
- 26.Ghosh S, Baloni P, Vishveshwara S, Chandra N. Weighting schemes in metabolic graphs for identifying biochemical routes. Systems and Synthetic. Biology. 2014;8:47–57. doi: 10.1007/s11693-013-9128-0. [DOI] [PMC free article] [PubMed] [Google Scholar]
- 27.Lenz EM, Wilson ID. Analytical strategies in metabonomics. Journal of Proteome Research. 2007;6(2):443–58. doi: 10.1021/pr0605217. [DOI] [PubMed] [Google Scholar]
- 28.Wang Y, et al. Novel label-free and high-throughput microchip electrophoresis platform for multiplex antibiotic residues detection based on aptamer probes and target catalyzed hairpin assembly for signal amplification. Biosensors and Bioelectronics. 2017;97:100–106. doi: 10.1016/j.bios.2017.05.017. [DOI] [PubMed] [Google Scholar]
- 29.Xiao ZC, Ge CR, Zhou GH, Zhang WG, Liao GZ. 1H NMR-based metabolic characterization of Chinese Wuding chicken meat. Food Chemistry. 2019;274:574–582. doi: 10.1016/j.foodchem.2018.09.008. [DOI] [PubMed] [Google Scholar]
- 30.Park SE, et al. GC-MS based metabolomics approach of kimchi for the understanding of Lactobacillus plantarum fermentation characteristics. Lwt-food Science and Technology. 2016;68:313–21. doi: 10.1016/j.lwt.2015.12.046. [DOI] [Google Scholar]
- 31.Ma QQ, et al. Untargeted GC-MS metabolomics reveals metabolic differences in the Chinese mitten-hand crab (Eriocheir sinensis) fed with dietary palm oil or olive oil. Aquaculture Nutrition. 2018;24(6):1623–1637. doi: 10.1111/anu.12798. [DOI] [Google Scholar]
- 32.Ming TH, et al. A metabolomics and proteomics study of the Lactobacillus plantarum in the grass carp fermentation. BMC Microbiology. 2018;18:216. doi: 10.1186/s12866-018-1354-x. [DOI] [PMC free article] [PubMed] [Google Scholar]
- 33.Huang, C. H., Xiao, T. Y., Hu, Y., Zhao, Y. R., Liu, Q. L. Metabonomics analysis of hepatopancreas and serum of grass carp based on the hepatopancreas lipid and 1H-NMR. Journal of Fisheries of China39(9), 1365–1374 (in Chinese) (2015).
- 34.Schummer C, Delhomme O, Appenzeller BM, Wennig R, Millet M. Comparison of MTBSTFA and BSTFA in derivatization reactions of polar compounds prior to GC/MS analysis. Talanta. 2009;77(4):1473–82. doi: 10.1016/j.talanta.2008.09.043. [DOI] [PubMed] [Google Scholar]
- 35.Lee MY, et al. Discovery of serum protein biomarkers in drug-free patients with major depressive disorder. Progress in Neuro-psychopharmacology &. Biological Psychiatry. 2016;69:60–68. doi: 10.1016/j.pnpbp.2016.04.009. [DOI] [PubMed] [Google Scholar]
- 36.Lin CY, et al. Characterization of the metabolic actions of crude versus dispersed oil in salmon smolts via NMR-based metabolomics. Aquatic Toxicology. 2009;95:230–238. doi: 10.1016/j.aquatox.2009.09.006. [DOI] [PubMed] [Google Scholar]
- 37.Lee TH, Cheng ML, Shiao MS, Lin CN. Metabolomics study in severe extracranial carotid artery stenosis. BMC Neurology. 2019;19:138. doi: 10.1186/s12883-019-1371-x. [DOI] [PMC free article] [PubMed] [Google Scholar]
- 38.Sakai T, Watanabe K, Kawatsu H. Occurrence of ditaurobilirubin, bilirubin conjugated with two moles of taurine, in the gallbladder bile of yellowtail, Seriola quinqueradiata. Journal Biochemical. 1987;102:793–796. doi: 10.1093/oxfordjournals.jbchem.a122117. [DOI] [PubMed] [Google Scholar]
- 39.Wright CE, Tallan HH, Lin YY. Taurine: Biological update. Annual Review of Biochemistry. 1986;55(1):427–453. doi: 10.1146/annurev.bi.55.070186.002235. [DOI] [PubMed] [Google Scholar]
- 40.Yu, X. Study on the interaction between four active components of chinese herb and human serum album by high-performance affinity chromatography. Norhwest University (in Chinese) (2010).
- 41.Zhou, K. Synthesis and biological study of inositol phosphate analogues. Naikai University (in Chinese) (2011).
- 42.Mansour S, Beckerich JM, Bonnarme P. Lactate and amino acid catabolism in the cheese-ripening yeast Yarrowia lipolytica. Agricultural and Biological Sciences. 2008;74(21):6505–12. doi: 10.1128/AEM.01519-08. [DOI] [PMC free article] [PubMed] [Google Scholar]
- 43.Jangeun L, Geumsook H, Cherlho L, Hong YS. Metabolomics reveals alterations in both primary and secondary metabolites by wine bacteria. Journal of Agricultral Food Chemistry. 2009;57(22):10772–83. doi: 10.1021/jf9028442. [DOI] [PubMed] [Google Scholar]
- 44.Konstantinos AA, Marc AC, Suha J. Chemotaxonomy of fungi in the Rhizoctonia solanispecies complex performing GC/MS metabolite profiling. Metabolomics. 2013;9(Sup1):159–169. [Google Scholar]
- 45.Park SE, Seo SH, Lee KI, Na CS, Son HS. Metabolite profiling of fermented ginseng extracts by gas chromatography mass spectrometry. Journal of Ginseng Research. 2018;42(1):57–67. doi: 10.1016/j.jgr.2016.12.010. [DOI] [PMC free article] [PubMed] [Google Scholar]
Associated Data
This section collects any data citations, data availability statements, or supplementary materials included in this article.