Abstract
Patients with diabetes mellitus have a higher risk of developing Parkinson’s disease (PD). However, the molecular links between PD and diabetes remain unclear. In this study, we investigated the roles of thioredoxin-interacting protein (TXNIP) in Parkin/PINK1-mediated mitophagy in dopaminergic (DA) cells under high-glucose (HG) conditions. In streptozotocin-induced diabetic mice, TXNIP was upregulated and autophagy was inhibited in the midbrain, while the loss of DA neurons was accelerated by hyperglycemia. In cultured PC12 cells under HG, TXNIP expression was upregulated and the intracellular reactive oxygen species (ROS) levels increased, leading to cell death. Autophagic flux was further blocked and PINK1 expression was decreased under HG conditions. Parkin expression in the mitochondrial fraction and carbonyl cyanide 3-chlorophenylhydrazone (CCCP)-induced co-localization of COX IV (marker for mitochondria) and LAMP1 (marker for lysosomes) were also significantly decreased by HG. Overexpression of TXNIP was sufficient to decrease the expression of both PINK1 and Parkin in PC12 cells, while knockdown of the expression of TXNIP by siRNA decreased intracellular ROS and attenuated cellular injury under HG. Moreover, inhibition of TXNIP improved the CCCP-induced co-localization of COX IV and LAMP1 in PC12 cells under HG. Together, these results suggest that TXNIP regulates Parkin/PINK1-mediated mitophagy under HG conditions, and targeting TXNIP may be a promising therapeutic strategy for reducing the risk of PD under hyperglycemic conditions.
Keywords: Diabetes mellitus, Parkinson’s disease, High glucose, TXNIP, Mitophagy, PC12 cells
Introduction
Diabetes mellitus is primarily characterized by hyperglycemia, which leads to secondary pathological changes in multiple organs, especially the central nervous system [1, 2]. Patients with type-2 diabetes mellitus have a higher risk of developing Parkinson’s disease (PD) [3]. Hyperglycemia induces the overproduction of reactive oxygen species (ROS) [4] and the resulting oxidative stress is a core mechanism in diabetic complications [5]. However, the mechanism underlying the neuronal injury induced by hyperglycemia is not clear.
Thioredoxin-interacting protein (TXNIP) is the endogenous inhibitor protein for ROS elimination. Overexpression of TXNIP causes oxidative stress and promotes apoptosis [6]. TXNIP is upregulated under high-glucose (HG) conditions in several cell-types, such as endothelial and renal tubular cells [7, 8], and the overexpression of TXNIP results in the loss of dopaminergic (DA) neurons [9]. However, the effect of HG conditions on TXNIP in neurons has rarely been reported.
Mitochondrial dysfunction, which disturbs energy metabolism and depletes ATP, has been implicated in the pathogenesis of PD [10, 11]. Normally, the damage to mitochondria caused by exposure to mitochondrial toxins, environmental pesticides, or other forms of mitochondrial stress associated with the pathogenesis of PD, is mainly removed via the macroautophagy pathway (mitophagy) [12, 13]. Mitophagy is important for maintaining mitochondrial quality by coordinating mitochondrial dynamics, biogenesis, fission, and fusion. In mammals, there are both Parkin-dependent and Parkin-independent pathways of mitophagy [14, 15]. Here, we focused on Parkin-dependent mitophagy. A decrease in mitochondrial membrane potential caused by damage leads to the stabilization of PTEN-induced kinase 1 (PINK1) on the outer mitochondrial membrane. Then PINK1 phosphorylates ubiquitin, activating Parkin’s E3 ubiquitin ligase, leading to the recruitment of Parkin to the impaired mitochondria. Subsequently, activated Parkin polyubiquitinates mitochondrial outer membrane proteins, leading to their association with the ubiquitin-binding domains of autophagy receptors and the formation of autophagosomes. Next, the autophagosomes fuse with lysosomes to form autolysosomes, leading to degradation of the damaged mitochondria [16, 17]. Dysfunctional mitophagy is closely linked to PD. Mutations of Parkin and PINK1 lead to an autosomal recessive form of PD [18, 19]. Mitophagy is disturbed in diabetic nephropathy under hyperglycemic conditions [20]. However, the effect of HG on mitophagy in neurons has rarely been reported. This study was designed to investigate the relationship between TXNIP and mitophagy in DA neurons under HG conditions.
Materials and Methods
Reagents and Antibodies
The reagents/antibodies used were: Dulbecco’s modified Eagle’s medium (DMEM; Hyclone, Logan, UT), fetal bovine serum (FBS, BI, Israel), 6-OHDA (6-hydroxydopamine) and glucose (Aladdin, Shanghai, China), Parkin, LC3, and p62 antibodies (Cell Signaling Technology, Danvers, MA), tyrosine hydroxylase (TH; Millipore, Waltham, MA), PINK1 and TXNIP (Abcam, Cambridge, MA), GAPDH, goat anti-rabbit, and goat anti-mouse IgG horseradish peroxidase (HRP)-conjugated secondary antibodies (Santa Cruz, Dallas, TX), and dihydroethidium (DHE, Sigma, St Louis, MO).
Induction of Experimental Diabetes and PD models
C57BL/6 mice (23 g–25 g) were purchased from SLAC Laboratory Animal Co., Ltd. (Shanghai, China). All procedures involving animals were approved by the Committee on Animal Care of Soochow University and were conducted in accordance with the Guidelines for Animal Use and Care of the National Institutes of Health. The mice were fasted for 12 h before streptozotocin (STZ) injection. A single intraperitoneal injection of STZ (100 mg/kg; Sigma) dissolved in citrate buffer (0.1 mol/L, pH 4.2) was administered. Control animals were injected with vehicle only. The development of diabetes was confirmed by measuring the fasting plasma glucose concentration (>16.7 mmol/L). Seven days later, the mice were randomly assigned into saline-treated, STZ-treated, MPTP (1-methyl-4-phenyl-1,2,3,6-tetrahydropyridine)-treated, and MPTP + STZ-treated groups. The mice in the latter two groups received 20 mg/kg MPTP and 250 mg/kg probenecid daily for 5 days to generate the PD model.
Behavioral Test
The mice performed the “pole test” to assess motor coordination 1 day prior to MPTP injection and on days 1, 3, 5 and 12 after injection. Mice were trained for 3 days before MPTP injection. The pole test consisted of a gauze-taped pole (50 cm high, 1 cm diameter) with a small cork ball at the top. Mice were placed with their head facing upwards immediately below the ball. The time to turn (T-turn) and the time to the floor (T-total) were recorded. The test was performed 3 times at 10-min intervals, and the average time was recorded.
Detection of ROS In Vivo
Based on a previous publication [21], we used DHE to investigate the in situ production of ROS. DHE (200 μg in 200 μL saline) was injected via tail vein in anesthetized mice. Three hours after DHE injection, the mice were transcardially perfused with fixative (4% paraformaldehyde, 0.1% glutaraldehyde, and 15% picric acid in PBS). Brains were removed and postfixed overnight in 4% paraformaldehyde. To observe ROS in SNc dopaminergic cells, sections were incubated overnight with TH antibody (1:800; Millipore). Sections were incubated with the fluorescent secondary antibody (anti-rabbit IgG Alexa fluor 488, 1:500; Cell Signaling Technology) to visualize TH-positive cells. The images of DHE and TH fluorescence were recorded by fluorescence 275 microscopy (Axio Scope A1, Zeiss, Jena, Germany).
Immunohistochemistry
After fixation, brain samples were postfixed in 4% paraformaldehyde at 4°C overnight and then transferred to 15% and 30% sucrose in PBS for 2 days. The samples were sectioned at 30 μm. Briefly, the sections were permeabilized in PBST (PBS containing 0.3% Triton X-100) for 1 h and blocked with 5% BSA in PBS for 1 h at room temperature. Then, they were incubated with primary antibody (anti-TH, 1:800; Millipore) at 4°C overnight and the appropriate anti-rabbit secondary antibody for 1 h at room temperature. Immunostaining was visualized by immersion in DAB (3,3′-diaminobenzidine) solution for 10 min. For quantification in in vivo studies, the numbers of TH-positive cells in the substantia nigra pars compacta (SNc) were assessed using an optical fractionator (Stereo Investigator 7, MBF Bioscience, Williston, VT). This method has been described in a previous publication [22]. Briefly, the region of the SNc in midbrain sections was outlined at low magnification (40×). The counting frame size was 50 μm × 50 μm and the sampling grid size was 100 μm × 100 μm. All stereological analyses were performed at 200× magnification under an Olympus BX52 microscope (Olympus America Inc., Melville, NY).
Dopamine and DOPAC Determination in the Striatum
Dopamine and its metabolite dihydroxyphenylacetic acid (DOPAC) in mouse striatum were determined using liquid chromatography with tandem mass spectrometry (LC-MS/MS). Dissected striatal tissue was homogenized in ice-cold 70% acetonitrile (10 μL/mg tissue) and centrifuged at 20,000 rpm for 25 min. Then, the supernatant was injected into the LC-MS/MS. Sample separations were carried out at 25°C on a C18 column (Hypersil GOLD C18, 100×2.1 mm, 3 μm, Thermo Scientific, Waltham, MA). The mobile phase was a mixture of 5 mmol/L ammonium formate in MilliQ water (30%) and 0.1% formic acid in acetonitrile (70%). The flow rate was 0.3 mL/min. The MS detection system consisted of Q-Exactive (Thermo Savant, Waltham, MA) with electrospray ionization (ESI) in positive ion mode for dopamine, and negative ion mode for DOPAC.
Cell Culture
PC12 cells were cultured in DMEM supplemented with 10% FBS. Cells were cultured as a monolayer under 5% CO2 in a humidified incubator at 37°C.
Assay of MTT Conversion
The PC12 cells were seeded into 96-well plates at 104 cells/well in 200 μL culture medium. PC12 cells were exposed to 50 mmol/L glucose for 24 h followed by 100 mmol/L 6-OHDA for another 24 h. After treatment, the medium was replaced with 200 μL DMEM containing 0.5 mg/mL MTT and incubated at 37°C for 4 h. Afterwards, the supernatant was aspirated and the cells were lysed in 200 μL dimethylsulfoxide for 20 min at 37°C. The optical density values were measured at 490 nm using a plate reader. The values are presented as fold of the control group.
Quantitative Real-time Polymerase Chain Reaction (PCR)
Total RNA was extracted using TRIzol reagent (Invitrogen, Carlsbad, CA) according to the protocol supplied by the manufacturer. Reverse transcription of 0.5 µg total RNA for synthesizing cDNA was performed using the RevertAid First Strand cDNA Synthesis Kit (Thermo Fisher Scientific, Waltham, MA). Real-time PCR was conducted using SYBR Green PCR Master Mix (Selleck, Shanghai, China) on an Opticon real-time PCR Detection System (7500; Applied Biosystems, Grand Island, NY). Relative fold differences in expression were calculated using the 2(-Delta Delta C(t)) method after normalization to GAPDH expression. The following primers for mouse were synthesized by Genewiz (Suzhou, China): GAPDH forward: 5′-CAAGTTCAACGGCACAGTCA-3′; reverse: 5′-CACCCCATTTGATGTTAGCG-3′; PINK1 forward: 5′-GGTGTCAGGCTGGGGCAA-3′; reverse: 5′-TGGCTTCATACACAGCGGC-3′.
Plasmids and Transfection
The plasmids expressing TXNIP and TXNIP siRNA were from Gene Pharma (Suzhou, China). PC12 cells were cultured in 6-well plates (5×10⁵ cells/well). PC12 cells at 70%–80% confluence were transfected with TXNIP cDNA (2 μg) using Lipofectamine 3000 for 48 h. To inhibit TXNIP expression, TXNIP siRNA (5′-CAU CCU UCG AGU UGA AUA UTT-3′) or negative control siRNA (120 pmol per 6-well plate) was transfected using Lipofectamine 3000. The cells were transfected with siRNAs for 48 h.
Mitochondrial Fraction
Cells cultured in 10-cm dishes were suspended in 5 mL cytosol buffer, and lysed by passage through a 25-gauge needle 20 times. Then, the buffer was centrifuged at 13,000 rpm for 10 min at 4°C. Then, the supernatant was centrifuged at 80,000 rpm for 15 min at 4°C. The pellet, corresponding to the mitochondrial fraction, was lysed in ice-cold NP-40 lysis buffer on ice for 30 min, then centrifuged at 13,000×g for 20 min. Formulation of cytosol buffer (in mmol/L): 20 HEPES, 10 KCl, 1.5 MgCl2, 1 EDTA, 1 EGTA, and 1 dithiothreitol. Formulation of NP-40 lysis buffer: 50 mmol/L Tris-HCl (pH 7.5), 150 mmol/L NaCl, 1% Nonidet P-40, 0.5% sodium deoxycholate, 0.1% sodium dodecyl sulfate, and 1 mmol/L dithiothreitol. Finally, protease inhibitor reagent (Selleck, China) was added to each buffer before use.
Western Blot Analysis
The cells were washed thrice with ice-cold PBS and lysed in RIPA containing phenylmethylsulfonyl fluoride on ice for 30 min. Meanwhile, brain tissues were homogenized in RIPA (10 μL/mg tissue) by a homogenizer for 30 s, and lysed on ice for 30 min. The samples were centrifuged for 25 min at 12,000 rpm at 4°C, and the supernatants were collected. The protein (60 μg for each extract) was resolved by 10% SDS-PAGE, electroblotted to PVDF membrane, and blocked in 5% non-fat milk at room temperature. The membranes were incubated with primary antibodies overnight at 4°C, then washed with TBST and probed with HRP-conjugated anti-rabbit or anti-goat IgG.
Measurement of Intracellular ROS
The intracellular ROS were measured using the fluorescent marker 2,7-dichlorodihydrofluorescein diacetate (H2DCFDA) (Sigma-Aldrich, St Louis, MO) according to the manufacturer’s instructions. The medium was replaced with 1 mL H2DCFDA (25 μmol/L) and the cells were incubated at 37°C for 30 min. Then, the cells were washed thrice with cold PBS and suspended in 500 μL PBS for flow cytometry (FC500; Beckman Coulter, Brea, CA).
Immunofluorescence
Cells were fixed in ice-cold methanol for 15 min at –20°C, followed by 3×5 min washes in PBS. Then, they were fixed in 4% paraformaldehyde for 15 min at room temperature (RT) and permeabilized in 0.3% Triton-X for 30 min at RT. Blocking was carried out for 1 h at RT in 5% BSA-PBST. The cells were incubated in goat anti-mouse cytochrome c oxidase IV (COX IV, 1:200; Cell Signaling Technology) and goat anti-rabbit LAMP1 (1:400; Abcam) for 18 h at 4°C. Secondary antibodies were incubated for 1 h at RT. The images were recorded by fluorescence microscopy (Axio Scope A1, Zeiss, Jena, Germany).
Statistical Analysis
Data are presented as the mean ± SEM. Statistical comparisons were conducted using one-way ANOVA and Student’s t test in SPSS 16.0 (SPSS Inc., Chicago, IL). P < 0.05 was considered to be statistically significant.
Results
TXNIP is Increased in the Brains of Diabetic Mice
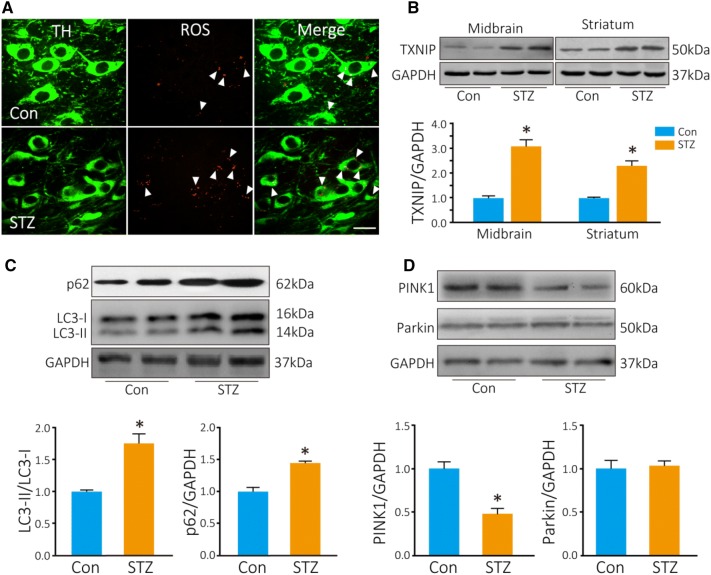
Seven days after STZ injection, blood glucose was determined after fasting overnight and was significantly higher in the STZ-treated mice than in the control mice (22.9 ± 1.8 mmol/L in STZ-treated mice versus 8.2 ± 0.5 mmol/L in controls). DHE was used to measure the ROS production in TH cells in vivo. Three hours after DHE injection, the number of red fluorescent puncta in TH neurons was significantly higher in diabetic mice than in controls (8 ± 2.3 puncta per cell in diabetic mice vs 3.7 ± 1.1 puncta per cell in controls; Fig. 1A). TXNIP is a key regulator of intracellular ROS production, so we determined the TXNIP levels in the striatum and midbrain by Western blot analysis. TXNIP was significantly increased by 3-fold in the midbrain and 2.5-fold in the striatum (P = 0.019 in midbrain, P = 0.024 in striatum; Fig. 1B).
Fig. 1.
ROS and TXNIP are increased in TH+ neurons in diabetic mice. A Photomicrographs of in situ ROS as assessed by DHE (red, arrowheads); dopaminergic neurons are stained by TH antibody (green). B Western blots and analysis of TXNIP. Autophagy is inhibited in the midbrain of diabetic mice. C, D Western blots and analyses of LC3, p62, PINK1, and Parkin in diabetic (STZ) and control (Con) mice (*P < 0.05 vs controls; n = 4; scale bar, 20 μm).
Autophagy is Inhibited in the Midbrain of Diabetic Mice
We then explored the change in autophagy in the midbrain of diabetic mice. LC3-II, a marker of autophagosomes, was increased by ~1.7-fold (P = 0.04), and p62, a substrate of autophagy, was also increased (P = 0.03) (Fig. 1C). It has been reported that dysfunctional mitochondria are mainly eliminated via the PINK1–Parkin-mediated autophagic pathway [14]. We found that PINK1 was decreased by 50% in the midbrain of diabetic mice compared with controls (P = 0.04; Fig. 1D). However, Parkin did not change in diabetic mice. These results indicated that autophagic flux is blocked in the midbrain of diabetic mice.
MPTP-induced Loss of TH+ Neurons is Accelerated in Diabetic Mice
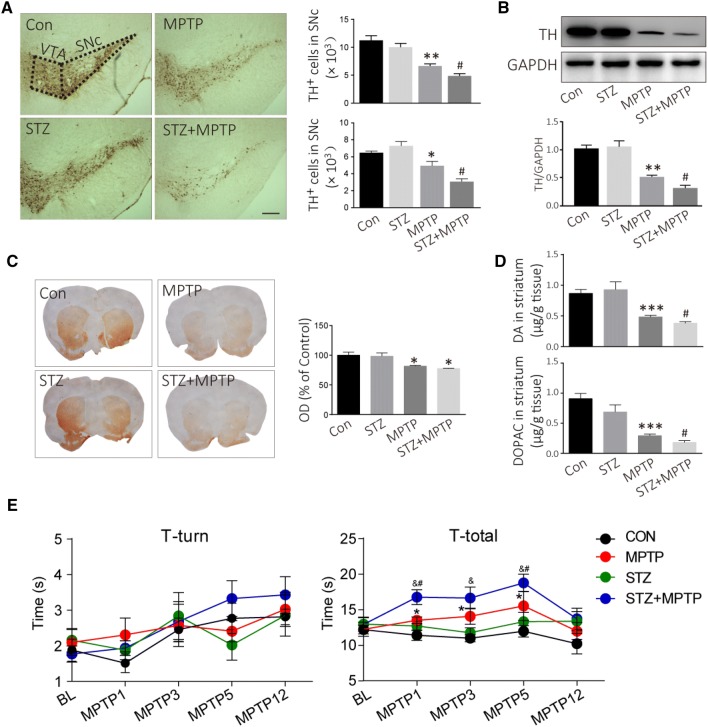
Seven days after STZ administration, the mice were intraperitoneally injected with MPTP daily for 5 days to create the PD model. The DA neurons in the SNc and ventral tegmental area were stained with TH antibody (Fig. 2A). MPTP injection induced a 41% loss of TH-positive cells in the SNc in normal mice (P = 0.002, vs controls), and a 57% loss in diabetic mice (P = 0.020 vs MPTP-injected mice; Fig. 2A). No difference was found in TH expression in the midbrain between the control and diabetic mice before MPTP injection (Fig. 2B). However, TH was decreased by ~68% in diabetic mice (P = 0.003), whereas it was only decreased by 55% in normal mice after MPTP injection (P = 0.001) (Fig. 2B). TH in the dorsal striatum can be used to evaluate the nigrostriatal DA pathway. The TH-positive fiber density in the dorsal striatum decreased after MPTP injection both in normal and diabetic mice (P = 0.031; Fig. 2C). In addition, DA decreased to 0.38 ± 0.07 μg/g tissue in diabetic mice after MPTP injection, while it only decreased to 0.48 ± 0.08 μg/g tissue in normal mice after MPTP injection (Fig. 2D). Similarly, DOPAC, a metabolite of DA, also showed a further decline in diabetic mice compared to normal mice after MPTP injection (P = 0.013; Fig. 2D). In addition, we used the pole test to assess the motor activity, and to determine whether the MPTP-induced PD model displayed bradykinesia. The T-total increased on days 1, 3, and 5 after MPTP injection (Fig. 2E). Meanwhile, STZ further aggravated the MPTP-induced bradykinesia on days 1, 3, and 5 after MPTP injection (P < 0.05; Fig. 2E). These results suggest that DA neurons are more vulnerable to damage under the hyperglycemic conditions in diabetes.
Fig. 2.
Hyperglycemia accelerates the loss of TH+ neurons induced by MPTP, and aggravates MPTP-induced bradykinesia. A Representative images and analyses for DA neurons assessed by TH immunohistochemistry (scale bar, 200 μm). B Western blots and analysis for TH expression in the midbrain. C TH-positive fibers in the dorsal striatum assessed by TH immunohistochemistry. D DA and DOPAC in the striatum analyzed using LC-MS/MS. E Motor activity as assessed by the pole test. ***P < 0.001,**P < 0.01, *P < 0.05 vs controls; #P < 0.05 vs MPTP-treated mice; n = 4; &P < 0.05 vs STZ-treated mice; n = 6–8 for the pole test.
Effect of HG on PC12 Cell Viability
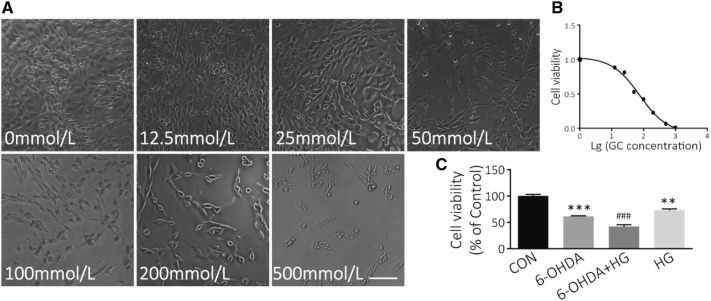
The MTT assay was used to measure the effect of HG on neuronal cell death. PC12 cells were treated with various concentrations of glucose from 5 to 500 mmol/L for 48 h. HG significantly decreased the viability of PC12 cells compared with controls (Fig. 3A), and the IC50 was 75.06 mmol/L (Fig. 3B). Glucose at 50 mmol/L was selected for HG treatment, and 5 mmol/L for the control in further studies. In addition, HG/6-OHDA co-treatment further increased the death of PC12 cells compared with those exposed to 6-OHDA alone (P < 0.001; Fig. 3C). These data suggest that DA neurons are damaged under HG conditions. Moreover, HG may be a risk factor in the pathological conditions of PD.
Fig. 3.
HG treatment induces PC12 cell death. A Bright-field images of cell morphology at different glucose concentrations (scale bar, 200 μm). B Survival curve of PC12 cells after exposure to different concentrations of glucose for 48 h (IC50 = 75.06 mmol/L). C PC12 cell viability determined by MTT assays. PC12 cells were exposed to 50 mmol/L glucose for 24 h followed by 100 μmol/L 6-OHDA for another 24 h (**P < 0.01, ***P < 0.001 vs controls; ###P < 0.001 vs 6-OHDA-treated group; n = 3).
TXNIP is Upregulated in PC12 Cells after HG Treatment
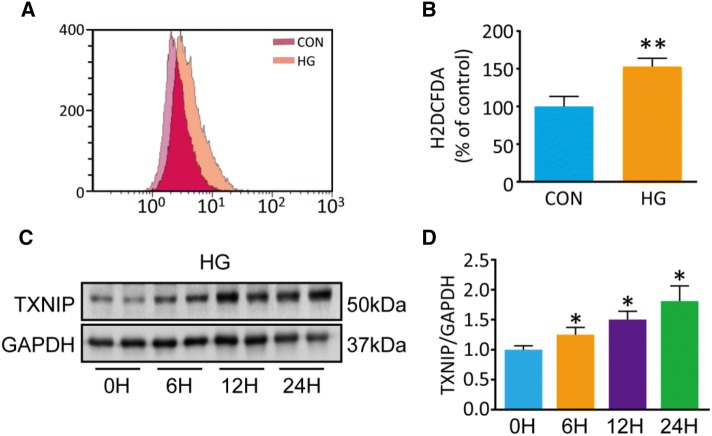
We used H2DCFDA to assess the intracellular ROS and found that, it was significantly increased by 1.5-fold in HG-treated PC12 cells compared with controls (P = 0.006; Fig. 4A, B). While several studies have reported that TXNIP is induced by HG treatment, the effect of HG on TXNIP expression in neurons was not clear. To determine the expression of TXNIP, we performed Western blot experiments using PC12 cells incubated at low (5 mmol/L) or high (100 mmol/L) glucose concentrations for 6, 12, and 24 h. We found that HG significantly increased TXNIP expression by 1.8-fold at 24 h compared with controls (P = 0.006; Fig. 4D). This finding indicates that TXNIP is involved in the injury of PC12 cells induced by HG treatment.
Fig. 4.
Intracellular ROS and TXNIP are notably increased in PC12 cells after 50 mmol/L HG treatment compared with controls (5 mmol/L glucose). A Flow cytometry for intracellular ROS stained by H2DCDFA. B Quantification of ROS (**P < 0.01 vs controls; n = 3). C, D Western blots and analysis for TXNIP (*P < 0.05 vs 0 h group; n = 3).
HG Results in Autophagy Dysfunction
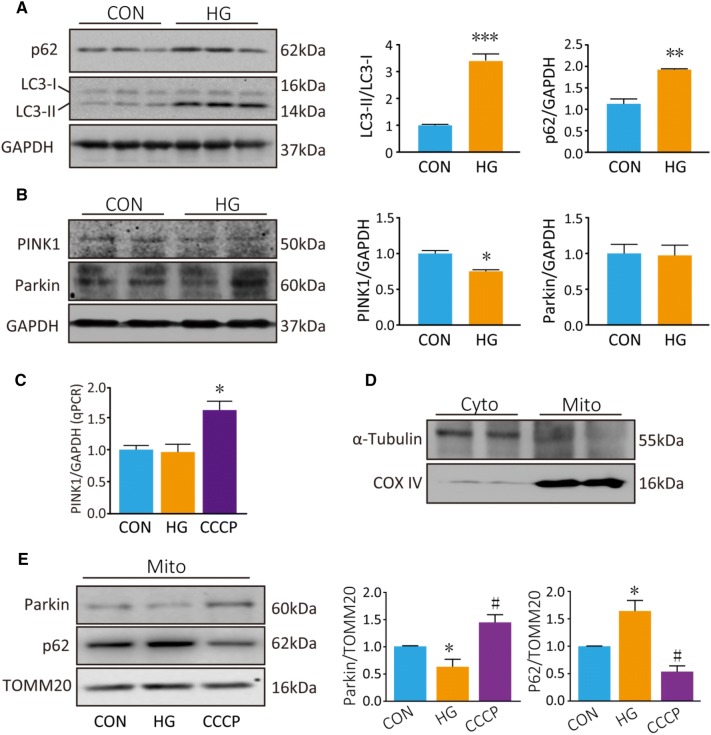
We next explored the effect of HG on autophagy. The results showed that LC3-II was increased by ~3.5-fold in PC12 cells that were incubated in HG for 48 h (P < 0.001; Fig. 5A). This indicated that autophagosomes were induced in PC12 cells under HG. However, p62, a marker of autophagic degradation, accumulated in HG-treated cells (P = 0.002; Fig. 5A). Furthermore, PINK1 declined by ~25% in whole-cell homogenates of HG-treated PC12 cells (P = 0.033; Fig. 5B). However, Parkin, another important regulator in mitophagy, did not change in whole-cell homogenates after HG treatment (P = 0.903). To assess whether PINK1 transcription is also regulated by HG, we assessed PINK1 mRNA in PC12 cells treated with HG for 48 h or CCCP (20 μmol//L, a widely used inducer of mitophagy) for 6 h. PINK1 mRNA was increased by CCCP treatment (P = 0.012; Fig. 5C). However, PINK1 mRNA did not change following HG treatment. These data indicate that the decrease in PINK1 protein expression following HG treatment is not driven by a decrease in PINK1 transcription.
Fig. 5.
HG blocks autophagic flux and inhibits Parkin/PINK1-mediated mitophagy in PC12 cells. A, B Western blots and analyses for LC3, p62, PINK1, and Parkin after HG treatment for 48 h. C qPCR analysis of PINK1 mRNA. D Western blots of the cytosolic protein α-tubulin and mitochondrial protein COX IV cytosolic (Cyto) and mitochondrial (Mito) fractions. E Western blots and analyses for Parkin and p62 in the mitochondrial fraction. COX IV served as a loading control for mitochondrial protein. *P < 0.05, **P < 0.01, ***P < 0.001 vs controls; #P < 0.05 vs HG group; n = 3.
There is evidence that Parkin is recruited to damaged mitochondria, and mitophagy is dependent on the accumulation of Parkin in the outer mitochondrial membrane. So, next we measured Parkin in the mitochondrial fraction. First, the purity of the isolated mitochondrial fractions was confirmed by the absence of the cytosolic protein α-tubulin and the presence of the mitochondrial protein COX IV (Fig. 5D). HG treatment decreased the Parkin level in the mitochondrial fraction (P = 0.020; Fig. 5E), but CCCP led to an increased Parkin level in the mitochondrial fraction (P = 0.020; Fig. 5E) as previously described [23, 24]. Furthermore, p62 accumulated in the mitochondrial fraction after HG treatment (P = 0.016; Fig. 5E), but was downregulated after CCCP treatment (P < 0.001) as previously described [23]. p62 is a known target for autophagic degradation. Taken together, these results point out that HG treatment blocks the autophagic flux in PC12 cells.
HG Blocks Mitophagy
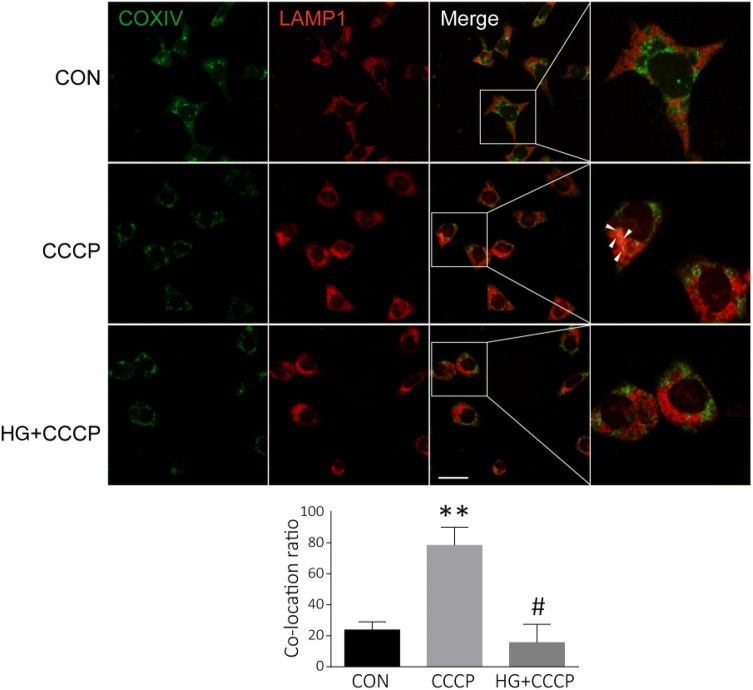
To confirm that the inhibition of mitophagy resulted from HG, we measured the co-localization of mitochondria and lysosomes in PC12 cells. As noted above, mitophagy is a selective degradation pathway for damaged mitochondria through double-membrane autophagosomes, which then fuse with lysosomes to form autolysosomes in which mitochondria are degraded. LAMP1 is a lysosomal P-type transport ATPase, and is considered to be a lysosome marker. COX IV and LAMP1 immunofluorescence staining was used to observe mitochondria and lysosomes, respectively. Under normal conditions, little co-staining of COX IV and LAMP1 was observed (Fig. 6). CCCP induced co-localization of mitochondrial COX IV and lysosomal LAMP1, indicating mitophagy (Fig. 6). However, pretreatment with HG for 48 h inhibited the co-localization of COX IV and LAMP1 induced by CCCP (Fig. 6). Taken together, these results demonstrate that mitophagy is inhibited in PC12 cells under HG conditions.
Fig. 6.
HG inhibits the mitophagy induced by CCCP. Representative images and analysis of co-localization of the mitochondrial protein COX IV (green) and the lysosomal protein LAMP1 (red) in PC12 cells incubated in low (5 mmol/L) or high (25 mmol/L) glucose medium for 48 h, then treated with CCCP (20 μmol/L) for another 6 h (**P < 0.01 vs controls; #P < 0.05 vs CCCP group; scale bar, 20 μm; three independent experiments were carried out in each group).
TXNIP Inhibits Mitophagy
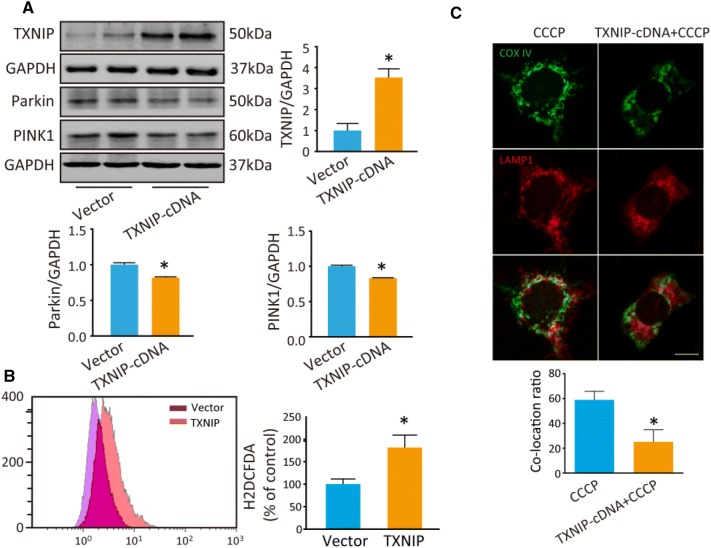
Our previous study reported that overexpression of TXNIP inhibits autophagic flux [9]. In the present study, we transfected TXNIP plasmid into PC12 cells to explore the effect of TXNIP on mitophagy. First, TXNIP was significantly increased in PC12 cells after transfection (P = 0.041; Fig. 7A). Then, we assessed Parkin and PINK1 by Western blot analysis. Consistent with the results of HG treatment, PINK1 was lower in TXNIP-overexpressing cells than in controls (P = 0.005), as was Parkin (P = 0.025) (Fig. 7A). Mitophagy is important for maintaining mitochondrial quality and the intracellular ROS level, so we assessed intracellular ROS using H2DCFDA. The results showed that ROS was increased in TXNIP-overexpressing cells (P = 0.036; Fig. 7B). Furthermore, the co-localization of COX IV and LAMP1 induced by CCCP was inhibited in PC12 cells under HG conditions (Fig. 7C).
Fig. 7.
Overexpression of TXNIP inhibits mitophagy and inhibition of TXNIP decreases intracellular ROS induced by HG. A Western blots and analysis of TXNIP, Parkin and PINK1 in PC12 cells after transfection with TXNIP cDNA for 48 h. B Intracellular ROS was stained by H2DCDFA and determined by flow cytometry after transfection of TXNIP cDNA. C Co-localization analysis of mitochondrial protein COX IV (green) and lysosomal protein LAMP1 (red) to assess mitophagy. *P < 0.05 vs vector group; n = 3; scale bar, 20 μm; three independent immunofluorescence experiments were carried out in each group.
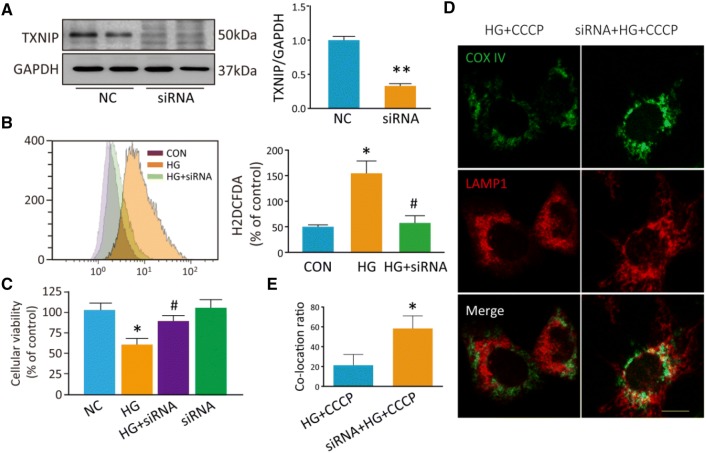
Next, we transfected siRNA into PC12 cells to inhibit TXNIP expression and this decreased TXNIP expression by 70% compared with controls (P = 0.009; Fig. 8A). Moreover, the inhibition of TXNIP decreased the intracellular ROS induced by HG (P = 0.025; Fig. 8B). We used MTT assays to determine the cellular viability and found that the inhibition of TXNIP in PC12 cells relieved the cell injury induced by HG (P = 0.041; Fig. 8C). As noted above, co-localization of COX IV with LAMP1 was rare in PC12 cells under HG+CCCP conditions. However, when TXNIP was inhibited by siRNA transfection, more co-localization occurred between COX IV and LAMP1 under these conditions (Fig. 8D, E). These findings indicate that TXNIP is involved in the mitophagy dysfunction induced by HG.
Fig. 8.
Inhibition of TXNIP relieves the PC12 cell injury induced by HG, and restores mitophagy induced by CCCP under HG conditions. A Western blots and analysis for TXNIP after transfection with TXNIP siRNA for 48 h. B Flow cytometry and analysis for intracellular ROS stained by H2DCDFA after transfection with TXNIP siRNA. C MTT assays of cellular viability. D Images of co-localization of the mitochondrial protein COX IV (green) and the lysosomal protein LAMP1 (red) to assess mitophagy. E Co-localization analysis of mitochondrial protein COX IV and lysosomal protein LAMP1. *P < 0.05, **P < 0.01 vs controls; #P < 0.05 vs HG group; n = 3; scale bar, 20 μm; three independent immunofluorescence experiments were carried out in each group.
Discussion
Our results showed that TXNIP was increased and autophagy was inhibited in the midbrain of diabetic mice. Moreover, hyperglycemia accelerated the DA neuron loss induced by MPTP in vivo, and HG induced PC12 cell death in vitro. In addition, HG increased ROS production and upregulated TXNIP in PC12 cells. Furthermore, autophagic flux was blocked and mitophagy was inhibited in PC12 cells under HG conditions. Moreover, Parkin and PINK1 decreased in PC12 cells transfected with TXNIP cDNA. These findings indicate that hyperglycemia induces mitophagy dysfunction and results in DA neuronal injury in diabetes mellitus.
Blood glucose is commonly increased in diabetes mellitus, and chronic hyperglycemia damages brain cells through increased production of ROS [25]. Diabetes mellitus is associated with worsened motor symptoms and greater striatal DA deficits in the early stage of PD [26], and patients with type 2 diabetes have a higher risk of developing PD [27]. In fact, several dysregulated pathways, such as oxidative stress and inflammation, are common underlying processes that cause PD and diabetes [5, 28–31]. In the present study, we selected PC12 cells, a commonly-used cell line in PD studies in vitro, to investigate the effect of HG on DA cells. Similar to other reports [32], we found that HG significantly induced PC12 cell death. Different concentrations of glucose were used in HG-induced injury in PC12 cells, ranging from 25 to 100 mmol/L, and we selected 50 mmol/L glucose to induce PC12 cell injury based on the survival curve [33, 34]. Moreover, we found that HG further promotes cell death when cells were co-treated with HG and 6-OHDA. In experimental models, the DA neuronal degeneration induced by MPTP is exacerbated in mice with type 2 diabetes [35]. These findings suggest that HG or hyperglycemia is a risk factor for DA neuron death in PD.
Chronic hyperglycemia damages brain cells through increased production of ROS. An elevated level of cellular ROS is a key mediator of glucose-induced neurotoxicity [36, 37]. We found that ROS was notably increased in PC12 cells after HG treatment. TXNIP promotes oxidative stress by binding to thioredoxin [6] and TXNIP increases under oxidative stress conditions. In addition, it is strongly induced by glucose and increased in diabetes, while it promotes β-cell apoptosis [38] and diabetic retinopathy [39] and nephropathy[20]. However, few studies have reported whether HG induces TXNIP expression in DA cells. We found that TXNIP was significantly upregulated in PC12 cells incubated with HG, indicating that TXNIP is involved in the DA cell injury induced by HG treatment.
Since mitochondria are considered to be the main source of intracellular ROS, we explored the effect of HG on mitophagy in PC12 cells. Mitochondrial dysfunction has been reported both in diabetes or diabetic complications (such as diabetic retinopathy and cardiomyopathy) [40] and in PD [41–43]. TXNIP induces mitochondrial dysfunction through the p38/MAPK pathway in diabetic retinopathy [8], while TXNIP inhibits autophagic flux and induces α-synuclein accumulation under pathological PD conditions [9]. Under normal conditions, dysfunctional mitochondria are removed through mitophagy, which maintains the mitochondrial number to match metabolic demand and exerts mitochondrial quality control [44]. PINK1-dependent activation of Parkin is a major route of mitophagy. Under basal conditions, PINK1 is imported into mitochondria through the translocases of the outer and inner membrane complexes. Usually, PINK1 is integrated into the outer membrane but is rapidly cleaved by proteases, generating a cleaved form of PINK1 [45], which is released into the cytosol, where it is degraded by the ubiquitin proteasome system. However, PINK1 turnover is disrupted when mitochondria are damaged by toxins. Full-length PINK1 is stabilized on the damaged mitochondrial membrane [46] and phosphorylates Parkin, which is recruited to the damaged mitochondria. Then, the activated Parkin polyubiquitinates mitochondrial outer membrane proteins to initiate mitophagy. Full-length PINK1 is essential for mitophagy to remove impaired mitochondria [47]. A decrease in full-length PINK1 has been reported under conditions of mitophagy inhibition in human induced pluripotent stem cell-based PD models [48]. In the present study, full-length PINK1 accumulated significantly in the mitochondrial fraction after treatment with CCCP, a mitochondrial depolarizing agent, and this result is consistent with published studies [48, 49]. However, full-length PINK1 was decreased in HG-treated or TXNIP-transfected cells. There was no significant change of PINK1 mRNA levels under HG conditions, indicating that the decreased PINK1 protein expression following HG treatment is not driven by a decrease in PINK1 transcription. PINK1 is activated by PTEN [50], which is inhibited by TXNIP [51]. This mechanism may account for the decreased full-length PINK1 in PC12 cells under HG conditions. Failure of mitophagy results in the accumulation of damaged mitochondria and oxidative stress induced by ROS [44]. The inhibition of TXNIP reduces intracellular ROS, which we assessed with H2DCFDA. ROS detected by H2DCFDA is not selective for mitochondrial ROS – MitoSOX is more appropriate for evaluating mitochondria ROS. It has been reported that downregulation of TXNIP reverses the inhibition of mitophagy induced by HG in HK2 cells [52]. In our study, PINK1 was significantly inhibited in PC12 cells after HG treatment. Meanwhile, both PINK1 and Parkin were notably decreased in cells overexpressing TXNIP. Moreover, when TXNIP was inhibited by siRNA transfection in PC12 cells, more co-localization occurred between COX IV and LAMP1 under HG+CCCP conditions. These results suggest that HG causes mitophagy dysfunction via the upregulation of TXNIP. It has recently been reported that ROS is necessary for PINK1-mediated mitophagy [53]. This seems to contradict our results, in which a decrease of TXNIP inhibited the intracellular ROS level. We speculate that TXNIP can regulate PINK1/Parkin-mediated mitophagy via a mechanism other than ROS. For instance, TXNIP may interact with PINK1, and prevent the translocation of PINK1 to mitochondria. There are still shortcomings in the present study. We do not know the exact role of TXNIP in the regulation of PINK1/Parkin-mediated mitophagy, and this deserves further study. Moreover, we plan to explore the effect of HG on Parkin-independent mitophagy, which was not evaluated in this paper.
In summary, HG increased the expression of TXNIP, an endogenous protein promoting oxidative stress, resulting in Parkin/PINK1-mediated mitophagy dysfunction in DA cells. All these results suggested that TXNIP is involved in the Parkin/PINK1-mediated mitophagy dysfunction induced by HG, and that TXNIP is a promising therapeutic target for reducing the risk of PD under hyperglycemic conditions.
Acknowledgements
This work was supported by the National Science Foundation of China (81601098 and 81603181), the Natural Science Foundation of Jiangsu Province (BK20150302, BK20170004), the Natural Science Foundation of the Jiangsu Higher Education Institutions of China (19KJB310016), Suzhou Science and Technology for People’s Livelihood (SYS201706), and the Natural Science Foundation of Suzhou (SYSD2018099).
Conflict of interest
The authors declare no potential conflicts of interest with respect to the research, authorship, and/or publication of this article.
Footnotes
Cun-Jin Su and Zhu Shen have contributed equally to this work.
Contributor Information
Tong Liu, Email: liutong80@suda.edu.cn.
Yun-Li Yu, Email: haoyyl0902@163.com.
References
- 1.Luitse MJ, Biessels GJ, Rutten GE, Kappelle LJ. Diabetes, hyperglycaemia, and acute ischaemic stroke. Lancet Neurol. 2012;11:261–271. doi: 10.1016/S1474-4422(12)70005-4. [DOI] [PubMed] [Google Scholar]
- 2.Liu RY, Wang JJ, Qiu X, Wu JM. Acute hyperglycemia together with hematoma of high-glucose blood exacerbates neurological injury in a rat model of intracerebral hemorrhage. Neurosci Bull. 2014;30:90–98. doi: 10.1007/s12264-013-1371-6. [DOI] [PMC free article] [PubMed] [Google Scholar]
- 3.Biosa A, Outeiro TF, Bubacco L, Bisaglia M. Diabetes mellitus as a risk factor for Parkinson’s disease: a molecular point of view. Mol Neurobiol. 2018;55:8754–8763. doi: 10.1007/s12035-018-1025-9. [DOI] [PubMed] [Google Scholar]
- 4.Kaplan M, Aviram M, Hayek T. Oxidative stress and macrophage foam cell formation during diabetes mellitus-induced atherogenesis: role of insulin therapy. Pharmacol Ther. 2012;136:175–185. doi: 10.1016/j.pharmthera.2012.08.002. [DOI] [PubMed] [Google Scholar]
- 5.Pickering RJ, Rosado CJ, Sharma A, Buksh S, Tate M, de Haan JB. Recent novel approaches to limit oxidative stress and inflammation in diabetic complications. Clin Transl Immunology. 2018;7:e1016. doi: 10.1002/cti2.1016. [DOI] [PMC free article] [PubMed] [Google Scholar]
- 6.Nasoohi S, Ismael S, Ishrat T. Thioredoxin-interacting protein (TXNIP) in cerebrovascular and neurodegenerative diseases: regulation and implication. Mol Neurobiol. 2018;55:7900–7920. doi: 10.1007/s12035-018-0917-z. [DOI] [PMC free article] [PubMed] [Google Scholar]
- 7.Li X, Kover KL, Heruth DP, Watkins DJ, Guo Y, Moore WV, et al. Thioredoxin-interacting protein promotes high-glucose-induced macrovascular endothelial dysfunction. Biochem Biophys Res Commun. 2017;493:291–297. doi: 10.1016/j.bbrc.2017.09.028. [DOI] [PMC free article] [PubMed] [Google Scholar]
- 8.Wei J, Wu H, Zhang H, Li F, Chen S, Hou B, et al. Anthocyanins inhibit high glucose-induced renal tubular cell apoptosis caused by oxidative stress in db/db mice. Int J Mol Med. 2018;41:1608–1618. doi: 10.3892/ijmm.2018.3378. [DOI] [PMC free article] [PubMed] [Google Scholar]
- 9.Su CJ, Feng Y, Liu TT, Liu X, Bao JJ, Shi AM, et al. Thioredoxin-interacting protein induced alpha-synuclein accumulation via inhibition of autophagic flux: Implications for Parkinson’s disease. CNS Neurosci Ther. 2017;23:717–723. doi: 10.1111/cns.12721. [DOI] [PMC free article] [PubMed] [Google Scholar]
- 10.Macdonald R, Barnes K, Hastings C, Mortiboys H. Mitochondrial abnormalities in Parkinson’s disease and Alzheimer’s disease: can mitochondria be targeted therapeutically? Biochem Soc Trans. 2018;46:891–909. doi: 10.1042/BST20170501. [DOI] [PubMed] [Google Scholar]
- 11.Weil R, Laplantine E, Curic S, Genin P. Role of optineurin in the mitochondrial dysfunction: potential implications in neurodegenerative diseases and cancer. Front Immunol. 2018;9:1243. doi: 10.3389/fimmu.2018.01243. [DOI] [PMC free article] [PubMed] [Google Scholar]
- 12.Fivenson EM, Lautrup S, Sun N, Scheibye-Knudsen M, Stevnsner T, Nilsen H, et al. Mitophagy in neurodegeneration and aging. Neurochem Int. 2017;109:202–209. doi: 10.1016/j.neuint.2017.02.007. [DOI] [PMC free article] [PubMed] [Google Scholar]
- 13.Yuan Y, Zhang X, Zheng Y, Chen Z. Regulation of mitophagy in ischemic brain injury. Neurosci Bull. 2015;31:395–406. doi: 10.1007/s12264-015-1544-6. [DOI] [PMC free article] [PubMed] [Google Scholar]
- 14.Ordureau A, Paulo JA, Zhang W, Ahfeldt T, Zhang J, Cohn EF, et al. Dynamics of PARKIN-dependent mitochondrial ubiquitylation in induced neurons and model systems revealed by digital snapshot proteomics. Mol Cell. 2018;70(211–227):e218. doi: 10.1016/j.molcel.2018.03.012. [DOI] [PMC free article] [PubMed] [Google Scholar]
- 15.Yamada T, Murata D, Adachi Y, Itoh K, Kameoka S, Igarashi A, et al. Mitochondrial stasis reveals p62-mediated ubiquitination in Parkin-independent mitophagy and mitigates nonalcoholic fatty liver disease. Cell Metab. 2018;28(588–604):e5. doi: 10.1016/j.cmet.2018.06.014. [DOI] [PMC free article] [PubMed] [Google Scholar]
- 16.Burte F, Carelli V, Chinnery PF, Yu-Wai-Man P. Disturbed mitochondrial dynamics and neurodegenerative disorders. Nat Rev Neurol. 2015;11:11–24. doi: 10.1038/nrneurol.2014.228. [DOI] [PubMed] [Google Scholar]
- 17.Piano I, Novelli E, Della Santina L, Strettoi E, Cervetto L, Gargini C. Involvement of autophagic pathway in the progression of retinal degeneration in a mouse model of diabetes. Front Cell Neurosci. 2016;10:42. doi: 10.3389/fncel.2016.00042. [DOI] [PMC free article] [PubMed] [Google Scholar]
- 18.Kitada T, Asakawa S, Hattori N, Matsumine H, Yamamura Y, Minoshima S, et al. Mutations in the parkin gene cause autosomal recessive juvenile parkinsonism. Nature. 1998;392:605–608. doi: 10.1038/33416. [DOI] [PubMed] [Google Scholar]
- 19.Valente EM, Abou-Sleiman PM, Caputo V, Muqit MM, Harvey K, Gispert S, et al. Hereditary early-onset Parkinson’s disease caused by mutations in PINK1. Science. 2004;304:1158–1160. doi: 10.1126/science.1096284. [DOI] [PubMed] [Google Scholar]
- 20.Kumar A, Mittal R. Mapping Txnip: Key connexions in progression of diabetic nephropathy. Pharmacol Rep. 2018;70:614–622. doi: 10.1016/j.pharep.2017.12.008. [DOI] [PubMed] [Google Scholar]
- 21.Andrews ZB, Horvath B, Barnstable CJ, Elsworth J, Yang L, Beal MF, et al. Uncoupling protein-2 is critical for nigral dopamine cell survival in a mouse model of Parkinson’s disease. J Neurosci. 2005;25:184–191. doi: 10.1523/JNEUROSCI.4269-04.2005. [DOI] [PMC free article] [PubMed] [Google Scholar]
- 22.Lu M, Su C, Qiao C, Bian Y, Ding J, Hu G. Metformin prevents dopaminergic neuron death in MPTP/P-induced mouse model of Parkinson’s disease via autophagy and mitochondrial ROS clearance. Int J Neuropsychopharmacol 2016, 19. 10.1093/ijnp/pyw047 [DOI] [PMC free article] [PubMed]
- 23.Youn CK, Kim HB, Wu TT, Park S, Cho SI, Lee JH. 53BP1 contributes to regulation of autophagic clearance of mitochondria. Sci Rep. 2017;7:45290. doi: 10.1038/srep45290. [DOI] [PMC free article] [PubMed] [Google Scholar]
- 24.Suen DF, Narendra DP, Tanaka A, Manfredi G, Youle RJ. Parkin overexpression selects against a deleterious mtDNA mutation in heteroplasmic cybrid cells. Proc Natl Acad Sci U S A. 2010;107:11835–11840. doi: 10.1073/pnas.0914569107. [DOI] [PMC free article] [PubMed] [Google Scholar]
- 25.Kwon KJ, Lee EJ, Kim MK, Kim SY, Kim JN, Kim JO, et al. Diabetes augments cognitive dysfunction in chronic cerebral hypoperfusion by increasing neuronal cell death: implication of cilostazol for diabetes mellitus-induced dementia. Neurobiol Dis. 2015;73:12–23. doi: 10.1016/j.nbd.2014.08.034. [DOI] [PubMed] [Google Scholar]
- 26.Pagano G, Polychronis S, Wilson H, Giordano B, Ferrara N, Niccolini F, et al. Diabetes mellitus and Parkinson disease. Neurology. 2018;90:e1654–e1662. doi: 10.1212/WNL.0000000000005475. [DOI] [PubMed] [Google Scholar]
- 27.Yue X, Li H, Yan H, Zhang P, Chang L, Li T. Risk of Parkinson disease in diabetes mellitus: an updated meta-analysis of population-based cohort studies. Medicine (Baltimore) 2016;95:e3549. doi: 10.1097/MD.0000000000003549. [DOI] [PMC free article] [PubMed] [Google Scholar]
- 28.Burbulla LF, Song P, Mazzulli JR, Zampese E, Wong YC, Jeon S, et al. Dopamine oxidation mediates mitochondrial and lysosomal dysfunction in Parkinson’s disease. Science. 2017;357:1255–1261. doi: 10.1126/science.aam9080. [DOI] [PMC free article] [PubMed] [Google Scholar]
- 29.Chitnis T, Weiner HL. CNS inflammation and neurodegeneration. J Clin Invest. 2017;127:3577–3587. doi: 10.1172/JCI90609. [DOI] [PMC free article] [PubMed] [Google Scholar]
- 30.Shimobayashi M, Albert V, Woelnerhanssen B, Frei IC, Weissenberger D, Meyer-Gerspach AC, et al. Insulin resistance causes inflammation in adipose tissue. J Clin Invest. 2018;128:1538–1550. doi: 10.1172/JCI96139. [DOI] [PMC free article] [PubMed] [Google Scholar]
- 31.Yuan H, Zheng JC, Liu P, Zhang SF, Xu JY, Bai LM. Pathogenesis of Parkinson’s disease: oxidative stress, environmental impact factors and inflammatory processes. Neurosci Bull. 2007;23:125–130. doi: 10.1007/s12264-007-0018-x. [DOI] [PMC free article] [PubMed] [Google Scholar]
- 32.Namazi Sarvestani N, Saberi Firouzi S, Falak R, Karimi MY, Davoodzadeh Gholami M, Rangbar A, et al. Phosphodiesterase 4 and 7 inhibitors produce protective effects against high glucose-induced neurotoxicity in PC12 cells via modulation of the oxidative stress, apoptosis and inflammation pathways. Metab Brain Dis. 2018;33:1293–1306. doi: 10.1007/s11011-018-0241-3. [DOI] [PubMed] [Google Scholar]
- 33.Aminzadeh A. Protective effect of tropisetron on high glucose induced apoptosis and oxidative stress in PC12 cells: roles of JNK, P38 MAPKs, and mitochondria pathway. Metab Brain Dis. 2017;32:819–826. doi: 10.1007/s11011-017-9976-5. [DOI] [PubMed] [Google Scholar]
- 34.Chen M, Zheng H, Wei T, Wang D, Xia H, Zhao L, et al. High glucose-induced PC12 cell death by increasing glutamate production and decreasing methyl group metabolism. Biomed Res Int. 2016;2016:4125731. doi: 10.1155/2016/4125731. [DOI] [PMC free article] [PubMed] [Google Scholar]
- 35.Wang L, Zhai YQ, Xu LL, Qiao C, Sun XL, Ding JH, et al. Metabolic inflammation exacerbates dopaminergic neuronal degeneration in response to acute MPTP challenge in type 2 diabetes mice. Exp Neurol. 2014;251:22–29. doi: 10.1016/j.expneurol.2013.11.001. [DOI] [PubMed] [Google Scholar]
- 36.Nishikawa T, Araki E. Impact of mitochondrial ROS production in the pathogenesis of diabetes mellitus and its complications. Antioxid Redox Signal. 2007;9:343–353. doi: 10.1089/ars.2006.1458. [DOI] [PubMed] [Google Scholar]
- 37.Wei W, Liu Q, Tan Y, Liu L, Li X, Cai L. Oxidative stress, diabetes, and diabetic complications. Hemoglobin. 2009;33:370–377. doi: 10.3109/03630260903212175. [DOI] [PubMed] [Google Scholar]
- 38.Alhawiti NM, Al Mahri S, Aziz MA, Malik SS, Mohammad S. TXNIP in metabolic regulation: physiological role and therapeutic outlook. Curr Drug Targets. 2017;18:1095–1103. doi: 10.2174/1389450118666170130145514. [DOI] [PMC free article] [PubMed] [Google Scholar]
- 39.Lu L, Lu Q, Chen W, Li J, Li C, Zheng Z. Vitamin D3 protects against diabetic retinopathy by inhibiting high-glucose-induced activation of the ROS/TXNIP/NLRP3 inflammasome pathway. J Diabetes Res. 2018;2018:8193523. doi: 10.1155/2018/8193523. [DOI] [PMC free article] [PubMed] [Google Scholar]
- 40.Mishra M, Kowluru RA. DNA methylation-a potential source of mitochondria DNA base mismatch in the development of diabetic retinopathy. Mol Neurobiol. 2019;56:88–101. doi: 10.1007/s12035-018-1086-9. [DOI] [PubMed] [Google Scholar]
- 41.Wang S, Zhao Z, Fan Y, Zhang M, Feng X, Lin J, et al. Mst1 inhibits Sirt3 expression and contributes to diabetic cardiomyopathy through inhibiting Parkin-dependent mitophagy. Biochim Biophys Acta. 2019;1865:1905–1914. doi: 10.1016/j.bbadis.2018.04.009. [DOI] [PubMed] [Google Scholar]
- 42.Park JS, Davis RL, Sue CM. Mitochondrial dysfunction in Parkinson’s disease: new mechanistic insights and therapeutic perspectives. Curr Neurol Neurosci Rep. 2018;18:21. doi: 10.1007/s11910-018-0829-3. [DOI] [PMC free article] [PubMed] [Google Scholar]
- 43.He L, Chen L, Li L. The TBK1-OPTN axis mediates crosstalk between mitophagy and the innate immune response: a potential therapeutic target for neurodegenerative diseases. Neurosci Bull. 2017;33:354–356. doi: 10.1007/s12264-017-0116-3. [DOI] [PMC free article] [PubMed] [Google Scholar]
- 44.Wei H, Liu L, Chen Q. Selective removal of mitochondria via mitophagy: distinct pathways for different mitochondrial stresses. Biochim Biophys Acta. 2015;1853:2784–2790. doi: 10.1016/j.bbamcr.2015.03.013. [DOI] [PubMed] [Google Scholar]
- 45.Greene AW, Grenier K, Aguileta MA, Muise S, Farazifard R, Haque ME, et al. Mitochondrial processing peptidase regulates PINK1 processing, import and Parkin recruitment. EMBO Rep. 2012;13:378–385. doi: 10.1038/embor.2012.14. [DOI] [PMC free article] [PubMed] [Google Scholar]
- 46.Lin W, Kang UJ. Characterization of PINK1 processing, stability, and subcellular localization. J Neurochem. 2008;106:464–474. doi: 10.1111/j.1471-4159.2008.05398.x. [DOI] [PMC free article] [PubMed] [Google Scholar]
- 47.Gladkova C, Maslen SL, Skehel JM, Komander D. Mechanism of parkin activation by PINK1. Nature. 2018;559:410–414. doi: 10.1038/s41586-018-0224-x. [DOI] [PMC free article] [PubMed] [Google Scholar]
- 48.Oh CK, Sultan A, Platzer J, Dolatabadi N, Soldner F, McClatchy DB, et al. S-Nitrosylation of PINK1 attenuates PINK1/Parkin-dependent mitophagy in hiPSC-based Parkinson’s disease models. Cell Rep. 2017;21:2171–2182. doi: 10.1016/j.celrep.2017.10.068. [DOI] [PMC free article] [PubMed] [Google Scholar]
- 49.Narendra DP, Jin SM, Tanaka A, Suen DF, Gautier CA, Shen J, et al. PINK1 is selectively stabilized on impaired mitochondria to activate Parkin. PLoS Biol. 2010;8:e1000298. doi: 10.1371/journal.pbio.1000298. [DOI] [PMC free article] [PubMed] [Google Scholar]
- 50.Singh LP. Thioredoxin interacting protein (TXNIP) and pathogenesis of diabetic retinopathy. J Clin Exp Ophthalmol 2013, 4. 10.4172/2155-9570.1000287 [DOI] [PMC free article] [PubMed]
- 51.Lee S, Kim SM, Lee RT. Thioredoxin and thioredoxin target proteins: from molecular mechanisms to functional significance. Antioxid Redox Signal. 2013;18:1165–1207. doi: 10.1089/ars.2011.4322. [DOI] [PMC free article] [PubMed] [Google Scholar]
- 52.Huang C, Zhang Y, Kelly DJ, Tan CY, Gill A, Cheng D, et al. Thioredoxin interacting protein (TXNIP) regulates tubular autophagy and mitophagy in diabetic nephropathy through the mTOR signaling pathway. Sci Rep. 2016;6:29196. doi: 10.1038/srep29196. [DOI] [PMC free article] [PubMed] [Google Scholar]
- 53.Xiao B, Goh JY, Xiao L, Xian H, Lim KL, Liou YC. Reactive oxygen species trigger Parkin/PINK1 pathway-dependent mitophagy by inducing mitochondrial recruitment of Parkin. J Biol Chem. 2017;292:16697–16708. doi: 10.1074/jbc.M117.787739. [DOI] [PMC free article] [PubMed] [Google Scholar]


