

Abstract
Genetic diversity is the foundation for any breeding program. The present study analyzed the genetic base of 163 soybean genotypes from three continents viz. Africa, America and Asia using 68 trait-linked simple sequence repeats (SSR) markers. The average number of alleles among the germplasm from the three continents followed the trend as Asia (9) > America (8) > Africa (7). Similar trends were observed for gene diversity (0.76 > 0.74 > 0.71) and polymorphism information content (PIC) (0.73 > 0.71 > 0.68). These findings revealed that soybean germplasm from Asia has wider genetic base followed by America, and least in Africa. The 163 genotypes were grouped into 4 clusters by phylogenetic analysis, whereas model-based population structure analysis also divided them into 4 subpopulations comprising 80.61% pure lines and 19.39% admixtures. The genotypes from Africa were easily distinguished from those of other two continents using phylogenetic analysis, indicating important role of geographyical differentiation for this genetic variability. Our results indicated that soybean germplasm has moved from Asia to America, and from America to Africa. Analysis of molecular variance (AMOVA) showed 8.41% variation among the four subpopulations, whereas 63.12% and 28.47% variation existed among and within individuals in the four subpopulations, respectively. Based on the association mapping, a total of 21 SSR markers showed significant association with days to flowering (DoF) and 100-seed weight (HSW). Two markers Satt365 and Satt581 on chromosome 6 and 10, respectively, showed pleiotropic effect or linkage on both traits. Genotype A50 (Gakuran Daizu/PI 506679) from Japan has 8 out of the 13 beneficial alleles for increased HSW. The diverse genotypes, polymorphic SSR markers and desirable alleles identified for DoF and HSW will be used in future breeding programs to improve reproductive, yield and quality traits.
Electronic supplementary material
The online version of this article (10.1007/s13205-020-02186-5) contains supplementary material, which is available to authorized users.
Keywords: Cluster, Desirable alleles, Polymorphism information content, Principal coordinate analysis, Simple sequence repeats
Introduction
Soybean (Glycine max [L.] Merr.) is one of the most economically important crops being rich in edible oil and protein. It was domesticated from its wild progenitor (Glycine soja Siebold & Zucc.) between 3000 and 9000 years ago in East Asia (Carter et al. 2004; Lee et al. 2011). Besides its nutritional importance, it has ability to fix atmospheric nitrogen through its symbiotic association with soil microbes to improve soil fertility (Chung and Singh 2008). It is also used as a source of biofuel (Cook et al. 2012). It has the potential in helping the world achieves Sustainable Development Goals (SDGs) 1, 5, 6, 8 and 9 (Griggs et al. 2013). By keeping the climate change and population growth into consideration, development of improved crop varieties is one of the options to overcome these challenges (Wilson 2015). However, for the continuous development of improved crop varieties, abundant availability of genetic diversity in the particular crop for the trait of interest is prerequisite (Salgotra et al. 2015).
In this regard, availability of low genetic diversity in cultivated gene pool has greatly hindered the soybean improvement (Hyten et al. 2006; Kofsky et al. 2018; Lam et al. 2010; Li et al. 2013). Therefore, it is immediate to assess the genetic diversity of available soybean germplasm for achieving the sustainable improvement in soybean yield and quality through various breeding efforts (Swamy and Reddy 2004; Wang et al. 2006). Many earlier studies have assessed the genetic diversity among soybean accessions from mostly within countries or continent (Abe et al. 2003; Bisen et al. 2015; Bruce et al. 2019; Chauhan et al. 2017; Guan et al. 2010; Hirota et al. 2012; Hua et al. 2005; Kumawat et al. 2015; Shi et al. 2010; Tantasawat et al. 2011; Yamanaka et al. 2007). Recently, soybean germplasm from Africa have been reported to possess narrow genetic base (Denwar et al. 2019). However, less is known at the molecular level for genetic relationship of African soybean germplasm and other continents (Chigeza et al. 2019). In this context, among the various molecular markers, simple sequence repeats (SSR) markers have become a marker of choice owing to their high reproducibility, simplicity, easy scoring ability, reliability, co-dominant and multi-allelic nature (Salgotra et al. 2015). These markers have been used for genetic diversity analysis, genotypic identification and population structure estimation in several genetic studies (Chauhan et al. 2017; Salgotra et al. 2015; Singh et al. 2016; Upadhyay et al. 2012). However, the global diversity conception obtained in previous studies are sometimes not practical for breeders due to deficiency of detail genotype information of target traits, a crucial requisite for the breeding program genome (Salgotra et al. 2015). For suitable selection of suitable diverse parental lines, it is pertinent to study and compare the pattern of genetic diversity using random vis-à-vis trait-linked simple sequence repeats (SSR) markers, which would confirm their suitability to assess genetic diversity. Understanding the genetic diversity and structure populations would be vital to association mapping and molecular breeding program.
Soybean is highly sensitive to photoperiodism, for example soybean genotypes from Africa are sensitive to daylight and temperature (Sinclair et al. 2014). Hence, understanding photoperiodic response is important for determining the growth, development and yield in soybean, as shifting seasonal timing of reproduction became a key goal of plant breeding programs in an effort to develop new varieties that are better adapted to local environments and variable climate conditions (Miladinovi et al. 2018). Three major flowering/maturity loci E1 (Xia et al. 2012), E2 (Watanabe et al. 2011) and E3 (Watanabe et al. 2009) together with the E4 locus account for 62–66% of the variability in flowering timing in soybean (Tsubokura et al. 2014). Hence, by mining the beneficial alleles, underlying these genomic regions will be of great importance in developing soybean genotypes that have wider adaptation as well as produce increased yield in diverse environments (Chaudhary et al. 2019).
Until recently, most of the QTL studies utilized SSR markers compare to other biomarkers (Chen et al. 2007; Csanadi et al. 2001; Panthee et al. 2005). The availability of a number of SSR markers around the QTL region make them good candidates for MAS in soybean improvement program (Concibido et al. 2003). Therefore, present study assessed the genetic diversity and population structure of 163 germplasm assembled from different continents viz. Africa, America, and Asia using trait-linked SSR markers linked to seed-related traits QTLs and major flowering/maturity loci. In addition, we identified the previously reported trait-linked SSR markers for flowering (DoF) and 100-seed weight (HSW) for their future use in MAS in soybean improvement program. The beneficial alleles underlying the significant loci were also mined for future breeding programs that aim at improving seed weight and reproductive traits.
Materials and methods
Plant material and experimental design
In the present study, 160 soybean genotypes assembled from three different continents viz. Africa, America, and Asia were used (Supplementary Table 1). Out of these, 116 soybean accessions were obtained from the National Center for soybean improvement, Nanjing Agricultural University, Nanjing, China, comprising 6, 53, and 57 genotypes from Africa, America, and Asia, respectively. In addition, 6 released varieties in Ghana and 41 accessions from International Institute of Tropical Agriculture (IITA) in Nigeria, Ibadan were obtained from Council for Scientific and Industrial Research-Savanna Agricultural Research Institute (CSIR-SARI), Ghana-Tamale. IITA is the major gene bank for soybean germplasm in Africa (Chigeza et al. 2019; Miranda et al. 2019; Tefera et al. 2010).
Each soybean genotype was planted in a 1 × 0.5 m single-line plot arranged in randomized complete block design (RCBD) with three replications. Planting was done on July 1, 2018 and July 19, 2019 at Jiangpu Experimental Station of Nanjing Agricultural University, Nanjing, Jiangsu Province (latitude 33° 03′ N; longitude 118° 63′ E). All recommended agronomic and cultural practices needed for normal soybean growth were followed (Lihua 1982; Liu et al. 2008).
Genomic DNA isolation and quantification
Fresh and young leaf sample collected from each soybean genotype was used to isolate genomic DNA by following manufacturer’s protocol from DNA quick plant system (TIANGEN) of Biotech (Beijing) Co. Ltd. The DNA quality and concentration was assessed using NanoDrop 2000 Spectrophotometer (Thermo Scientific, Wilmington, DC, USA). Working stocks of 50 ng µl−1 of the genomic DNA was prepared and used in PCR amplification.
Phenotypic evaluation and analysis
The phenotypic traits viz. days to 50% flowering (DoF) and 100-seed weight (HSW) were recorded following recommended procedures. Briefly, the DoF was recorded on each plot at the R1 stage (days from emergence to first open flower in 50% of the plants) (Fehr et al. 1971), and HSW was recorded by randomly selected seeds in three technical replications in each block using electronic balance. Data collected were subjected to analysis of variance (ANOVA) using General Linear Model (GLM) in SAS (SAS Institute, 2010.SAS/STAT software version 9.2. SAS Institute Inc. Cary, NC, USA). Descriptive statistics and correlation analysis were computed using SAS program.
PCR assay
A total of 68 SSR markers consisting of 60 and 8 trait-linked markers associated with QTLs for seed-related traits and flowering/maturity loci (E1, E2 and E3), respectively, were used in this study (Supplementary Table 2). We selected at least 3 markers from each of the 20 chromosomes in soybean genome, and the information of these markers were obtained from SoyBase website (https://www.soybase.org) (Song et al. 2004). The primers (both forward and reverse) were synthesized by GenScript Biotech Corp (https://www.genscript.com). PCR reactions were performed in 10 µl reactions containing 2 µl of genomic DNA (50 ng µl−1), 1 µl of each primer and 6 µl 2 × Taq Master Mix for PAGE (Dye+) (SinoMol, China). The conditions for PCR amplification were as follows: initial denaturation at 94 °C for 5 min followed by 35 cycles of 94 °C for 30 s and annealing temperature of 56 °C for 30 s and 72 °C for 40 s with the final extension step at 72 °C for 10 min. The amplified products were separated on 8% non-denaturing polyacrylamide gel (PAGE), and were stained using silver staining. A 50-bp DNA ladder obtained from TIANGEN of Biotech (Beijing) Co. Ltd (Catalog no.MD108) was used as a scale to measure the size of each band manually under UV light. The band size of each marker in each germplasm was recorded and used for subsequent analyses.
SSR marker analysis
Various parameters related to marker polymorphism viz. major allele frequency (MAF), number of alleles, gene diversity and polymorphism information content (PIC) were calculated using PowerMarker software V3.25 (Liu and Muse 2005). Also, marker index (MI) and resolving power (RP) were calculated following the procedures as described in previous studies (Powell et al. 1996; Prevost and Wilkinson 1999). The neighbor-joining (NJ) tree for phylogenetic analysis was constructed by following the procedure as described by Nei (1972), with a bootstrap value of 1000 in PowerMarker and visualized in Molecular Evolutionary Genetics Analysis (MEGA) software version 6 (Tamura et al. 2013). Heatmap for number of alleles detected at each locus across the three continents was drawn using Heml tool version 1.0.3.7 (Deng et al. 2014).
Population structure, molecular analysis of variance and principal coordinate analysis
Population structure of soybean germplasm was analyzed using Structure software 2.3.3 (Pritchard et al. 2000). The number of presumed populations (K) was set from 2 to 8, and the analysis was repeated 5 times. We used burn-in period of 50,000 steps and Monte Carlo Marko Chain (MCMC) of 100,000, and a model with admixture and correlated allele frequency (Falush et al. 2003). The “Structure Harvester” program was used to retrieve the plateau of ΔK (Earl and Vonholdt 2012). Within a group, genotypes with affiliation probabilities (inferred ancestry) ≥ 0.80 were assigned to a particular sub-population/group, and those with < 0.80 were categorized as admixture.
Analysis of molecular variance (AMOVA) and principal coordinate analysis (PCoA) were carried out using Genetic Analysis in Excel (GenAIEx) software version 6.5 (Peakall and Smouse 2012). GenAIEx software was also used to estimate allelic patterns among the four subpopulations. The fixation index (Fst) among the subpopulations was computed using Arlequin version 3.5 at significance level of P = 0.05 and 1000 number of permutations (Excoffier and Lischer 2010). Linkage disequilibrium (LD) among the subpopulations were analyzed in Tassel 2.1 with 100,000 permutations (Bradbury et al. 2007).
Association mapping and beneficial allele mining
Association mapping was conducted using the standalone version of TASSEL 3.0.70 software (Bradbury et al. 2007), and mixed linear model (MLM) was used to analyze association between phenotypic data obtained from each year and SSR markers. The model also included kinship matrix (K) and population structure (Q) to avoid likelihood of spurious associations (Bradbury et al. 2007; Pritchard et al. 2000; Yu et al. 2006). The significant level of marker association was set at P = 0.05. The genetic positions of SSR markers that showed significant association with trait of interest were retrieved from soybean genome (Williams 82.a1.v.1.1) available on SoyBase (https://www.soybase.org). The SSR markers found to be associated with DoF and HSW traits in the present study were compared with previously reported trait-linked SSR markers available at SoyBase (https://www.soybase.org). All the SSR markers that were found significantly associated with the above-studied traits were used for mining the beneficial alleles.
Results
Phenotypic analysis of flowering time and seed weight for understanding diversity of soybean germplasm
Descriptive statistics viz. mean, standard error of mean, range, kurtosis and skewness as well as correlation coefficient for DoF and HSW of the soybean germplasm are presented in Table 1. DoF for Africa, America and Asia soybean germplasm were 63.70 ± 1.59, 35.59 ± 1.28 and 52.53 ± 1.66 days, respectively, which differed significantly from each other across the 2 years. However, there was no significant difference in HSW among the soybean germplasm from the three different continents (Table 1). There was significant negative correlation (P < 0.05) between DoF and HSW in case of Africa soybean germplasm but non-significant for America and Asia germplasm (Table 1). Our results revealed considerable difference for DoF and HSW among the soybean genotypes from Africa, America and Asia.
Table 1.
Descriptive statistics of DoF (days) and HSW (g) in the soybean populations across the 2 years
| Continent | na | DoF (days) | HSW (g) | r2c | ||
|---|---|---|---|---|---|---|
| Mean ± SEMb | Range | Mean ± SEMb | Range | |||
| Africa | 53 | 63.70 ± 1.59a | 33–79 | 10.56 ± 0.57a | 5.37–19.44 | − 0.43* |
| America | 53 | 35.59 ± 1.28c | 26.67–55.67 | 14.24 ± 0.35a | 8.86–18.57 | − 0.27 (ns) |
| Asia | 57 | 52.53 ± 1.66b | 28–75 | 13.01 ± 0.95a | 3.72–41.11 | − 0.18 (ns) |
aSample size
bMean ± standard error of mean and separated by Duncan’s multiple range test
cCorrelation coefficient between DoF and HSW with * indicate significant while ns mean otherwise. Mean ± SEM with the same alphabetic indicate no significant difference
SSR polymorphism and genetic diversity among the assembled germplasm
In total, we detected 942 alleles for all 68 SSR markers among the 163 genotypes with an average number of 14 alleles/loci (Supplementary Table 3). Most of the SSR markers used in the present study showed more number of alleles/loci in Asian germplasm followed by American and African (Fig. 1, Supplementary Fig. 2). Furthermore, the number of average alleles/loci were highest in Asian germplasm (9) followed by American (8), and least in African germplasm of 7 alleles/loci (Fig. 1). In addition, average gene diversity and PIC values also followed the same trend, thus, Asian > America > Africa (Fig. 1). The MI and RP of 68 markers ranged from 0.57 to 26.36 and 1.77- to 2.00, respectively (Supplementary Table 3). Hence, the above results indicate that Asian germplasm is more diverse followed by American, and considerable low diversity is available in African soybean germplasm. In addition, the PIC, MI and RP revealed that markers used in this study were highly polymorphic to explore the genetic relationship among the soybean germplasm from the three different continents (Supplementary Table 3).
Fig. 1.
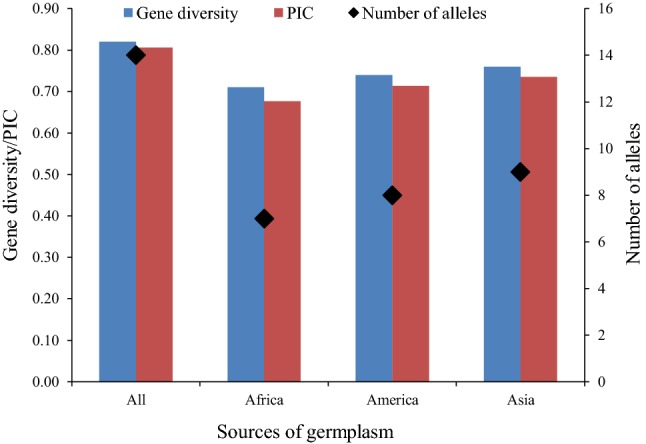
Summary of number of alleles, gene diversity and polymorphism information content (PIC) among the 163 germplasm. All in the X-axis represent the whole of 163 germplasm used in this study, whereas Africa, America and Asia represent 53, 53 and 57 germplasm assembled from each continent, respectively
Phylogenetic relationship among the 163 genotypes
NJ phylogenetic tree among the 163 soybean genotypes was constructed using the marker data of 68 trait-linked SSR markers with Nei’s genetic distances. Based on the phylogenetic analysis, 4 major cluster viz. Cluster I (yellow), Cluster II (green), Cluster III (ash) and Cluster IV (purple) consisting of 14, 56, 39 and 54, respectively, were identified (Fig. 2, Supplementary Table 1). The Cluster I comprised 13 genotypes from Asia (As45–As57) and one from America (Am53), and Cluster II consisted of mostly genotypes from Africa (53) except 2 from America (Am1 and Am12) and 1 from Asia (As37). However, Cluster III composed of 39 germplasm all from America, whereas Cluster IV comprised 43 genotypes mostly from Asia except 11 genotypes from America. This result suggests that the genotypes in each cluster may be closely related by a common ancestral origin.
Fig. 2.

Neighbor-joining tree constructed by Nei (1972) genetic distance among the 163 genotypes assembled from Africa, America and Asia. Each cluster is represented by one color in the clade: yellow, green, ash and purple color represent Cluster I, II, III and IV obtained by Nei’s genetic distances and visualized in MEGA software, respectively. Germplasm marked with blue circle, red triangle and pink star represent germplasm from Africa (Af1–53), America (Am1–53) and Asia (As1–57) continent, respectively
Model-based population structure
Model-based population structure analysis was carried out using STRUCTURE software, the 163 soybean genotypes were grouped into 4 subpopulations viz. subpop1, subpop2, subpop3 and subpop4 (Fig. 3; Supplementary Fig. 3; Supplementary Table 1). The subpop1, subpop2, subpop3 and subpop4 comprised 41, 44, 39 and 39 genotypes, respectively. Out of these, small percentage of admixture genotypes, thus, 4.88%, 6.82%, 5.13% and 2.56% in that same order. The ad hoc quantity (ΔK) confirmed a higher likelihood at K = 4, indicating that the 163 soybean genotypes could be most likely grouped into 4 major subpopulations (Supplementary Fig. 3).
Fig. 3.

Model based population structure of all 163 germplasm. The four colors (red, green, blue and yellow) represent four inferred ancestral population based on membership coefficient (Q) obtained from STRUCTURE software. The red, green, blue and yellow represent subpopulation 1, 2, 3 and 4, respectively. Each accession is represented by a vertical bar. Af1–53, Am1–53 and As1–57 in each column represent accessions assembled from Africa, America and Asia continents, respectively
The grouping of genotypes through model-based clustering was in agreement with phylogenetic clustering to some extent (Figs. 2, 3; Supplementary Table 1). There was significant association between original continent and the group type (either clusters or subpopulations) (Supplementary Table 4).
Table 4.
Germplasm with desirable alleles for HSW identified by significant markers
| Trait | Marker | CChro | Highest positive a | Highest negative b | ||||
|---|---|---|---|---|---|---|---|---|
| Allele | Effect | Germplasm | Allele | Effect | Germplasm | |||
| HSW | Satt365 | 6 | 245:245 | 8.00 | As50 | 260:260 | 4.85 | As37 |
| HSW | Satt590 | 7 | 390:390 | 7.50 | As50 | 275:275 | 6.54 | As8 |
| HSW | Satt581 | 10 | 144:144 | 3.26 | As50 | 170:170 | 7.89 | As29–31 |
| HSW | Satt331 | 10 | 204:204 | 10.86 | As50 | 250:250 | 1.64 | As8 |
| HSW | Satt358 | 10 | 205:205 | 10.11 | As17 | 145:145 | 8.25 | As29–31 |
| HSW | Satt519 | 11 | 310:310 | 8.07 | As50 | 312:312 | 1.39 | As51 |
| HSW | Satt252 | 13 | 215:215 | 10.40 | As50 | 195:195 | 5.55 | As30–31 |
| HSW | Satt560 | 14 | 305:305 | 7.00 | As50 | 340:340 | 3.53 | Am48 |
| HSW | Satt186 | 17 | 197:197 | 4.67 | As50 | 255:255 | 6.99 | As30 |
| HSW | Satt372 | 17 | Nil | Nil | Nil | 300:300 | 12.17 | As29 |
| HSW | Satt564 | 18 | 220:220 | 11.60 | As28 | 130:130 | 4.02 | Af13–15 |
| HSW | Satt527 | 19 | 250:250 | 7.95 | A38 | 225:225 | 0.34 | Af40–42; As30,31,40 |
| HSW | Satt571 | 20 | 145:145 | 4.85 | As17,48 | 200:200 | 3.54 | Af42,52 |
a and b indicate alleles and their effect on each trait and germplasm with those alleles. Alleles with positive and negative effects increase and decrease phenotype, respectively
Expected heterozygosity between individuals in same subpopulation viz. subpop1, subpop2, subpop3 and subpop4 were 0.75, 0.77, 0.71, and 0.73, respectively, with mean value of alpha 0.03 (Supplementary Table 5). In addition, Fst-value was highly significant among all the subpopulations except between subpop1 and subpop4 (Supplementary Table 6).
AMOVA, PCoA and allelic patterns among the subpopulations
AMOVA was also carried out to detect the variation among the subpopulations, among and within individuals in subpopulations (Table 2; Supplementary Fig. 4). AMOVA results showed that variation among the subpopulations was 8.41%, while among and within individuals in a subpopulation accounted for 63.12% and 28.47%, respectively. The first three principal coordinates (PCs) from PCoA together accounted for 14.37% of variation (Supplementary Fig. 5; Supplementary Table 7). However, allelic patterns are in accordance with the expected heterozygosity of the four subpopulations, both revealed that subpop2 is more diverse (Supplementary Figs. 6, 7; Supplementary Table 5).
Table 2.
Summary of AMOVA table
| Source | df | SS | MS | Est. Var. | % |
|---|---|---|---|---|---|
| Among Subpops | 3 | 685.83 | 228.61 | 2.29 | 8.41 |
| Among Indiv | 159 | 6699.46 | 42.14 | 17.19 | 63.12 |
| Within Indiv | 163 | 1264 | 7.76 | 7.755 | 28.47 |
| Total | 325 | 8649.28 | 27.245 | 100.00 |
df degree of freedom, SS sum of squares, MS mean square, Est. Var. estimated variance, % percentage of variation
LD among the subpopulations
Among the four subpopulations detected through model-based population structure analysis, subpop2 had the lowest percentage of significant pairwise loci in LD (25.95%), whereas highest was found in subpop4 (40.56%) (Supplementary Table 8). The subpop4 had the highest average D′ value (0.69) among the subpopulations and, subpop2 had the lowest average D′ value (0.64), suggesting the accessions of subpop2 have been subjected to artificial selection.
Our results revealed that the genomes of four subpopulations fitted in the equation y = blnx + c, as is evident from the regression analysis between the D′ value and genetic distance of syntenic (intra-chromosome) marker pairs (Fig. 4). The minimum distance of LD decay for subpop1 to subpop4 was 62.45, 43.54, 54.34 and 47.70 cM, respectively. Hence, it revealed that subpop2 has the lowest decay rate, whereas while subpop1 had fastest decay rate among the four subpopulations.
Fig. 4.

Linkage disequilibrium (LD) among the four subpopulations obtained from the model-based population structure analysis implemented in STRUCTURE software
Association mapping and beneficial allele mining
In the present study, we identified a total of 21 SSR markers associated with DoF and HSW traits through the MLM (Q + K), these markers accounted for 5.42–27.6% phenotype variation (Supplementary Tables 9, 10). These 21 SSR markers were distributed on 13 different chromosomes viz. chr01, chr05, chr06, chr07, chr08, chr10, chr11, chr13, chr14, chr17, chr18, chr19 and chr20) (Supplementary Tables 9, 10). Out of these, 17 were earlier reported to be associated with QTLs related to seed weight/seed yield or flowering (SoyBase; https://www.soybase.org). However, only four novel SSR markers were detected for the first time in the present study to be associated with either DoF or HSW, which include three SSR markers linked to DoF viz. Sat_217, Satt474 and Satt562, and 1 marker Satt560 linked with HSW. Two SSR markers viz. Satt365 and Satt581 were found to associate with both DoF and HSW (Supplementary Tables 9, 10).
Based on the allele mining analysis, 11 genotypes from America (Am2, 4, 14, 19, 20, 29, 42, 44, 45, 47, and 52) and 3 from Asia (As12, 20 and 37) and 1 from Africa (Af33) contributed desirable alleles for early flowering, whereas genotypes viz. As7, As29, As32, Af8, Af11, Af12, Af13, Af14, Af15, Af29, Af34 and Af41 contributed alleles for late flowering (Tables 3, 4). Out of the 13 SSR markers/loci identified to be significantly associated with HSW, the beneficial alleles for higher seed weight of 8 loci were contributed by As50 soybean genotype from Japan, hence this genotype could be integrated in the soybean breeding program targeting increased seed weight and yield.
Table 3.
Germplasm with desirable alleles for DoF identified by significant markers
| Trait | Marker | Chro | Highest positivea | Highest negativeb | ||||
|---|---|---|---|---|---|---|---|---|
| Allele | Effect | Germplasm | Allele | Effect | Germplasm | |||
| DoF | Satt468 | 1 | Nil | Nil | Nil | 218:218 | 19.97 | Am4 and As12 |
| DoF | Sat_217 | 5 | 340:340 | 10.24 | As7 | 360:360 | 9.01 | Am44 |
| DoF | Satt365 | 6 | 375:375 | 31.68 | As32 | 260:260 | 6.49 | As37 |
| DoF | Satt228 | 8 | 205:205 | 24.26 | Af8,12–15 | Nil | Nil | Nil |
| DoF | Satt420 | 10 | 297:297 | 8.74 | Af34 | 260:260 | 5.83 | Am2 |
| DoF | Satt581 | 10 | 175:175 | 12.91 | As29 | 146:146 | 8.32 | Am14, 42, 45, 47 |
| DoF | Satt474 | 14 | 315:315 | 19.95 | Af41 | 220:220 | 10.11 | Am19, 29; As20 |
| DoF | Satt561 | 19 | 255:255 | 3.10 | Af29 | 270:270 | 2.61 | Am20 |
| DoF | Satt462 | 19 | 253:253 | 7.93 | Af11, 13–15 | 240:240 | 23.99 | Af33 |
| DoF | Satt562 | 20 | Nil | Nil | Nil | 120:120 | 21.54 | Am45, 52 |
a,bAlleles and their effect on each trait and germplasm with those alleles. Alleles with positive and negative effects increase and decrease phenotype, respectively
Discussion
Development of improved crop varieties with higher yield and quality requires the availability of genetic diversity within a crop species. The cultivated varieties of soybean have been developed through human selection from the available genetic diversity in various environments and human cultures. In the last two centuries, modern breeding has resulted in the development of soybean varieties that are more uniform, more stable and adapted to different environments. Moreover, modern breeding has resulted in the popularization of few soybean genotypes among farmers that in turn leads to narrow genetic base. The crop has become more vulnerable to biotic and abiotic stresses, leading to huge losses in soybean production. In this regard, the present study was used to understand the genetic diversity level/genetic base among the soybean germplasm from three important continents viz. Africa, America and Asia. Identification of diverse genotypes using molecular markers is advantageous over the conventional approach (Collard and Mackill 2007). SSR molecular markers have been widely applied in the genetic diversity analysis, genotypic identification and population structure estimation in several crop species including soybean (Belalia et al. 2019; Chauhan et al. 2017; Chen et al. 2012; Chotiyarnwong et al. 2007; Singh et al. 2016; Xiong et al. 2016; Yamanaka et al. 2007). Furthermore, most of the earlier studies based on the genetic diversity characterization of soybean germplasm include the soybean genotypes within countries or within single continent, however, limited effort has been made to understand the genetic diversity of soybean germplasm from different continents including those in Africa (Abe et al. 2003; Chauhan et al. 2017; Guan et al. 2010; Hua et al. 2005; Kumawat et al. 2015; Shi et al. 2010; Yamanaka et al. 2007). In this context, the present study screened 163 soybean genotypes assembled from 3 different continents viz. Africa, America and Asia using 68 trait-linked SSR markers (Supplementary Table 1).
In this study, we detected more number of average alleles per locus in Asian germplasm (9 alleles/loci) followed by America (8 alleles/loci) and least in Africa (7 alleles/loci), and an average number of 14 alleles/loci was detected in whole soybean germplasm (Fig. 1). Similarly, average gene diversity and PIC values of soybean germplasm from Africa, America and Asia followed the same trend as 0.71 < 0.74 < 0.76 and 0.68 < 0.71 < 0.73, respectively (Fig. 1). These results are not surprising as Asia represents the Primary Centre of genetic diversity for soybean, and it has been reported that soybean was domesticated in Asia (specifically China) from its wild relative (G. soja), and was introduced to Korea and Japan approximately 2000 years earlier, then to North America in 1765, and to Central and South America during the first half of the last century (Wilson 2008). Earlier study reported that genetic base of soybean germplasm from Asia is much larger (Chung and Singh 2008). The lower genetic diversity available in African soybean germplasm can be explained by the fact that soybean was introduced late in this continent, it was first introduced in Egypt in 1958 and then it gradually spread to different parts of Africa, and has received very less attention (Chigeza et al. 2019; Denwar et al. 2019). This shows a big gap in soybean breeding and research in Africa, and needs to be filled. Also, the higher values of gene diversity, PIC, MI and RP indicate that markers used were very informative (Supplementary Fig. 1, Supplementary Table 3). This shows the usefulness of SSR as the marker of choice for studying germplasm genetic diversity (Hao et al. 2012; Li et al. 2010).
To understand genetic relationship among the 163 soybean genotypes from 3 continents, we performed phylogenetic and model-based cluster analyses. The knowledge about the genetic relationships of crop germplasm provides important information about its further use in breeding programs as well as for germplasm resource management (Li et al. 2011; Roldán-Ruiz et al. 2001). The NJ phylogenetic analysis classified all the 163 soybean genotypes into 4 major Clusters viz. I, II, III and IV (Fig. 2). The Cluster I and IV consisted mostly of Asian soybean genotypes with few genotypes from America, for example, Cluster I and IV have 1 and 11 genotypes, respectively, from America. Similarly, Cluster II comprised of mostly African genotypes (53) plus 2 from America (Am1 and Am12) and 1 from Asia (As37), whereas Cluster III includes genotypes from America. This mixing of some genotypes from different continents into the same cluster can be explained by the fact that soybean germplasm moved from Asia to America, and from America to Africa and other parts of world; however, some soybean genotypes were also introduced from America to China (Liu et al. 2017).
Population structure analysis and PCoA also grouped the soybean germplasm into four subpopulations (Fig. 3; Supplementary Figs. 3, 5). The grouping of genotypes in model-based clustering and PCoA are in well agreement with phylogenetic analysis (Fig. 2). Similar to phylogenetic analysis, results of structure analysis and PCoA also revealed mixing of genotypes into same subpopulation from three different continents, and also confirmed same flow of soybean germplasm from Asia to America, and America to Africa and other parts of world. Each of the four subpopulations contained at least one genotype from Asia. This is not surprising as earlier authors have indicated continuous exchange of germplasm among Americas and Asian countries. Gizlice et al. (1994) analyzed the pedigrees 258 publicly developed cultivars released in US between 1947 and 1988 and found that > 84% of their parentage could be traced back to only 17 ancestors of which most were from the introduced landraces from China. On other hand, Gai et al. (2015) assessed 1300 soybean cultivars released during the period of 1923–2005 according to their pedigrees, the genetic contribution from US cultivars to Chinese was 139.83, accounting for 10.79% of the total. The 4 subpopulations/clusters identified in this study could possibly mean that the 163 genotypes may have 4 common ancestral backgrounds. The presence of statistically significant population structure was confirmed by AMOVA and Fst analyses (Table 2; Supplementary Fig. 4; Supplementary Table 6). AMOVA revealed the variation within and among individuals in subpopulations were 28.40% and 63.12%, respectively, and among the subpopulations were 8.41% (Table 2, Supplementary Fig. 4). The results obtained through model-based analysis and distance-based clustering as well as PCoA were in agreement with each other with some minor differences in genotype grouping. The genotypes from Africa can be easily distinguished from those from other two continents using NJ analysis, indicating role of geographyical differentiation of these genotypes. On the other hand, each of the four subpopulations obtained by stucture analysis contained at least two major sources of continent, showing significant germplasm exchange among the continents (Supplementary Table 4). However, based on the results of allelic patterns, mean within population pairwise values, Fst value and PCoA analysis, subpop2 are more distinct as evident from PCoA and allelic patterns (Supplementary Figs. 6, 7); therefore, genotypes from this subpopulation need to be exploited for future breeding programs.
By keeping the time required for the development of bi-parental mapping population and mapping resolution into consideration, association mapping has gained much popularity in gene mapping (Hu et al. 2014; Jun et al. 2008; Li et al. 2019; Mao et al. 2017; Rodrigues et al. 2013). In the present study, 68 trait-linked SSR markers linked to prominent QTLs and 3 major maturity loci (E1, E2 and E3) were used to conduct association mapping in 163 soybean germplasm using MLM (Q + K) approach. Out of the 68 SSR markers, 21 were found to show significant association with DoF and HSW (Supplementary Tables 9, 10). Most of significant markers detected in this study co-located with QTLs for the same traits previously reported on Soybase (https://www.soybase.org). Hence, these markers could be used for MAS targeted at either DoF /HSW or both traits. Two of these markers (Satt365 and Satt581) associated with both traits, as a result of either pleiotropic effect or linkage (Cober and Morrison 2010; Molnar et al. 2003; Watanabe et al. 2011). In addition, we further carried out mining of beneficial alleles in soybean germplasm to identify the genotypes that contributed desirable alleles for the 21 SSR markers found to be associated with either DoF or HSW. Our results revealed that 15 soybean genotypes contributed desirable alleles for early flowering, that include 11, 3 and 1 from America, Asia and Africa, respectively, whereas 9 genotypes mostly from Africa (Af8, 11, 12, 13, 14, 15, 29, 34 and 41) plus 3 genotypes from Asia (As7, As29 and As32) contributed alleles for late flowering (Tables 3, 4). Interestingly, desirable alleles for increased HSW were contributed by As50 genotype for 8 loci out of total 13 loci identified to be associated with HSW. This genotype (As50) could be introduced in the breeding program targeting increased seed weight and yield in soybean.
Conclusion
In conclusion, the present study is a detailed investigation for understanding the level of genetic base/diversity among the soybean germplasm from Africa, America and Asia. Based on the results of genetic diversity parameters viz. number of alleles/loci, gene diversity, and PIC values, the Asian germplasm were found to be more diverse followed by America, and African germplasm was identified to be least diverse. Furthermore, phylogenetic genetic, model-based population structure and PCoA analyses revealed that soybean germplasm has moved from Asia to America and from America to Africa; however, reciprocal flow of soybean genotypes from America to Asia also occurred. In addition, 21 SSR markers out of total 68 were found to significantly associate with DoF and HSW. Most of these markers had earlier been reported to link to QTLs related to either of the traits evaluated in this study. Our results also revealed that 16 soybean genotypes contributed desirable alleles for early flowering, whereas 14 genotypes contributed alleles for late flowering. Genotype As50 possessed desirable alleles/loci (8 out of the 13) for increase HSW, suggesting the need to introduce this genotype into soybean breeding program. The most divergent genotypes obtained in this study can be utilized for the future soybean breeding program, and also the highly polymorphic functional SSR markers identified can be used in further soybean research.
Electronic supplementary material
Below is the link to the electronic supplementary material.
Acknowledgements
This work was supported by the National Key R&D Program of China (2016YFD0100201), the National Natural Science Foundation of China (Grant nos. 31571691 and 31871646), the MOE Program for Changjiang Scholars and Innovative Research Team in University (PCSIRT_17R55), the Fundamental Research Funds for the Central Universities (KYT201801), the Jiangsu Collaborative Innovation Center for Modern Crop Production (JCIC-MCP) Program.
Author contributions
TZ conceived and designed the experiments. NND provided some germplasm from Africa. BK performed the experiments, analyzed data and drafted the manuscript. TZ and JAB revised the manuscript.
Compliance with ethical standards
Conflict of interest
The authors have no conflicts of interest to declare.
References
- Abe J, Xu DH, Suzuki Y, Kanazawa A, Shimamoto Y. Soybean germplasm pools in Asia revealed by nuclear SSRs. Theor Appl Genet. 2003;106(3):445–453. doi: 10.1007/s00122-002-1073-3. [DOI] [PubMed] [Google Scholar]
- Belalia N, Lupini A, Djemel A, Morsli A, Mauceri A, Lotti C, Khelifi-Slaoui M, Khelifi L, Sunseri F. Analysis of genetic diversity and population structure in Saharan maize (Zea mays L.) populations using phenotypic traits and SSR markers. Genet Res Crop Evol. 2019;66(1):243–257. doi: 10.1007/s10722-018-0709-3. [DOI] [Google Scholar]
- Bisen A, Khare D, Nair P, Tripathi N. SSR analysis of 38 genotypes of soybean (Glycine max (L.) Merr.) genetic diversity in India. Phys Mol Biol Plants. 2015;21(1):1–7. doi: 10.1007/s12298-014-0269-8. [DOI] [PMC free article] [PubMed] [Google Scholar]
- Bradbury P, Zhang Z, Kroon D, Casstevens TY, Buckler E. TASSEL: software for association mapping of complex traits in diverse samples. Bioinformatics. 2007;23(19):2633–2635. doi: 10.1093/bioinformatics/btm308. [DOI] [PubMed] [Google Scholar]
- Bruce RW, Torkamaneh D, Grainger C, Belzile F, Eskandari M, Rajcan I. Genome-wide genetic diversity is maintained through decades of soybean breeding in Canada. Theor Appl Genet. 2019 doi: 10.1007/s00122-019-03408-y. [DOI] [PubMed] [Google Scholar]
- Carter TE, Nelson RL, Sneller CH, Cui Z. Genetic diversity in soybean. In: Boerma HR, Specht JE, editors. Soybeans: improvement, production, and uses. Madison: American Society of Agronomy; 2004. pp. 303–416. [Google Scholar]
- Chaudhary J, Shivaraj S, Khatri P, Ye H, Zhou L, Klepadlo M, Dhakate P, Kumawat G, Patil G, Sonah H. Genomic designing of climate-smart oilseed crops. Berlin: Springer; 2019. Approaches, applicability, and challenges for development of climate-smart soybean; pp. 1–74. [Google Scholar]
- Chauhan DK, Bhat JA, Thakur AK, Hussain Z, Satyavathi CT. Understanding genetic relationship and population structure of Indian soybean varieties using microsatellite markers. Proc Natl Acad Sci India Sect B Biol Sci. 2017 doi: 10.1007/s40011-017-0847-y. [DOI] [Google Scholar]
- Chen Q, Zhang Z, Liu C, Xin D, Qiu H, Shan D, Shan C, Hu G. QTL analysis of major agronomic traits in soybean. Agric Sci China. 2007;6(4):399–405. doi: 10.1016/S1671-2927(07)60062-5. [DOI] [Google Scholar]
- Chen X, Min D, Yasir TA, Hu Y-G. Genetic diversity, population structure and linkage disequilibrium in elite Chinese winter wheat investigated with SSR markers. PLoS ONE. 2012;7(9):e44510. doi: 10.1371/journal.pone.0044510. [DOI] [PMC free article] [PubMed] [Google Scholar]
- Chigeza G, Boahen S, Gedil M, Agoyi E, Mushoriwa H, Denwar N, Gondwe T, Tesfaye A, Kamara A, Chikoye OEAD (2019) Public sector soybean (Glycine max) breeding: advances in cultivar development in the African tropics. Plant Breed. 10.1111/pbr.12682
- Chotiyarnwong O, Chatwachirawong P, Chanprame S, Srinives P. Evaluation of genetic diversity in Thai indigenous and recommended soybean varieties by SSR markers. Thai J Agric Sci. 2007;40(3–4):119–126. [Google Scholar]
- Chung G, Singh RJ. Broadening the genetic base of soybean: a multidisciplinary approach. Crit Rev Plant Sci. 2008;27(5):295–341. doi: 10.1080/07352680802333904. [DOI] [Google Scholar]
- Cober ER, Morrison MJ. Regulation of seed yield and agronomic characters by photoperiod sensitivity and growth habit genes in soybean. Theor Appl Genet. 2010;120(5):1005. doi: 10.1007/s00122-009-1228-6. [DOI] [PubMed] [Google Scholar]
- Collard BC, Mackill DJ. Marker-assisted selection: an approach for precision plant breeding in the twenty-first century. Philos Trans R Soc B Biol Sci. 2007;363(1491):557–572. doi: 10.1098/rstb.2007.2170. [DOI] [PMC free article] [PubMed] [Google Scholar]
- Concibido V, Vallee BL, Mclaird P, Pineda N, Meyer J, Hummel L, Yang J, Wu K, Delannay X. Introgression of a quantitative trait locus for yield from Glycine soja into commercial soybean cultivars. Theor Appl Genet. 2003;106(4):575–582. doi: 10.1007/s00122-002-1071-5. [DOI] [PubMed] [Google Scholar]
- Cook DE, Lee TG, Guo X, Melito S, Wang K, Bayless AM, Wang J, Hughes TJ, Willis DK, Clemente TE. Copy number variation of multiple genes at Rhg1 mediates nematode resistance in soybean. Science. 2012;338(6111):1206–1209. doi: 10.1126/science.1228746. [DOI] [PubMed] [Google Scholar]
- Csanadi G, Vollmann J, Stift G, Lelley T. Seed quality QTLs identified in a molecular map of early maturing soybean. Theor Appl Genet. 2001;103(6–7):912–919. doi: 10.1007/s001220100621. [DOI] [Google Scholar]
- Deng W, Wang Y, Liu Z, Cheng H, Xue Y. HemI: a toolkit for illustrating heatmaps. PLoS ONE. 2014;9(11):e111988. doi: 10.1371/journal.pone.0111988. [DOI] [PMC free article] [PubMed] [Google Scholar]
- Denwar NN, Awuku FJ, Diers B, Frimpomaah FA, Chigeza G, Oteng-Frimpong F, Puozaa DK, Barnor MT. Genetic diversity, population structure and key phenotypic traits driving variation within soyabean (Glycine max) collection in Ghana. Plant Breed. 2019;00:1–11. doi: 10.1111/pbr.12700. [DOI] [Google Scholar]
- Earl DA, Vonholdt BM. STRUCTURE HARVESTER: a website and program for visualizing STRUCTURE output and implementing the Evanno method. Cons Gen Res. 2012;4(2):359–361. doi: 10.1007/s12686-011-9548-7. [DOI] [Google Scholar]
- Excoffier L, Lischer H. Arlequin suite ver 3.5: a new series of programs to perform population genetics analyses under Linux and Windows. Mol Eco Res. 2010;10(3):564–567. doi: 10.1111/j.1755-0998.2010.02847.x. [DOI] [PubMed] [Google Scholar]
- Falush D, Matthew S, Pritchard JK. Inference of population structure using multilocus genotype data: linked loci and correlated allele frequencies. Genetics. 2003;164(4):1567–1587. doi: 10.3410/f.1015548.197423. [DOI] [PMC free article] [PubMed] [Google Scholar]
- Fehr W, Caviness C, Burmood D, Pennington J. Stage of development descriptions for soybeans, Glycine max (L.) Merrill 1. Crop Sci. 1971;11(6):929–931. doi: 10.2135/cropsci1971.0011183X001100060051x. [DOI] [Google Scholar]
- Gai JY, Xiong DJ, Zhao TJ. The pedigrees and germplasm bases of soybean cultivars released in China (1923–2005) Beijing: China Agricultural Press; 2015. [Google Scholar]
- Gizlice Z, Carter T, Jr, Burton J. Genetic base for north American public soybean cultivars released between 1947 and 1988. Crop Sci. 1994;34(5):1143–1151. doi: 10.2135/cropsci1994.0011183X003400050001x. [DOI] [Google Scholar]
- Griggs D, Staffordsmith M, Gaffney O, Rockström J, Ohman MC, Shyamsundar P, Steffen W, Glaser G, Kanie N, Noble I. Policy: sustainable development goals for people and planet. Nature. 2013;495(7441):305–307. doi: 10.1038/495305a. [DOI] [PubMed] [Google Scholar]
- Guan R, Chang R, Li Y, Wang L, Liu Z, Qiu L. Genetic diversity comparison between Chinese and Japanese soybeans (Glycine max (L.) Merr.) revealed by nuclear SSRs. Gen Res Crop Evol. 2010;57(2):229–242. doi: 10.1007/s10722-009-9465-8. [DOI] [Google Scholar]
- Hao D, Cheng H, Yin Z, Cui S, Zhang D, Wang H, Yu D. Identification of single nucleotide polymorphisms and haplotypes associated with yield and yield components in soybean (Glycine max) landraces across multiple environments. Theor Appl Genet. 2012;124(3):447–458. doi: 10.1007/s00122-011-1719-0. [DOI] [PubMed] [Google Scholar]
- Hirota T, Sayama T, Yamasaki M, Sasama H, Sugimoto T, Ishimoto M, Yoshida S. Diversity and population structure of black soybean landraces originating from Tanba and neighboring regions. Breed Sci. 2012;61(5):593. doi: 10.1270/jsbbs.61.593. [DOI] [PMC free article] [PubMed] [Google Scholar]
- Hu Z, Zhang D, Zhang G, Kan G, Hong D, Yu D. Association mapping of yield-related traits and SSR markers in wild soybean (Glycine soja Sieb. and Zucc.) Breed Sci. 2014;63(5):441. doi: 10.1270/jsbbs.63.441. [DOI] [PMC free article] [PubMed] [Google Scholar]
- Hua X, Guan R, Chang R, Qiu L. Genetic diversity of Chinese summer soybean germplasm revealed by SSR markers. Chin Sci Bull. 2005;50(6):526–535. doi: 10.1007/BF02897476. [DOI] [Google Scholar]
- Hyten DL, Song Q, Zhu Y, Choi I-Y, Nelson RL, Costa JM, Specht JE, Shoemaker RC, Cregan PB. Impacts of genetic bottlenecks on soybean genome diversity. Proc Nat Acad Sci. 2006;103(45):16666–16671. doi: 10.1073/pnas.0604379103. [DOI] [PMC free article] [PubMed] [Google Scholar]
- Jun T, Kyujung V, Moonyoung K, Sukha L, Davidr W. Association analysis using SSR markers to find QTL for seed protein content in soybean. Euphytica. 2008;162(2):179–191. doi: 10.1007/s10681-007-9491-6. [DOI] [Google Scholar]
- Kofsky J, Zhang H, Song BH. The untapped genetic reservoir: the past, current, and future applications of the wild soybean (Glycine soja) Front Plant Sci. 2018;9:949. doi: 10.3389/fpls.2018.00949. [DOI] [PMC free article] [PubMed] [Google Scholar]
- Kumawat G, Singh G, Gireesh C, Shivakumar M, Arya M, Agarwal DK, Husain SM. Molecular characterization and genetic diversity analysis of soybean (Glycine max (L.) Merr.) germplasm accessions in India. Phy Mol Biol Plants. 2015;21(1):101–107. doi: 10.1007/s12298-014-0266-y. [DOI] [PMC free article] [PubMed] [Google Scholar]
- Lam H-M, Xu X, Liu X, Chen W, Yang G, Wong F-L, Li M-W, He W, Qin N, Wang B. Resequencing of 31 wild and cultivated soybean genomes identifies patterns of genetic diversity and selection. Nat Genet. 2010;42(12):1053. doi: 10.1038/ng.715. [DOI] [PubMed] [Google Scholar]
- Lee G-A, Crawford GW, Li L, Yuka S, Xuexiang C. Archaeological soybean (Glycine max) in East Asia: does size matter? PLoS ONE. 2011;6(11):e26720. doi: 10.1371/journal.pone.0026720. [DOI] [PMC free article] [PubMed] [Google Scholar]
- Li YH, Wei ZC, Yang L, Chang RZ, Gaut BS, Qiu LJ. Genetic diversity in domesticated soybean (Glycine max) and its wild progenitor (Glycine soja) for simple sequence repeat and single-nucleotide polymorphism loci. New Phytol. 2010;188(1):242–253. doi: 10.1111/j.1469-8137.2010.03344.x. [DOI] [PubMed] [Google Scholar]
- Li G, Ra WH, Park JW, Kwon SW, Lee JH, Park CB, Park YJ. Developing EST-SSR markers to study molecular diversity in Liriope and Ophiopogon. Bioch Syst Eco. 2011;39(4–6):241–252. doi: 10.1016/j.bse.2011.08.012. [DOI] [Google Scholar]
- Li Y-H, Shan-Cen Z, Jian-Xin M, Dong L, Long Y, Jun L, Xiao-Tian Q, Xiao-Sen G, Le Z, Wei-Ming H. Molecular footprints of domestication and improvement in soybean revealed by whole genome re-sequencing. BMC Genom. 2013;14(1):579. doi: 10.1186/1471-2164-14-579. [DOI] [PMC free article] [PubMed] [Google Scholar]
- Li J, Zhao J, Li Y, Gao Y, Hua S, Nadeem M, Sun G, Zhang W, Hou J, Wang X. Identification of a novel seed size associated locus SW9-1 in soybean. Crop J. 2019 doi: 10.1016/j.cj.2018.12.010. [DOI] [Google Scholar]
- Lihua CYD. The Principle of high-yielding soybean and its culture technique. Acta Agronom Sin. 1982;1:006. [Google Scholar]
- Liu K, Muse SV. PowerMarker: an integrated analysis environment for genetic marker analysis. Bioinformatics. 2005;21(9):2128–2129. doi: 10.1093/bioinformatics/bti282. [DOI] [PubMed] [Google Scholar]
- Liu X, Jin J, Wang G, Herbert S. Soybean yield physiology and development of high-yielding practices in Northeast China. Field Crops Res. 2008;105(3):157–171. doi: 10.1016/j.fcr.2007.09.003. [DOI] [Google Scholar]
- Liu Z, Li H, Wen Z, Fan X, Li Y, Guan R, Guo Y, Wang S, Wang D, Qiu L. Comparison of genetic diversity between Chinese and American Soybean (Glycine max (L.)) accessions revealed by high-density SNPs. Front Plant Sci. 2017;8:2014–2014. doi: 10.3389/fpls.2017.02014. [DOI] [PMC free article] [PubMed] [Google Scholar]
- Mao T, Li J, Wen Z, Wu T, Wu C, Shi S, Jiang B, Hou W, Li W, Song Q. Association mapping of loci controlling genetic and environmental interaction of soybean flowering time under various photo-thermal conditions. BMC Genom. 2017;18(1):415. doi: 10.1186/s12864-017-3778-3. [DOI] [PMC free article] [PubMed] [Google Scholar]
- Miladinovi J, Svetlana BET, Kristina P, Dragana M. Allelic variation and distribution of the major maturity genes in different soybean collections. Front Plant Sci. 2018 doi: 10.3389/fpls.2018.01286. [DOI] [PMC free article] [PubMed] [Google Scholar]
- Miranda C, Culp C, Škrabišová M, Joshi T, Belzile F, Grant DM, Bilyeu K. Molecular tools for detecting Pdh1 can improve soybean breeding efficiency by reducing yield losses due to pod shatter. Mol Breed. 2019;39(2):27. doi: 10.1007/s11032-019-0935-1. [DOI] [Google Scholar]
- Molnar S, Rai S, Charette MERC. Simple sequence repeat (SSR) markers linked to E1, E3, E4 and E7 maturity genes in soybean. Genome. 2003;46(6):1024–1036. doi: 10.1139/g03-079. [DOI] [PubMed] [Google Scholar]
- Nei M. Genetic distance between populations. Am Nat. 1972;106(949):283–292. doi: 10.1086/282771. [DOI] [Google Scholar]
- Panthee DR, Pantalone VR, West DR, Saxton AM, Sams CE. Quantitative trait loci for seed protein and oil concentration, and seed size in soybean. Crop Sci. 2005;45(5):2015–2022. doi: 10.2135/cropsci2004.0720. [DOI] [Google Scholar]
- Peakall R, Smouse PE. GenAlEx 6.5: genetic analysis in Excel. Population genetic software for teaching and research—an update. Bioinformatics. 2012;28(28):2537–2539. doi: 10.1093/bioinformatics/bts460. [DOI] [PMC free article] [PubMed] [Google Scholar]
- Powell W, Machray GC, Provan J. Polymorphism revealed by simple sequence repeats. Trends Plant Sci. 1996;1(7):215–222. doi: 10.1016/1360-1385(96)86898-1. [DOI] [Google Scholar]
- Prevost A, Wilkinson M. A new system of comparing PCR primers applied to ISSR fingerprinting of potato cultivars. Theor Appl Genet. 1999;98(1):107–112. doi: 10.1007/s001220051046. [DOI] [Google Scholar]
- Pritchard JK, Stephens M, Donnelly P. Inference of population structure using multilocus genotype data. Genetics. 2000;155(2):945–959. doi: 10.1093/genetics/155.2.945. [DOI] [PMC free article] [PubMed] [Google Scholar]
- Rodrigues JIDS, Arruda KMA, Cruz CD, Piovesan ND, Barros EGD, Moreira MA. Association of microsatellite markers with contents of oil and protein in soybean. Pesquisa Agropecuária Brasil. 2013;48(3):255–262. doi: 10.1590/S0100-204X2013000300003. [DOI] [Google Scholar]
- Roldán-Ruiz I, Van Euwijk F, Gilliland T, Dubreuil P, Dillmann C, Lallemand J, De Loose M, Baril C. A comparative study of molecular and morphological methods of describing relationships between perennial ryegrass (Lolium perenne L.) varieties. Theor Appl Genet. 2001;103(8):1138–1150. doi: 10.1007/s001220100571. [DOI] [Google Scholar]
- Salgotra RK, Gupta BB, Bhat JA, Sharma S. Genetic diversity and population structure of basmati rice (Oryza sativa L.) germplasm collected from north western himalayas using trait linked SSR markers. PLoS ONE. 2015;10(7):e0131858. doi: 10.1371/journal.pone.0131858. [DOI] [PMC free article] [PubMed] [Google Scholar]
- Shi A, Chen P, Zhang B, Hou A. Genetic diversity and association analysis of protein and oil content in food-grade soybeans from Asia and the United States. Plant Breed. 2010;129(3):250–256. doi: 10.1111/j.1439-0523.2010.01766.x. [DOI] [Google Scholar]
- Sinclair TR, Marrou H, Soltani A, Vadez V, Chandolu KC. Soybean production potential in Africa. Glob Food Secur. 2014;3(1):31–40. doi: 10.1016/j.gfs.2013.12.001. [DOI] [Google Scholar]
- Singh N, Choudhury DR, Tiwari G, Singh AK, Kumar S, Srinivasan K, Tyagi RK, Sharma AD, Singh NK, Singh R. Genetic diversity trend in Indian rice varieties: an analysis using SSR markers. BMC Genet. 2016;17(1):127. doi: 10.1186/s12863-016-0437-7. [DOI] [PMC free article] [PubMed] [Google Scholar]
- Song QJ, Marek LF, Shoemaker RC, Lark KG, Concibido VC, Delannay X, Specht JE, Cregan PB. A new integrated genetic linkage map of the soybean. Theor Appl Genet. 2004;109(1):122–128. doi: 10.1007/s00122-004-1602-3. [DOI] [PubMed] [Google Scholar]
- Swamy AA, Reddy G. Genetic divergence and heterosis studies in mungbean (Vigna radiata L. Wilczek) Legume Res Int J. 2004;27(2):115–118. [Google Scholar]
- Tamura K, Stecher G, Peterson D, Filipski A, Kumar S. MEGA6: molecular evolutionary genetics analysis version 6.0. Mol Bio Evol. 2013;30(12):2725–2729. doi: 10.1093/molbev/mst197. [DOI] [PMC free article] [PubMed] [Google Scholar]
- Tantasawat P, Trongchuen J, Prajongjai T, Jenweerawat S. SSR analysis of soybean (Glycine max (L.) Merr.) genetic relationship and variety identification in Thailand. Aust J Crop Sci. 2011;5(3):280–287. doi: 10.2134/agronj2010.0325. [DOI] [Google Scholar]
- Tefera H, Kamara AY, Asafo-Adjei B, Dashiell KE. Breeding progress for grain yield and associated traits in medium and late maturing promiscuous soybeans in Nigeria. Euphytica. 2010;175(2):251–260. doi: 10.1007/s10681-010-0181-4. [DOI] [Google Scholar]
- Tsubokura Y, Watanabe S, Xia Z, Kanamori H, Yamagata H, Kaga A, Katayose Y, Abe J, Ishimoto M, Harada K. Natural variation in the genes responsible for maturity loci E1, E2, E3 and E4 in soybean. Ann Bot. 2014;113(3):429–441. doi: 10.1093/aob/mct269. [DOI] [PMC free article] [PubMed] [Google Scholar]
- Upadhyay P, Neeraja CN, Kole C, Singh VK. Population structure and genetic diversity in popular rice varieties of India as evidenced from SSR analysis. Biochem Genet. 2012;50(9–10):770–783. doi: 10.1007/s10528-012-9519-z. [DOI] [PubMed] [Google Scholar]
- Wang L, Guan R, Zhangxiong L, Chang R, Qiu L. Genetic diversity of Chinese cultivated soybean revealed by SSR markers. Crop Sci. 2006;46(3):1032–1038. doi: 10.2135/cropsci2005.0051. [DOI] [Google Scholar]
- Watanabe S, Rumiko H, Zhengjun X, Yasutaka T, Shusei S, Yumi N, Naoki Y, Ryoji T, Masao I, Toyoaki A. Map-based cloning of the gene associated with the soybean maturity locus E3. Genetics. 2009;182(4):1251–1262. doi: 10.1534/genetics.108.098772. [DOI] [PMC free article] [PubMed] [Google Scholar]
- Watanabe S, Zhengjun X, Rumiko H, Yasutaka T, Shusei S, Naoki Y, Ryoji T, Toyoaki A, Satoshi T, Keisuke K. A map-based cloning strategy employing a residual heterozygous line reveals that the GIGANTEA gene is involved in soybean maturity and flowering. Genetics. 2011;188(2):395–407. doi: 10.1534/genetics.110.125062. [DOI] [PMC free article] [PubMed] [Google Scholar]
- Wilson RF. Soybean: market driven research needs. In: Stacey G, editor. Genetics and genomics of soybean. New York: Springer; 2008. [Google Scholar]
- Wilson RF. Designing soybeans for 21st century markets. New York: Elsevier; 2015. [Google Scholar]
- Xia Z, Watanabe S, Tetsuya Y, Yasutaka T, Hiroko N, Hong Z, Toyoaki A, Shusei S, Toshimasa Y, Shixiang L. Positional cloning and characterization reveal the molecular basis for soybean maturity locus E1 that regulates photoperiodic flowering. Proc Natl Acad Sci USA. 2012;109(32):E2155. doi: 10.1073/pnas.1117982109. [DOI] [PMC free article] [PubMed] [Google Scholar]
- Xiong H, Shi A, Mou B, Qin J, Motes D, Lu W, Ma J, Weng Y, Yang W, Wu D. Genetic diversity and population structure of cowpea (Vigna unguiculata L. Walp) PLoS ONE. 2016;11(8):e0160941. doi: 10.1371/journal.pone.0160941. [DOI] [PMC free article] [PubMed] [Google Scholar]
- Yamanaka N, Sato H, Yang Z, Xu DH, Catelli LL, Binneck E, Abdelnoor RV. Genetic relationships between Chinese, Japanese, and Brazilian soybean gene pools revealed by simple sequence repeat (SSR) markers. Genet Mol Biol. 2007;30(1):85–88. doi: 10.1590/S1415-47572007000100016. [DOI] [Google Scholar]
- Yu J, Gael P, Briggs WH, Irie VB, Masanori Y, Doebley JF, Mcmullen MD, Gaut BS, Nielsen DM, Holland JB. A unified mixed-model method for association mapping that accounts for multiple levels of relatedness. Nat Genet. 2006;38(2):203–208. doi: 10.1038/ng1702. [DOI] [PubMed] [Google Scholar]
Associated Data
This section collects any data citations, data availability statements, or supplementary materials included in this article.