

Abstract
Mycobacterium kansasii (Mk) is a resilient opportunistic human pathogen that causes tuberculosis‐like chronic pulmonary disease and mortality stemming from comorbidities and treatment failure. The standard treatment of Mk infections requires costly, long‐term, multidrug courses with adverse side effects. The emergence of drug‐resistant isolates further complicates the already challenging drug therapy regimens and threatens to compromise the future control of Mk infections. Despite the increasingly recognized global burden of Mk infections, the biology of this opportunistic pathogen remains essentially unexplored. In particular, studies reporting gene function or generation of defined mutants are scarce. Moreover, no transposon (Tn) mutagenesis tool has been validated for use in Mk, a situation limiting the repertoire of genetic approaches available to accelerate the dissection of gene function and the generation of gene knockout mutants in this poorly characterized pathogen. In this study, we validated the functionality of a powerful Tn mutagenesis tool in Mk and used this tool in conjunction with a forward genetic screen to establish a previously unrecognized role of a conserved mycobacterial small RNA gene of unknown function in colony morphology features and biofilm formation. We also combined Tn mutagenesis with next‐generation sequencing to identify 12,071 Tn insertions that do not compromise viability in vitro. Finally, we demonstrated the susceptibility of the Galleria mellonella larva to Mk, setting the stage for further exploration of this simple and economical infection model system to the study of this pathogen.
Keywords: biofilm, Galleria mellonella, gene essentiality, Mycobacterium kansasii, nontuberculous mycobacteria, small noncoding RNA
The study validated the functionality of a powerful transposon mutagenesis tool in the poorly studied Mycobacterium kansasii pathogen and used this tool to reveal the role of a small RNA gene in colony morphology and biofilm formation and to identify ≈12,000 insertions that do not compromise viability. The study also demonstrated the susceptibility of the Galleria mellonella larva to Mk, setting the stage for further exploration of this infection model to study this resilient nontuberculous mycobacterial pathogen.
1. INTRODUCTION
Chronic pulmonary disease (CPD) due to opportunistic infections of nontuberculous mycobacterial (NTM) pathogens from environmental sources has become an increasingly recognized global public health problem (Kendall & Winthrop, 2013; Prevots & Marras, 2015). At least forty NTM spp. are associated with CPD (Daley & Griffith, 2010). The ubiquitous slow‐growing Mycobacterium kansasii (Mk) is among the six most common NTM spp. associated with CPD in the United States and many other areas of the world, where it is often surpassed only by the Mycobacterium avium complex (Davies, Roberts, Kaul, Klein, & Milburn, 2012; Hoefsloot et al., 2013; Mirsaeidi, Farshidpour, Allen, Ebrahimi, & Falkinham, 2014; Prevots & Marras, 2015). The burden of Mk infections is not surprising given that the risk factors include HIV infection, pharmacological immunosuppression, chronic obstructive pulmonary disease (COPD), malignancy, bronchiectasis, and previous mycobacterial disease (Maliwan & Zvetina, 2005; Prevots & Marras, 2015). Mk is often present in human‐made water systems, where it forms resilient biofilms (Chakraborty & Kumar, 2019; Kwenda et al., 2015; Vaerewijck, Huys, Palomino, Swings, & Portaels, 2005). Infection generally originates following inhalation, aspiration, ingestion, or local inoculation (Griffith et al., 2007; Vaerewijck et al., 2005). Although person‐to‐person transmission has not been reported, some studies suggest that it might be possible, and the potential emergence of strains with an epidemiologically meaningful person‐to‐person transmission capacity is a concern (Ricketts, O'Shaughnessy, & van Ingen, 2014).
Mycobacterium kansasii has seven subtypes, with subtype 1 being by far the most prevalent in human isolates, followed by subtype 2. The remaining subtypes are recovered from environmental samples almost exclusively (Bakula, Safianowska, Nowacka‐Mazurek, Bielecki, & Jagielski, 2013; Picardeau, Prod'Hom, Raskine, LePennec, & Vincent, 1997; Taillard et al., 2003; Tortoli, 2003). Mk has a relatively close phylogeny to the Mycobacterium tuberculosis (Mtb) complex and its related Mycobacterium canettii clade, and an Mk‐like opportunistic pathogen is believed to be an Mtb complex ancestor (Minnikin et al., 2015; Veyrier, Pletzer, Turenne, & Behr, 2009; Wang et al., 2015). Moreover, Mk has been considered as a possible model to explore the evolutionary transition from the environmental opportunistic pathogen lifestyle to the obligate pathogen lifestyle seen in the genus, and as a surrogate of Mtb for tuberculosis (TB) pathogenesis studies (Minnikin et al., 2015; Wang et al., 2015).
The CPD caused by Mk resembles TB and its mortality is associated with comorbidities and treatment failure (Ehsani, Reddy, Mosunjac, Kraft, & Guarner, 2015; Evans et al., 1996; Hirashima et al., 2014; Maliwan & Zvetina, 2005). Relapses occur often (≈10%) and cure rates are only 80%–90% (Davies et al., 2012; Mirsaeidi et al., 2014; Santin et al., 2009). The prevalence of Mk CPD remains under‐recognized, particularly in high TB‐HIV burden areas, due to overlapping features with TB, lack of proper diagnosis, and absence of compulsory reporting policy. Nevertheless, it is clear that Mk CPD continues to rise with the enduring HIV epidemic and the increase of other predisposing factors in the population (e.g., immunosuppression and COPD). In addition, infection of skin and subcutaneous tissue is not uncommon, and, like primary lung infection, may lead to disseminated disease in people with a compromised immune system or other vulnerabilities (Brown‐Elliott, Nash, & Wallace, 2012; Flor, Capdevila, Martin, Gavalda, & Pahissa, 1996; Henkle & Winthrop, 2015; Johnston & Elwood, 2011).
The complex drug treatment of Mk CPD exacerbates the public health challenge this pathogen presents. Costly, long‐term, multidrug courses with adverse side effects often reduce compliance and positive treatment outcomes (Brown‐Elliott et al., 2012; Griffith et al., 2007). A main first‐line treatment in the Unites States has been a regimen that includes three anti‐TB drugs (typically rifampin or rifabutin, ethambutol, and isoniazid) daily until the patient has at least 12 months of negative sputum cultures while on therapy (Griffith et al., 2007; Philley & Griffith, 2015). Mk isolates resistant to TB drugs have been reported (Brown‐Elliott et al., 2012; Lyons et al., 2014; Wang et al., 2010; Wu et al., 2009; Yamada et al., 1997). In particular, resistance to rifampin, a drug which has a key role in the multidrug treatment of Mk infections, correlates with higher rates of treatment failure and relapse (Brown‐Elliott et al., 2012; Griffith et al., 2007; Wu et al., 2009). For patients with rifampin‐resistant infections, a usual guideline is a regimen based on in vitro‐determined isolate susceptibilities to secondary agents (e.g., fluoroquinolones, tetracyclines, amikacin, linezolid, trimethoprim‐sulfamethoxazole, and rifabutin) and including at least three drugs (Griffith et al., 2007; Philley & Griffith, 2015).
Despite the burden of Mk infections, the biology of this pathogen remains poorly explored. Encouragingly, the completion of the Mk (subtype 1 strain) genome sequence was recently reported (Wang et al., 2015), and various aspects of Mk biology have been inferred by bioinformatics and extrapolation from insights gained for Mtb (Veyrier et al., 2009; Wang et al., 2015). However, the 6.57 Mb of genetic material carried by Mk represents 2.16 Mb more than that present in Mtb (Cole et al., 1998), and thus in silico approaches do not provide a full picture and may even lead to flawed conclusions. In all, it is clear that experimentation focused on Mk is needed to deepen our knowledge of its biology, further understand its ability to cause disease, and illuminate paths to better therapeutics. In particular, the scarcity of gene function studies and the lack of defined mutants are major barriers to progress in the field. In fact, to our knowledge, there are only four reported Mk gene function studies (Klein, Brown, & French, 2001; Nataraj et al., 2015; Onwueme, Vos, Zurita, Soll, & Quadri, 2005; Sun & Zhang, 1999). Moreover, no transposon (Tn) mutagenesis tool has been validated for use in Mk, a situation limiting the repertoire of genetic approaches to accelerate gene function dissection in this pathogen.
In this study, we explored the use of genome‐wide Tn mutagenesis‐based approaches to interrogate gene function in Mk. We provide proof‐of‐principle for the application of these approaches to Mk by using them to (a) link a conserved small RNA (sRNA) gene to colony morphology and biofilm formation and to (b) identify ≈12,000 Tn insertions that do not impede colony outgrowth. Lastly, we present the first demonstration of the susceptibility of Galleria mellonella (GM) larvae to Mk, thus setting the stage for further exploration of the GM infection model system to study this opportunistic pathogen.
2. MATERIALS AND METHODS
2.1. Routine culturing conditions, molecular biology techniques, and reagents
Mycobacteria were cultured under standard conditions in Middlebrook 7H9, 7H10, or 7H11 media (Difco, Becton‐Dickinson and Co.) supplemented as reported (Chavadi, Edupuganti, et al., 2011; Chavadi, Stirrett, et al., 2011). Mk cultures were agitated at 170 rpm with a few sterile glass beads (3 mm diameter) to reduce aggregation. Mk growth curve experiments were carried out using a 96‐well plate‐based growth assay we reported previously (Chavadi, Edupuganti, et al., 2011), except that the plates were incubated at 37°C. Where appropriate, kanamycin (Km, 30 µg/ml) and/or hygromycin (Hyg, 150 µg/ml) were added to the Middlebrook media. Culturing of Escherichia coli strains was done under standard conditions in Luria–Bertani broth and agar media (Sambrook & Russell, 2001). When required, ampicillin (Amp, 100 µg/ml), Km (30–50 µg/ml), Hyg (150 µg/ml), and/or 5‐bromo‐4‐chloro‐3‐indolyl‐β‐d‐galactopyranoside (X‐Gal, 56 μg/ml) were added to the Luria–Bertani media. DNA manipulations were carried out using established protocols and E. coli as the primary cloning host (Sambrook & Russell, 2001). PCR‐generated DNA fragments used in plasmid constructions were sequenced by the Sanger method to verify fidelity (Genewiz, Inc.). Sequence alignments were carried out using DNASTAR's Lasergene sequence analysis software (DNASTAR, Inc.). Predictions of sRNA structures and minimum free energies were obtained with mFold software using default parameters (Zuker, 2003). Isolation of Mk genomic DNA, plasmid electroporation into Mk, and selection of Mk transformants were carried out following standard methodologies (Chavadi, Edupuganti, et al., 2011; Chavadi, Stirrett, et al., 2011). Unless otherwise indicated, reagents were purchased from Sigma‐Aldrich Inc., Thermo Fisher Scientific Inc., New England Biolabs Inc., Qiagen LLC , or VWR International, LLC. The strains and oligonucleotides used in this study are listed in Tables A1 and A2, respectively (Appendix 1).
2.2. Phage stock preparation, transductions, and transposon mutant selection
High‐titer stocks (≈1011 PFU/ml) of the ϕMycoMarT7 phage were generated and titrated using Mycobacterium smegmatis (Msm) as reported (Siegrist & Rubin, 2009). For Mk transductions, bacteria from actively growing cultures were harvested by centrifugation, washed twice with 1 culture volume of phage buffer (PB: supplemented 7H9 medium lacking Tween‐80), and concentrated 10 times in PB. Mk suspension aliquots were combined with phage stock aliquots to obtain transduction mixtures with desired PFU‐to‐CFU multiplicity of infection (MOI) values. MOIs of 0.3:1 and 1:1 (average) were used in the transductions for generation of the mutant libraries used in the genetic screen and the transposon insertion sequencing experiment, respectively. Mock transduction controls were routinely prepared by adding equivalent volumes of PB to the cell suspensions. Transduction mixtures and mock controls were incubated at 37°C without shaking for 4 hr. After incubation, aliquots of transduction mixtures and mock controls were used to enumerate Km resistant (KmR) CFU and total CFU on agar plates with and without Km, respectively. The remainder of each transduction mixture was made 10% glycerol, aliquoted, and stored at −80°C until use.
2.3. Arrayed library preparation
Transduction mixtures were plated on supplemented Middlebrook 7H10 medium with Km to obtain 100 Tn mutant colonies per plate. The plates were incubated at 37°C for three weeks for KmR colony growth. The KmR colonies were picked and individually arrayed in 96‐well plates (Falcon, Corning) preloaded with supplemented Middlebrook 7H9 medium with Km (200 µl/well). The 96‐well plates were incubated at 37°C with orbital shaking (170 rpm) under a humidified atmosphere for 8 days to grow the microcultures. After incubation, the microcultures were homogenized with a multichannel pipette and replicate inoculated (1.5 µl transfer) with a 96‐pin inoculator (Clonemaster™; Immusine Laboratories, Inc.) into new 96‐well culture plates preloaded with fresh medium. The inoculated plates were then incubated as described above for microculture growth. After incubation, the microcultures were made 4% glycerol and the 96‐well library plates were sealed with sterile adhesive foil film sheets and stored at −80°C until use.
2.4. Morphology screen
The microcultures in the 96‐well library plates were defrosted and homogenized with a multichannel pipette. The microcultures of each library plate were then subcultured into a pair of 96‐well plates (5 µl inoculum into a well preloaded with 195 µl of medium) using an every‐other‐well redistribution pattern. The inoculated 96‐well plates were incubated to grow the microcultures to late‐log phase. Following the incubation, the microcultures were homogenized as above, and 1.5 µl of each microculture was spotted onto supplemented 7H10 plates using a 96‐pin inoculator. The inoculated screen plates were incubated at 37°C until most macrocolonies reached 0.5–1.0 cm in diameter (≈18 days). After incubation, the screen plates were scrutinized for macrocolonies with mutant phenotypes by naked eye and using an Olympus SZX7 stereo microscope (Olympus Corp.).
2.5. Southern blot hybridization analysis
Samples of genomic DNA (0.5–1.0 µg) digested with SacII (an enzyme that does not cut within the Tn) were separated alongside a prestained DNA molecular weight marker (F. Hoffmann‐La Roche, Ltd.) by electrophoresis in a 0.7% agarose gel. After electrophoresis, the DNA on the gel was denatured and transferred onto a nylon membrane (Amersham Hybond N+; GE Healthcare Life Sciences) as reported (Quadri, Sailer, Roy, Vederas, & Stiles, 1994). The Tn‐specific 512‐bp DIG‐labeled DNA hybridization probe was generated by PCR amplification using primers GG1 and GG2 and a PCR DIG‐labeled probe synthesis kit (F. Hoffmann‐La Roche, Ltd.) according to manufacturer's instructions. The probe was used for the hybridization analysis following reported protocols (Quadri et al., 1994; Sambrook & Russell, 2001) and visualized by chromogenic detection using a DIG‐labeled DNA detection kit (F. Hoffmann‐La Roche, Ltd.) according to the DIG Application manual (F. Hoffmann‐La Roche, Ltd.).
2.6. Identification of the transposon insertion site in Mycobacterium kansasii 13D6
Cloning of the Tn‐containing genomic fragment and Tn‐genome junction sequencing were carried out as reported (Siegrist & Rubin, 2009). Briefly, genomic DNA digested with SacII was self‐ligated and transformed into E. coli DH5α λpir for rescue cloning of Tn‐containing genomic fragments. The cloned plasmids were purified, and the Tn‐genome junctions were sequenced using primers CB2 and CB2b. The genomic sequences identified were mapped onto the Mk ATCC 12478 genome (chromosome: GenBank NC_022663.1; plasmid pMK12478: GenBank NC_022654.1).
2.7. Construction of plasmids pML‐B11 and pML1335Δ xylE
To generate pML‐B11, vector pML1335 (Huff, Czyz, Landick, & Niederweis, 2010) was digested with BspHI and NotI to excise the xylE marker segment. The resulting linearized vector backbone was ligated to a BspHI‐NotI fragment encompassing the Mk B11 gene along with its adjacent extragenic regions (chromosomal coordinates 2809862–2810381, 520 bp). The fragment was generated by PCR amplification from genomic DNA using primers CB3 and CB7, cloned into pCR2.1‐TOPO (TOPO TA cloning kit; Invitrogen), sequenced for fidelity verification, and then subcloned into the pML1335 backbone as noted above to create pML‐B11. The sequence of B11 determined for the ATCC® 12478™ strain used in this study was found to have a hepta‐C string instead of the hexa‐C string in the annotated chromosome (GenBank: NC_022663.1) that maps to the loop of the middle stem‐loop of the sRNA. Plasmid pML1335Δ xylE (empty vector control) was generated by removal of the xylE marker segment of pML1335 and subsequent vector backbone religation.
2.8. RNA isolation
Pellets containing 1–5 × 10⁷ CFU of Mk grown in supplemented Middlebrook 7H9 medium to log phase or scrapings of equivalent mass taken from macrocolonies grown at 37°C for 23 days on supplemented Middlebrook 7H10 plates were resuspended in 1 ml TRIzol™ reagent (Invitrogen™). The resuspended cells were lysed with zirconia/silica beads (Bio Spec Products Inc.) in a bead‐beater homogenizer (Mini‐BeadBeater 16, Bio Spec Products Inc.) using two bead‐beating cycles of 50 s each separated by a 10‐min chilling step on ice. The lysates were spun (22,000 g, 2 min, 4°C) to pellet beads and cellular debris. The supernatants were transferred to siliconized microcentrifuge tubes, combined with 300 µl of chloroform:isoamyl alcohol (24:1), shaken vigorously for 15 s, and incubated at room temperature for 3 min. After incubation, the samples were centrifuged (12,000 g, 15 min, 4°C), and the RNA was isolated from the supernatant using PureLink™ RNA Mini and miRNA Isolation Kits (Invitrogen™) following the manufacturer's instructions.
2.9. Northern blot analysis
Total RNA (1 µg, originated from 2 × 10⁶ CFU) was separated on a 6% denaturing polyacrylamide gel (Novex precast 6% TBE‐Urea polyacrylamide gel, Invitrogen™) run in a XCell SureLock™ Mini‐Cell (Invitrogen™) according to manufacturer's protocols. Prestained molecular weight markers (DynaMarker DM270; BioDynamics Laboratory Inc.) were separated alongside Mk total RNA and the 100‐bp hybridization probe fragment (see below), which was used as reference for maker size calibration. After electrophoresis, the gel was electroblotted onto a nylon membrane (Amersham Hybond N+; GE Healthcare Life Sciences) using a XCell SureLock™ Mini‐Cell Blot Module (Invitrogen™) in the XCell SureLock™ Mini‐Cell according to manufacturer's instructions and subsequently baked for 2 hr at 80°C. An Mk B11‐specific DIG‐labeled hybridization probe (100 bp; genome coordinates 2810109–2810208) was generated by PCR amplification using primers CB9c3 and CB8c and a PCR DIG‐labeled probe synthesis kit (F. Hoffmann‐La Roche, Ltd.) according to manufacturer's instructions. The probe was used for the hybridization analysis following reported protocols (Quadri et al., 1994; Sambrook & Russell, 2001) and visualized by chromogenic detection using a DIG‐labeled nucleic acid detection kit (F. Hoffmann‐La Roche, Ltd.) according to the DIG Application manual (F. Hoffmann‐La Roche, Ltd.).
2.10. RT‐qPCR analysis
The experiments were done using transcript target‐specific primer pairs (Table A2 in Appendix 1) and the QuantiNova® SYBR® Green RT‐PCR Kit as recommended by the manufacturer (Qiagen, LLC ). All primer pairs were optimized to have >90% amplification efficiency (as judged by standard curves generated from genomic DNA) and to produce a unique amplicon (as judged by melt curve analysis) of the expected size (as judged by agarose gel electrophoresis). RNA samples used for RT‐qPCR were DNase‐treated and verified to be free of DNA contamination by PCR. One‐step RT‐qPCR reactions (10 µl, 30 pg of RNA template) were run in a Rotor‐Gene Q light cycler (Qiagen, LLC). Two‐step PCR cycling was performed as follows: 95°C for 5 s and 60°C for 10 s for 40 cycles. For each transcript target, the threshold cycle (C t) was normalized to the C t of the standard mycobacterial internal calibrator sigA transcript to generate transcript relative abundance data as reported (Dubnau, Fontan, Manganelli, Soares‐Appel, & Smith, 2002; Livak & Schmittgen, 2001).
2.11. Biofilm formation
The biofilm formation assay was carried out using the MBEC™ device (Innovotech Inc.) and a protocol comparable to one we recently reported (Mohandas et al., 2016). Briefly, Mk cells from actively growing cultures were harvested by centrifugation and resuspended to an OD600 of 0.1 in Middlebrook 7H9 lacking ADN supplementation (Chavadi, Stirrett, et al., 2011) and Tween‐80. The cell suspensions were loaded (150 µl/well) into the 96‐well plates, and the plates were incubated with 100 rpm agitation at 37°C for 6 weeks under a humidified atmosphere. After incubation, Mk culture‐exposed pegs and sterile broth‐exposed control pegs were washed twice with distilled water, briefly dried at room temperature, stained for 15 min with 0.5% crystal violet (CV), rinsed thrice with distilled water, and dried overnight. The CV on the pegs was then extracted in 95% ethanol and quantified spectrophotometrically at 595 nm using a DTX 880 multimode detector microplate reader (Beckman Coulter, Inc.).
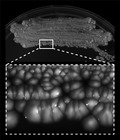
2.12. Galleria mellonella larva killing assay
The assay was carried out using an infectious dose and methodologies comparable to those recently reported for other slow‐growing mycobacteria (Li et al., 2018). Larvae in the sixth instar stage were purchased from Timberline Fisheries, Corp. (Marion, IL) and used the day of delivery. Only larvae displaying healthy movement, no melanization signs, and 150–250 mg body weight were used in the experiments. Larvae were restrained for injection as reported (Dalton, Uy, Swift, & Wiles, 2017), and injections were given into the last left pro‐leg using a 22 s ga beveled stainless steel needle affixed to a 50‐µl Hamilton syringe. For each experiment, groups of 15 larvae were injected with 10 µl of either sterile phosphate‐buffered saline [PBS (Li et al., 2018)] or PBS carrying 1 × 10⁷ CFU, or not injected. Each larval group was placed in a paper‐lined 10‐cm petri dish, and the dishes were incubated in the dark at 37°C or 25°C and observed daily for larva survival. Larvae were considered dead when no movement was elicited upon physical stimulation. Kaplan–Meier curves were used to plot survival data, and the Log‐rank (Mantel‐Cox) test embedded in Prism v6.01 (GraphPad Software, Inc.) was used for curve comparisons.
2.13. Transposon insertion sequencing experiment
Colonies from a library of ≈14,700 Tn mutants were scraped from supplemented 7H11 plates, and genomic DNA was isolated from the mutant pool as reported (Chavadi, Stirrett, et al., 2011). A modified TraDIS‐type method (Fan et al., 2018; Langridge et al., 2009) customized for the Himar1‐based Tn in ϕMycoMarT7 was used to identify the insertion sites in the genomic DNA library pool. Briefly, genomic DNA was fragmented to a ≈350‐bp average length and adaptor sequences were ligated to each end of the fragments using the KAPA HyperPlus Kit (Kapa Biosystems, Inc.) as recommended by the manufacturer. Two rounds of optimized PCR reactions (PCR‐1 and PCR‐2) were performed to enrich for Tn‐genomic DNA junction fragments and make the final PCR product suitable for Illumina sequencing. PCR‐1 was done with a Tn‐specific primer (CB1) and an adapter‐specific primer (IS5) for Tn‐genome junction enrichment. PCR‐2 (hemi‐nested) was run with the adapter‐specific primer IS5 and a Tn‐specific primer adding the sequences needed for Illumina sequencing and barcoding of each sample (primers CB25.3_R or CB44.3_R). (See Appendix 3 ) The generated fragment libraries were sequenced on an Illumina NextSeq 500 System using a NextSeq500/550 Mid Output Kit (150 cycles; 2 × 75 cycles; paired‐end reads; Illumina Inc.). Custom primers were spiked to initiate the index read (primer barcodeseq) and read two sequencing (primer SP2). Raw sequencing read data were processed as follows. (a) Duplicate reads (same sequences for paired‐end reads, considered PCR siblings) were compressed into a single representative read. (b) Reads were filtered further based on the presence of the terminal 5‐bp Tn sequence (TGTTA) adjacent to the Tn primer (CB25.3_R or CB44.3_R). (c) The primer sequences were trimmed. (d) Each filtered and trimmed read was mapped onto the Mk chromosome (GenBank: NC_022663.1) and plasmid pMK12478 (GenBank: NC_022654.1) sequences using BLAST (https://blast.ncbi.nlm.nih.gov/BLAST).
3. RESULTS AND DISCUSSION
3.1. Evaluation of the ϕMycoMarT7 transposon mutagenesis system in Mycobacterium kansasii
The ϕMycoMarT7 phagemid system has been the most successful Tn mutagenesis approach for mycobacteria thus far (Sassetti, Boyd, & Rubin, 2001). The system relies on specialized transduction by a temperature‐sensitive mycobacteriophage to deliver a Himar1 derivative Tn. The Tn inserts randomly at TA dinucleotide sites via a cut‐and‐paste mechanism dependent on a transposase encoded outside the Tn in ϕMycoMarT7. In susceptible hosts, the ϕMycoMarT7 phage typically defaults to a lytic cycle at the permissive temperature (30°C), but it does not replicate and becomes an effective Tn delivery suicide vector at the nonpermissive temperature (37°C). The system has been demonstrated to be functional in a few Mycobacterium spp. (Mtb, Msm, M. bovis BCG, M. avium subsp. paratuberculosis, M. marinum, and M. fortuitum) (Driessen et al., 2010; Sassetti et al., 2001; Wang, Pritchard, Kreitmann, Montpetit, & Behr, 2014). However, it is not expected to work in all Mycobacterium spp. due to phage host range, Tn functionality, or other limitations (Bardarov et al., 1997; Rybniker, Kramme, & Small, 2006). Ultimately, the functionality of the system in any given Mycobacterium sp. needs to be experimentally determined.
Due to the advantages of the ϕMycoMarT7 system, we set out to evaluate its performance in Mk. To this end, we first assessed the ability of the phage to produce plaques on Mk lawns at the permissive and nonpermissive temperatures. As a control, we carried out the equivalent experiment using lawns of Msm, the standard host for ϕMycoMarT7 phage propagation and titration. These experiments revealed that the phage was able to produce plaques on Mk lawns only at the permissive temperature (Figure 1a) and that the plaque formation efficiency was ≈800‐fold lower in the pathogen than in Msm (Figure 1b). The latter finding suggests that either the infection step or the lytic cycle, or both, is less efficient in Mk. Overall, these results demonstrate that the ϕMycoMarT7 phage infects Mk and its temperature sensitivity trait is maintained in this pathogen.
Figure 1.
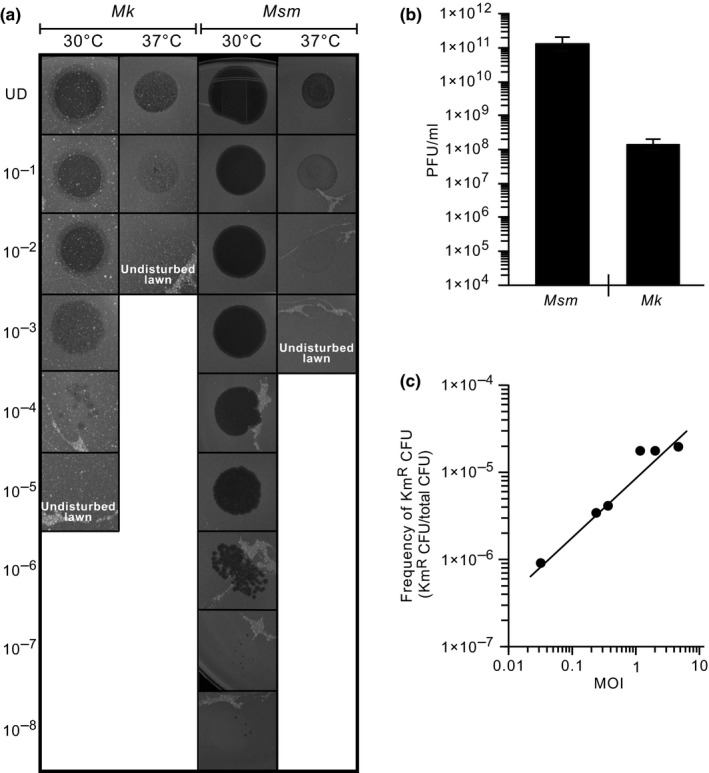
Functionality of the ϕMycoMarT7‐based transposon mutagenesis system in Mycobacterium kansasii. (a) Images showing the plaque formation capacity of the ϕMycoMarT7 phage on lawns of Mk and Msm at the permissive (30°C) and nonpermissive (37°C) temperatures. The numbers to the left of the image represent a 10‐fold dilution series of the phage stock. UD, undiluted phage stock. (b) Comparison of plaque formation efficiency on lawns of Mk and Msm at the permissive temperature. The data represent mean ± SE of at least two PFU titrations. (c) Effect of the multiplicity of infection (MOI) used in the transduction mixture on the efficiency of generation of Mk Tn mutants
We next investigated whether ϕMycoMarT7 could deliver the Tn to Mk at the nonpermissive temperature to give rise to Tn mutants. We carried out Mk transductions and followed each of them with selective outgrowth and enumeration of KmR colonies. We also carried out mock transduction control experiments (phage omitted) to determine the frequency of spontaneous KmR mutants under our experimental conditions. In all, we found that the number of Tn mutants increased with the MOI used in the transduction mixture (Figure 1c) and observed no meaningful frequency of spontaneous KmR colonies (less than 1 in 106 CFU; not shown). Lastly, the results of the transposon insertion sequencing (TIS) experiment described below confirmed that the TA site specificity of the Tn is preserved in Mk. In all, our results demonstrate that the ϕMycoMarT7‐based Tn mutagenesis system is fully functional in Mk.
3.2. A Mycobacterium kansasii transposon mutant library screen links a conserved sRNA gene of unknown function to colony morphology
The realization that the ϕMycoMarT7 system is functional in Mk opens the possibility to explore its use in forward genetic screens to unveil genotype‐phenotype associations and dissect gene function. To pilot this concept, we carried out a small screen for macrocolony morphology mutants. We note that the term “macrocolony” used herein refers to the growth arising from spot inoculation (multi‐CFU seeding) from a liquid culture onto solid growth media, a colonial growth often considered a biofilm community (e.g., Chapelais‐Baron et al., 2018; Kempes, Okegbe, Mears‐Clarke, Follows, & Dietrich, 2014).
We selected a macrocolony morphology screen for our concept exploration because we hypothesized that it might lead to identification of mutants with insertions in genes involved in defining cell envelope surface properties with an impact on biofilm formation capacity, a trait linked to the public health problem associated with Mk. Environmental Mk biofilms are considered recalcitrant pathogen reservoirs, and biofilm formation in the host is thought to contribute to the intractability of mycobacterial infections (Aldridge, Keren, & Fortune, 2014; Chakraborty & Kumar, 2019). Thus, identification of genes involved in biofilm formation will lead to a better understanding of Mk biology and illuminate potential paths to new therapeutics and strategies for pathogen reservoir eradication.
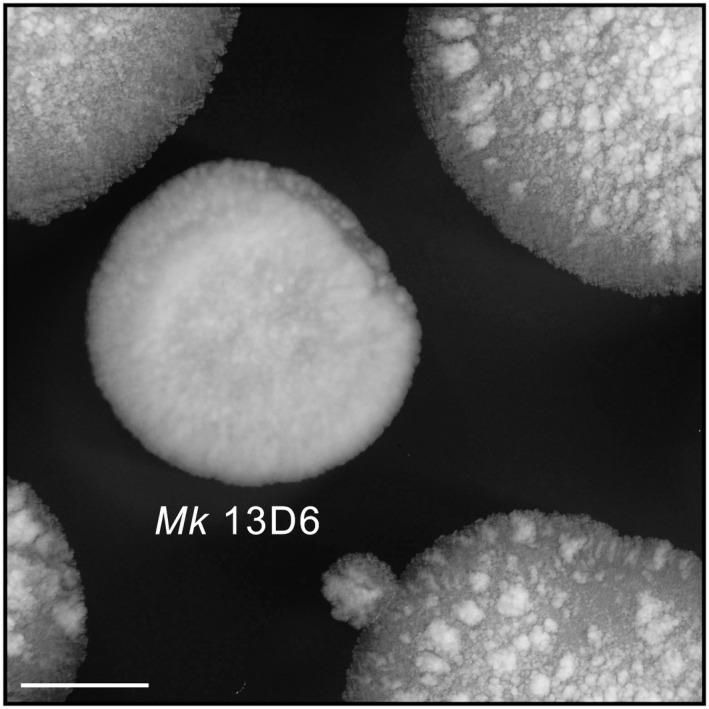
For the pilot screen, we generated a library of several hundred Tn mutants arrayed in 96‐well plates, spot‐inoculated the library onto solid growth medium plates, incubated the screen plates for macrocolony growth, and then scrutinized the plates for mutants with macrocolony abnormalities. We identified a mutant (herein referred to as 13D6) visibly distinct from the wild type (WT) (Appendix 2, Figure A1) and selected it for further analysis. We found that the typical 13D6 macrocolony had a reduced diameter, abnormal surface topology, and a smooth and glistening appearance that contrasted the rough and dried phenotype of the WT (Figure 2a). The distinct phenotype of the mutant was even more evident on streak plates (Figure 2b). Single colonies of 13D6 were also reduced in size (Figure 2c) and displayed an atypical surface appearance (Figure 2d) compared to WT. Notably, the mutant displayed cell shape and planktonic growth comparable to that of the parental strain (Appendix 2, Figure A2).
Figure 2.
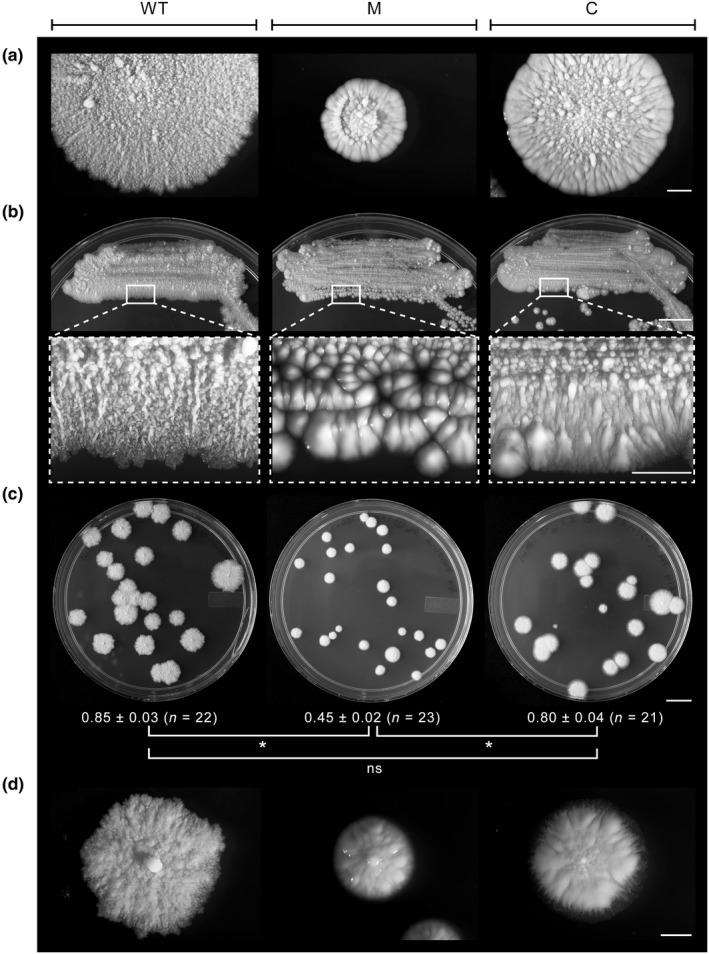
Morphology phenotypes of Mycobacterium kansasii strains. (a) Representative spot inoculation‐derived macrocolonies showing morphological features. Scale bar = 2 mm. (b) Plates with bacterial streaks (top; scale bar = 1 cm) and enlargements (bottom; scale bar = 2 mm) of the boxed sections showing surface topology and appearance features. (c) Plates with isolated single colonies. Scale bar = 1 cm. Colony diameter (cm) information is presented below each plate. The values shown represent mean ± SE. *Student's t test p values <.05; ns, no significant difference (p ≥ .05). (d) Representative single colonies showing morphology detail. Scale bar = 2 mm. WT, wt‐v; M, 13D6‐v; C, 13D6‐c
Colony morphology is a trait influenced by multiple factors. It is well documented that mycobacterial mutants with abnormal colony morphology often carry mutations in genes implicated in metabolism of complex glycolipids of the outer membrane‐like structure (i.e., the mycomembrane) of the mycobacterial cell envelope, (Ren et al., 2007; Tatham et al., 2012; Yu et al., 2012). In particular, alterations in the content of mycomembrane glycolipids known as lipooligosaccharides (LOS) have been linked occasionally to smooth‐rough morphotype changes in Mk (Belisle & Brennan, 1989; Nataraj et al., 2015). Thus, it is tempting to speculate that the abnormal (macro)colony appearance of the 13D6 mutant suggests that the Tn insertion led to changes in mycomembrane composition and/or structure.
We verified that 13D6 had a single Tn insertion (Appendix A2, Figure A3) and identified the insertion site. We found that the Tn had inserted 6 bp upstream of what we propose is a nonannotated sRNA gene orthologous to a nonessential Mtb sRNA gene of unknown function named B11 (a.k.a. ncRv13660c) (Arnvig, Cortes, & Young, 2014; Arnvig & Young, 2009; DeJesus et al., 2017) (Figure 3a). The two orthologs have high sequence identity (Figure 3b), and their sRNA products have essentially the same predicted secondary structure (Figure 3c). Following the new nomenclature guidelines for naming mycobacterial noncoding sRNAs (Lamichhane, Arnvig, & McDonough, 2013), we named the predicted Mk sRNA gene ncMKAN_RS112130c (herein referred to as Mk B11 for simplicity). Our cross‐species genome sequence similarity analysis revealed that the B11 gene locus is highly conserved in the Mycobacterium genus (Appendix 2, Figure A4a) and in many representative members of other genera of Actinobacteria (not shown). These findings are consistent with reported analyses (DiChiara et al., 2010; Mai et al., 2019; Weinberg et al., 2007). The conservation of this gene suggests that its sRNA product has a critical function in the biology of Actinobacteria.
Figure 3.
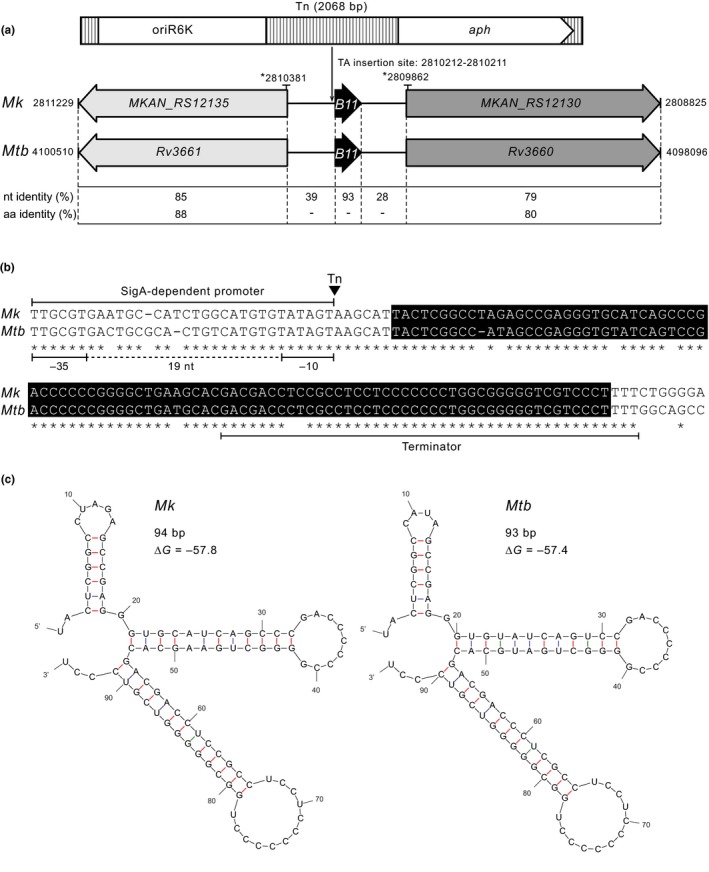
Mycobacterium kansasii 13D6 has a transposon insertion located 6 bp upstream of an sRNA gene (Mk B11) orthologous to the Mycobacterium tuberculosis sRNA gene B11. (a) Outline depicting the Tn (Escherichia coli replication origin oriR6k and aph KmR marker are represented), the location of the TA insertion site (chromosomal coordinates are shown), and the conservation of genetic features nearby the insertion site in the Mk chromosome (NC_022663.1) and the orthologous segment in the Mtb chromosome (NC_000962.3). Chromosomal coordinates of the segments are indicated. The coordinates of the chromosomal fragment included in the complementation plasmid pML‐B11 are marked by an asterisk (*). Nucleotide (nt) and amino acid (aa) identity between specific sections of the segments is provided. (b) Sequence alignment of Mk and Mtb B11 loci. The boxed sequences correspond to the annotated Mtb B11 gene. The location of the Tn (inverted triangle) and putative promoter and terminator sequences are depicted. (c) Predicted secondary structures for the sRNA products of the B11 genes. The minimum free energy associated with each structure is shown
Figure 4.
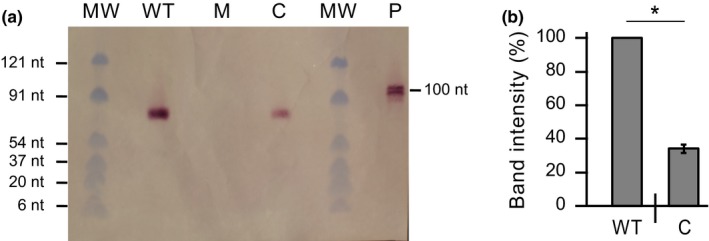
Northern blot analysis of Mycobacterium kansasii B11 sRNA in M. kansasii strains. (a) Representative northern blot demonstrating the presence of B11 sRNA in the WT strain (wt‐v, lane WT) and complemented strain (13D6‐c, lane C) and its absence in the mutant strain (13D6‐v, lane M). Lane MW, molecular weight markers; lane P, B11 probe fragment (100 bp). (b) Northern blot‐based comparison of B11 expression in the WT (WT) and complemented (C) strains. The bands on the blot were quantified by densitometry analysis using ImageJ software (NIH, available in the public domain). The data represent mean ± SE of quantifications from three northern blots. *Student's t test p values <.0001
Based on the position of the Tn in the 13D6 mutant, we hypothesized that the insertion might have abolished B11 transcription by separating the gene from its promoter. Consistent with this idea, the Mk B11 5′ flanking region contains a putative SigA‐dependent promoter (Figure 3b), a feature conserved in the Mtb B11 locus (Arnvig & Young, 2009). We found the equivalent putative promoter sequence upstream of the B11 orthologs in other Mycobacterium spp. (Appendix 2, Figure A4b). To investigate the hypothesized impact of the Tn insertion in 13D6 on B11 expression, we compared B11 transcript levels between the 13D6 and WT strains by northern blot analysis of RNA isolated from planktonic cultures and by RT‐qPCR analysis of RNA isolated from macrocolonies and from planktonic cultures. We also assessed whether the transcript levels of the genes flanking B11 (i.e., MKAN_RS12130 and MKAN_RS12135; Figure 3a) had been altered in 13D6. The northern blot analysis revealed an sRNA transcript (≈80 nt) in the expected size range in the WT strain but not in the mutant (Figure 4a). In agreement with this, the RT‐qPCR analysis showed that the insertion led to reductions in transcript levels of 769‐fold and 833‐fold in macrocolony cells (Figure 5a) and planktonic cells (Figure 5b), respectively, relative to WT. Conversely, the insertion had no significant impact on the transcript levels of the flanking genes in either macrocolony (Figure 5c) or planktonic (Figure 5d) cells. Thus, we conclude that the Tn insertion essentially shut down B11 transcription from its native promoter, and attribute the residual B11 transcript detected in the mutant by the highly sensitive RT‐qPCR analysis to Tn‐driven trace transcription of the downstream B11 gene, a view supported by the literature on the Tn delivered by ϕMycoMarT7 (Rubin et al., 1999; Zhang et al., 2012).
Figure 5.

RT‐qPCR expression analysis of B11 and adjacent genes in Mycobacterium kansasii strains. (a) Expression of B11 in macrocolonies. (b) Expression of B11 in planktonic cells. (c) Expression of B11 gene neighbors in macrocolonies. (d) Expression of B11 gene neighbors in planktonic cells. WT, wt‐v; M, 13D6‐v; C, 13D6‐c. In‐bar values reflect fold reduction in the indicated strain relative to WT. Data represent mean ± SE of at least two independent experiments. Student's t test p values: *<.05; **<.01; ns, no significant difference (p ≥ .05)
In light of these results, we hypothesized that the lack of WT levels of B11 transcription in the 13D6 mutant led to the morphology phenotype. To test this idea, we engineered and analyzed the phenotype of a genetic complementation control strain (13D6‐c). The strain was generated using the plasmid pML‐B11 to endow 13D6 with a WT copy of the B11 locus by plasmid integration at the mycobacteriophage L5 attB site of the Mk chromosome (coordinates 1225397–1225458; Appendix 2, Figure A5), which we identified using the Msm attB site as reference sequence (Lee, Pascopella, Jacobs, & Hatfull, 1991). pML‐B11 carries B11 along with its adjacent extragenic regions (Figure 3a), which were included in the cloned fragment to preserve any unrecognized cis‐acting elements that might have been required for control of B11 transcription or B11 transcript termination or processing. We also constructed an empty vector (pML1335Δ xylE)‐carrying control of 13D6 (strain 13D6‐v) and one of the WT (strain wt‐v), and included these strains in the complementation analysis. Evaluation of the morphology phenotype of the various strains revealed that empty vector integration had no impact on the phenotype of the mutant, whereas integration of pML‐B11 led to a strong partial complementation (Figure 2).
The partial complementation seen in 13D6‐c led us to assess whether the transcript level of B11 in the strain had indeed been restored to WT levels. We found that integration of pML‐B11 in 13D6 raised the B11 transcript level 179‐fold (to 23.30% of WT) in macrocolony cells (Figure 5a) and 373‐fold (to 44.81% of WT) in planktonic cells (Figure 5b) as judged by RT‐qPCR analysis. The results are in good agreement with those derived from the northern blot analysis, which indicates a B11 transcript level recovery of 34.14% in the planktonic cells of 13D6‐c relative to WT levels (Figure 4b). In light of the results of the B11 expression analysis, we conclude that the partial complementation is likely due to incomplete restoration of B11 transcript levels. Overall, our findings establish a previously unrecognized role of Mk B11, or any mycobacterial sRNA gene, in the development of (macro)colony morphology features.
3.3. Disruption of B11 transcription leads to biofilm formation deficiency
As noted above, we theorized that our macrocolony morphology screen could lead to identification of mutants with insertions in genes involved in defining cell surface properties with an impact on biofilm formation, a trait that contributes to the pathogen's resilience in environmental reservoirs and in the host. Thus, we investigated the effect of the Tn insertion in 13D6 on biofilm formation using the MBEC™ device. Comparison of the WT and mutant strains in biofilm experiments revealed that only the WT formed biofilm microcolonies on the pegs of the device (Figure 6a). As noted above, the strains have comparable planktonic growth (Appendix 2, Figure A2b) and planktonic growth in MBEC™ plates were indistinguishable between both strains, ruling out the possibility that the observed biofilm formation deficiency of the mutant was due to lack of bacterial growth. The biofilm formation capacity of the B11 locus‐complemented strain 13D6‐c was restored to a level comparable to WT (Figure 6a). Biofilm quantification using a CV‐based colorimetric method (Figure 6b) recapitulated the results from direct peg observation. Taken together, our results demonstrate that the biofilm formation defect of 13D6 is due to a lack of B11 expression. To our knowledge, 13D6 is the first Mk biofilm deficient mutant reported, and our results provide the first example of a mycobacterial sRNA gene involved in biofilm formation.
Figure 6.
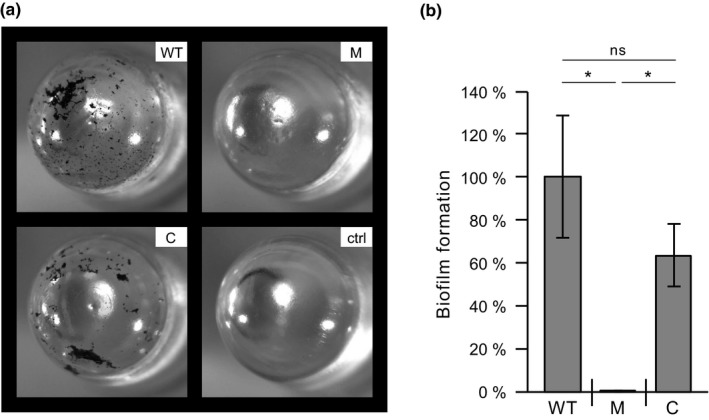
Biofilm formation by Mycobacterium kansasii strains. (a) Representative image of crystal violet‐stained MBEC™ device pegs. (b) Quantification of biofilm formation on pegs using the crystal violet‐based colorimetric assay. WT, wt‐v; M, 13D6‐v; C, 13D6‐c; ctrl, sterile medium control. Data represent mean ± SE of three independent experiments. *Student's t test p values <.05; ns, no significant difference (p ≥ .05)
Overall, our findings indicate that the lack of B11 expression in 13D6 has a pleiotropic effect that impacts (macro)colony morphology features and biofilm formation. The molecular mechanism behind this phenomenon remains to be elucidated. It is tempting to speculate, however, that the sRNA regulates Mk genes influencing colony morphology features and biofilm formation. Interestingly, recent studies have shown that expression of Mtb B11 in Msm, which carries its native B11 ortholog (Appendix 2, Figure A4a), leads to reduced growth and elongated cell shape, and support a model in which the Mtb B11 sRNA represses Msm gene expression by a mechanism requiring base‐pairing of C‐rich loops in the sRNA to G‐rich stretches in mRNA targets (Arnvig & Young, 2009; Mai et al., 2019). Despite this recent progress, the role of this family of sRNA orthologs in actinobacterial biology remains poorly understood and further studies to elucidate their regulatory functions are warranted.
3.4. Disruption of B11 transcription does not cause attenuation in a Galleria mellonella larva killing assay
The GM larva has emerged as a simple and economical invertebrate model host to evaluate virulence of microbial pathogens and efficacy of antimicrobial compounds (Tsai, Loh, & Proft, 2016). Recent studies have validated the use of this model with mycobacteria and shown that larva lethality is species‐dependent (Entwistle & Coote, 2018; Li et al., 2018; Meir, Grosfeld, & Barkan, 2018; Rwegasila, Mubofu, Nyandoro, Erasto, & Munissi, 2016). Given the tractability of this model, we used a GM larva killing assay to provide a first comparison of the WT and 13D6 strains in an in vivo setting. We challenged GM with these strains and monitored larval survival during incubation at either 37°C or 25°C. Comparison of the survival curves of the infected groups with the uninfected controls clearly demonstrated Mk‐dependent killing at 37°C (Figure 7a). However, we found no difference between the survival curves of the Mk‐infected groups. Interestingly, we found no significant Mk‐dependent killing at 25°C (Figure 7b), a temperature much less favorable for Mk replication. Overall, our infection experiments revealed that the Tn‐dependent disruption of B11 transcription in 13D6 had no substantial impact on virulence in the GM model. To our knowledge, our findings provide the first demonstration of the susceptibility of GM larva to Mk, thus setting the stage for further exploration of this model for Mk studies.
Figure 7.

Kaplan–Meier survival curves demonstrating temperature‐dependent killing of Galleria mellonella larvae by Mycobacterium kansasii. WT, WT strain; M, 13D6 mutant; BC, PBS buffer control; NIC, noninjected control. Statistical differences between survival curves were assessed using the Log‐rank test. p values: ***<.0001; **.0053; *.0362; ns, no significant difference (p ≥ .05)
3.5. A transposon insertion sequencing approach identifies 12,071 insertions that do not compromise Mycobacterium kansasii viability
TIS approaches are powerful tools for high‐throughput gene function studies and systems‐level analysis of microorganisms (van Opijnen & Camilli, 2013). We probed the application of TIS in Mk using a modified TraDIS‐type method (Fan et al., 2018; Langridge et al., 2009) customized for the Tn of ϕMycoMarT7 to identify the insertion sites in a DNA library pool generated from a nonsaturated Tn mutant library of ≈14,700 mutant colonies. The analysis mapped a total of 12,071 different TA insertion sites (Table 1, Figure A6 in Appendix 2), indicating that none of these insertions disrupted essential functions required for colony outgrowth under our experimental conditions. Of the 12,071 insertions, 9,885 were intragenic, impacting 3,474 (62%) genes of the chromosome (Table S1, available at https://doi.org/10.5281/zenodo.3561175) and 112 (74%) genes of the plasmid pMK12478 (Table S2, available at https://doi.org/10.5281/zenodo.3561175). The TA sites hit by the Tn in the chromosome and in pMK12478 represent 12% and 17% of the total TA sites in each amplicon, respectively (Table 1). The chromosome and pMK12478 have a comparable percent of coding bp (87% and 84%, respectively), and the same average frequencies of intragenic TA sites (1 TA/71 bp) and intergenic TA sites (1 TA/43 bp). Notably, however, while the percent of intergenic TA sites hit for the two amplicons relative to the respective total intergenic TA sites is essentially the same (11%–12%), the percent of intragenic TA sites hit relative to the amplicon's total intragenic TA sites is considerably depressed in the chromosome (12%) compared to that of the plasmid (18%). Since insertions disrupting essential functions required for colony outgrowth are not expected to be represented in the mutant library, the observed bias against chromosomal intragenic insertions is probably a reflection of the presence of essential genes in the chromosome. We note that the nonsaturated nature of the library analyzed (Table 1, Figure A6 in Appendix 2) precludes the statistical analysis of insertion distribution along replicons and locus‐dependent transposition biases often associated with saturation Tn mutagenesis approaches used in gene essentiality analysis (DeJesus, Ambadipudi, Baker, Sassetti, & Ioerger, 2015; DeJesus et al., 2017; DeJesus & Ioerger, 2013; DeJesus et al., 2013; Griffin et al., 2011; Long et al., 2015). Nevertheless, in all, our results expand our knowledge of Mk gene function, provide proof‐of‐principle for the use of a ϕMycoMarT7‐based TIS approach in Mk, and set a methodological framework for coupling saturating Tn mutagenesis and TIS for genome‐scale gene function analysis and systems‐level studies in this mycobacterial pathogen.
Table 1.
Summary of mapped transposon insertion sites in the Mycobacterium kansasii chromosome and plasmid
| Chromosome | Plasmid | |
|---|---|---|
| Total TA sites hit | 11,696 | 375 |
| Total TA sites hit relative to total TA sites | 12% (of 97,702) | 17% (of 2,251) |
| Intragenic TA sites hit | 9,573 | 312 |
| Intragenic TA sites hit relative to total TA sites hit | 82% | 83% |
| Intragenic TA sites hit relative to total intragenic TA sites | 12% (of 78,383) | 18% (of 1,723) |
| Intergenic TA sites hit | 2,123 | 63 |
| Intergenic TA sites hit relative to total TA sites hit | 18% | 17% |
| Intergenic TA sites hit relative to total intergenic TA sites | 11% (of 19,319) | 12% (of 528) |
| Total genes hit | 3,474 | 113 |
| Genes hit relative to total annotated genes | 62% | 74% |
4. CONCLUSIONS
Gaining a comprehensive understanding of the biology of Mk is important to address the public health challenges arising from this poorly studied NTM pathogen. This understanding will help advance our preparedness against the development of multidrug resistant Mk CPD, a likely collateral outcome of the pervasive use of anti‐TB drugs to curb the TB epidemic. In particular, a deeper knowledge of Mk gene function is needed to help illuminate avenues to new and more effective therapeutics. The establishment of the ϕMycoMarT7 system as an effective mutagenesis tool in Mk sets the stage for further use of powerful, genome‐wide scale genetic approaches to accelerate the unraveling of gene function in this pathogen. The use of the ϕMycoMarT7 system reported herein led to the discovery of a role of the conserved mycobacterial B11 sRNA gene in determination of (macro)colony morphology features and biofilm formation. It also permitted the identification of ≈10,000 intragenic Tn insertions that do not impede growth in vitro. These findings expand our knowledge of Mk gene function. Finally, the demonstration of the susceptibility of GM larvae to Mk opens the possibility of using this simple and economical invertebrate infection model system for virulence assessment of Mk mutants and in vivo evaluation of novel antimicrobial lead compounds against Mk.
CONFLICT OF INTEREST
None declared.
AUTHOR CONTRIBUTIONS
William Budell: Formal analysis‐Lead, Investigation‐Lead, Methodology‐Lead, Validation‐Equal, Visualization‐Equal, Writing‐original draft‐Equal, Writing‐review & editing‐Equal. Gabrielle Germain: Investigation‐Supporting, Writing‐review & editing‐Supporting. Niklas Janisch: Investigation‐Supporting, Writing‐review & editing‐Supporting. Zaid McKie‐Krisberg: Data curation‐Equal, Methodology‐Supporting, Resources‐Equal. Anitha Jayaprakash: Data curation‐Equal, Formal analysis‐Supporting, Investigation‐Supporting, Methodology‐Equal, Writing original draft‐Supporting, Writing‐review & editing‐Supporting. Andrew Resnick: Investigation‐Supporting, Writing‐review & editing‐Supporting. Luis Quadri: Conceptualization‐Lead, Formal analysis‐Equal, Funding acquisition‐Lead, Project administration‐Lead, Supervision‐Lead, Validation‐Equal, Visualization‐Equal, Writing‐original draft‐Lead, Writing‐review & editing‐Lead.
ETHICS STATEMENT
Protocols and procedures employed in this investigation were reviewed and approved by the appropriate institutional review committees. Experiments with the invertebrate Galleria mellonella are exempt from Institutional Animal Care and Use Committee oversight (U. S. Public Law 99‐158, Sec. 495).
ACKNOWLEDGMENTS
This work was supported in part by funding from the National Institutes of Health (R03 AI 128314 and R03 AI 135755 to L.E.N.Q.) and endowment support from Carol and Larry Zicklin to L.E.N.Q. We thank Prof. Eric Rubin (Department of Immunology and Infectious Diseases, Harvard School of Public Health, Boston, MA, USA) for providing a ϕMycoMarT7 sample and Prof. Michael Niederweis (Department of Microbiology, University of Alabama at Birmingham, Birmingham, AL, USA) for providing pML1335. We are also grateful to Sherry Oommen (L.E.N.Q. laboratory), Dr. Anna Petrovicheva (Biology Department, Brooklyn College), and Prof. Nicolas Biais (Biology Department, Brooklyn College) for their help with sequence analysis, RT‐qPCR, and optical microscopy, respectively.
APPENDIX 1.
Table A1.
Bacterial strains
| Strain | Characteristics | Source |
|---|---|---|
| Mycobacterium kansasii | Wild type, subtype 1, type strain (ATCC® 12478™) | American Type Culture Collection |
| M. kansasii wt‐v | M. kansasii carrying empty vector pML1335Δ xylE integrated at the phage L5 attB integration site | This study |
| M. kansasii 13D6 | M. kansasii carrying a Tn insertion upstream of B11 (ncMKAN_RS112130c) | This study |
| M. kansasii 13D6‐v | M. kansasii 13D6 carrying empty vector pML1335Δ xylE integrated at the phage L5 attB integration site | This study |
| M. kansasii 13D6‐c | M. kansasii 13D6 carrying complementation plasmid pML‐B11 integrated at the phage L5 attB integration site | This study |
| Mycobacterium smegmatis mc2155 | Wild‐type laboratory strain (ATCC® 700084™) | American Type Culture Collection |
| Escherichia coli DH5α | Strain used for general cloning applications | Thermo Fisher Scientific, Inc. |
| E. coli DH5α λpir | Strain used for rescue cloning of Tn‐containing genomic fragments. The strain containing the pir gene required for replication of plasmids with the R6K‐derived origin of replication present in the Tn | Thermo Fisher Scientific, Inc. |
| E. coli K12 dam−/dcm− | Strain used for propagation of plasmids free of Dam and Dcm methylation | New England BioLabs, Inc. |
Table A2.
Oligonucleotides
| Name | Sequence (5′ → 3′) | Comments |
|---|---|---|
| GG1 | GACTGGCTGCTATTGGGCGAAG | Primers for PCR‐based generation of Tn‐specific probe |
| GG2 | AGAAGGCGATAGAAGGCGATG | |
| CB2b | CGCTTCCTCGTGCTTTACGGTATCGC | Primers for sequencing Tn‐genome junctions. CB2b and CB2 bind the Km resistance gene and the oriR6K origin of replication, respectively |
| CB2 | GAGATAGGGTTGAGTGTTGTTCC | |
| CB3 | ATGCGGCCGCTTCGAATACGTATCATCATCGCCAACACTCCGGGACCAAGGGT | Primers for PCR‐based generation of the 520‐bp chromosomal fragment carried by pML‐B11; genome coordinates 2809862–2810381; NotI and BspHI sites used in cloning are in bold in CB3 and CB7, respectively |
| CB7 | GATCATGAGGACGGTCACCAATCAAGCATAGGT | |
| CB10 | GGCCAGCCCCGTACTCTCGAC | RT‐qPCR primers for MKAN_RS24220 (sigA); 135‐bp amplicon; genome coordinates 5589258–5589392 |
| CB11 | ATCCAGGTAGTCGCGCAGGACT | |
| CB8c | CATTACTCGGCCTAGAGCCGAGGGTGCATC | Primers used for PCR‐based generation of Mk B11‐specific probe for northern analysis and as RT‐qPCR primers for Mk B11; 100‐bp amplicon; genome coordinates 2810109–2810208 |
| CB9c3 | AAAAGGGACGACCCCCGCCAGGG | |
| CB49a | CGCCGACCTCGTTGTCCTGGTCT | RT‐qPCR primers for MKAN_RS12130; 104‐bp amplicon; genome coordinates 2809046–2809149 |
| CB50a | CCAGCCCCAGGTTGGGGTTGA | |
| CB43a | GCGCGGTTGGCAGGTGTTGTCATT | RT‐qPCR primers for MKAN_RS12135; 115‐bp amplicon; genome coordinates 2811070–2811184 |
| CB44a | GGCCAGCGCACTGACTCCCA | |
| IS5 | AATGATACGGCGACCACCGA | Adapter‐specific forward primer used in both PCR reaction rounds (PCR‐1 and PCR‐2) to generate next‐generation Tn‐specific deep sequencing libraries on the Illumina platform. |
| CB1 | CGAGATAGGGTTGAGTGTTGTTC | First Tn‐specific reverse primer used in PCR‐1 to generate next‐generation Tn‐specific deep sequencing libraries on the Illumina platform |
| CB25.3_R | CAAGCAGAAGACGGCATACGAGAT ATCAGTATCTCCGGGGACTTATCAGCCAACC | Second Tn‐specific reverse primer used in PCR‐2. The primer has the Illumina flow cell sequence tag (italicized), followed by a sample barcode (underlined), followed by a random filler sequence (four nucleotides), followed by a Tn‐specific sequence (21 nucleotides; in bold). This will generate Tn‐specific deep sequencing libraries on the Illumina platform |
| CB44.3_R | CAAGCAGAAGACGGCATACGAGAT ATTATAATCTCCGGGGACTTATCAGCCAACC | Second Tn‐specific reverse primer used in PCR‐2. The primer has the Illumina flow cell sequence tag (italicized), followed by a sample barcode (underlined, different from that in CB25.3_R), followed by the filler sequence (same as in CB25.3_R), followed by the Tn‐specific sequence (bold). This will generate Tn‐specific deep sequencing libraries on the Illumina platform |
| Barcodeseq | GGTTGGCTGATAAGTCCCCGGAGAT | Tn‐specific index primer used to sequence the sample‐specific barcodes on the Illumina platform. The primer has the Tn‐specific sequence (bold) followed by the filler sequence |
| SP2 | ATCTCCGGGGACTTATCAGCCAACC | Tn‐specific read 2 primer used to initiate the paired‐end sequencing on the Illumina platform. The primer has the filler sequence followed by the Tn‐specific sequence (bold) |
APPENDIX 2.
Figure A1.
Section of the original screen plate showing the abnormal macrocolony morphology phenotype of Mycobacterium kansasii 13D6. Scale bar = 2 mm
Figure A2.
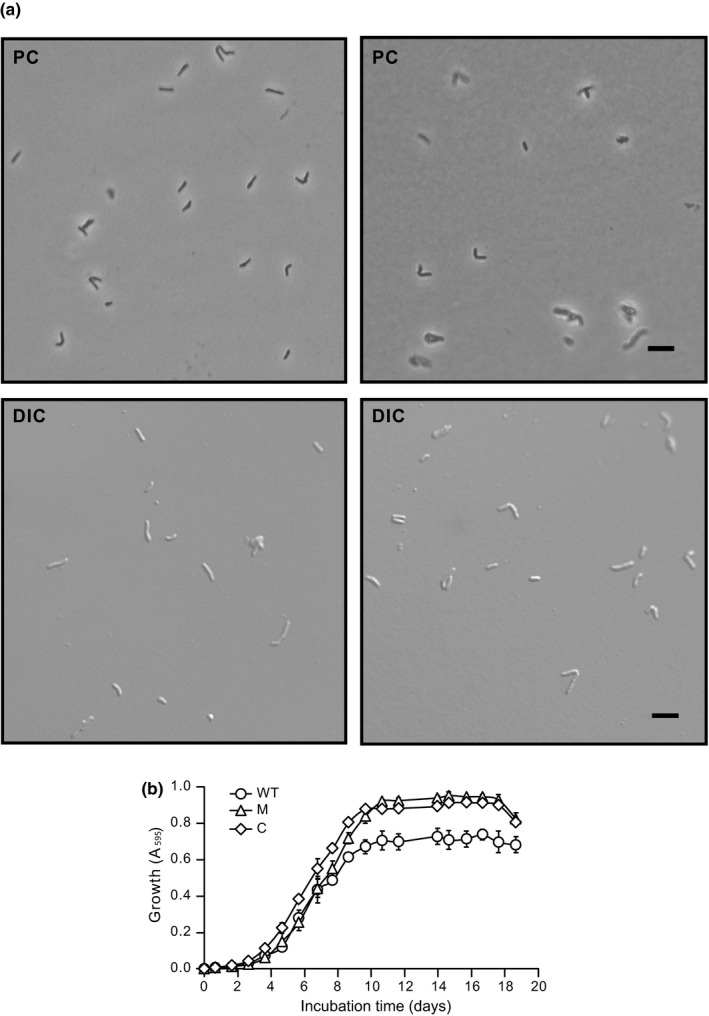
The transposon insertion in Mycobacterium kansasii 13D6 does not compromise planktonic growth, nor does it affect cell morphology. (a) Representative phase contrast (PC) and differential interference contrast (DIC) microscopy images showing cells from exponentially growing cultures of the WT (left) and mutant (right) strains. Scale bars = 5 µm. Images were acquired using a Nikon Eclipse Ti inverted microscope (Nikon Instruments Inc.) (b) Growth curves of Mk strains. WT, wt‐v; M, 13D6‐v; and C, 13D6‐c. The growth curve data were generated in a multiwell plate‐based growth assay as described in Section 2. Values of each time point represent mean ± SE of three independent growth curves
Figure A3.
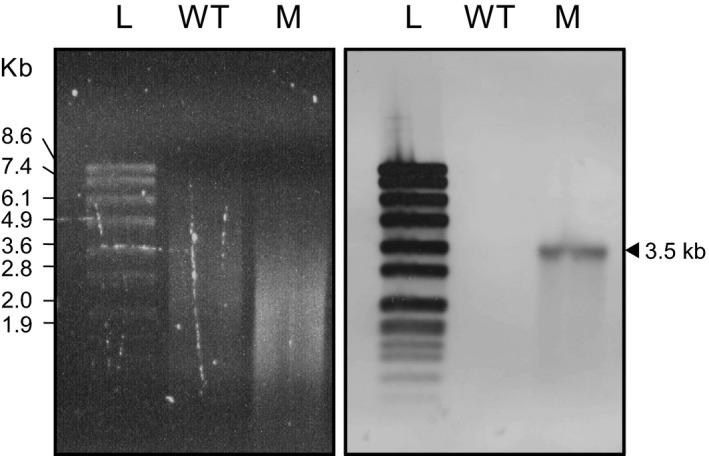
Southern blot hybridization analysis of Mycobacterium kansasii 13D6. Agarose gel electrophoresis of SacII‐digested genomic DNA (left panel) and southern blot membrane after hybridization with a Tn‐specific probe (right panel). Lanes: L, DNA molecular weight ladder; WT, WT strain; M, 13D6 mutant
Figure A4.
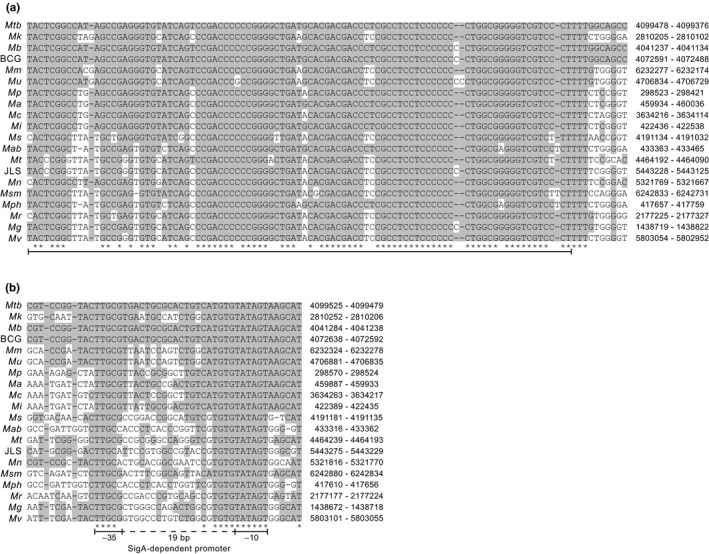
Conservation of the B11 gene locus in mycobacteria. (a) Sequence alignment of Mycobacterium tuberculosis B11, Mycobacterium kansasii B11, and predicted orthologs in other mycobacteria. (b) Sequence alignment of B11 promoter regions. Gray shading highlights identity with the Mtb sequence. Asterisks below the alignment indicate 100% conservation. The bar under the alignment of B11 orthologs marks the sequence annotated for Mtb B11. Abbreviations to the left and chromosomal coordinates to the right of the sequences correspond to the following bacteria and NCBI reference sequences, respectively. Mtb: M. tuberculosis strain H37Rv, NC_000962.3; Mk: M. kansasii strain ATCC 12478, NC_022663.1; Mb: Mycobacterium bovis strain AF2122/97, NC_002945; BCG: M. bovis BCG Pasteur 1173P2, NC_008769.1; Mm: Mycobacterium marinum strain M, NC_010612.1; Mu: Mycobacterium ulcerans strain Agy99, NC_008611.1; Mp: Mycobacterium parascrofulaceum strain ATCC BAA‐614 SCAFFOLD1, NZ_GG770553.1; Ma: Mycobacterium avium strain 104, NC_008595.1; Mc: Mycobacterium columbiense strain CECT 3035, NZ_CP020821.1; Mi: Mycobacterium intracellulare strain ATCC 13950, NC_016946.1; Ms: Mycobacterium sinense strain JDM601, NC_015576.1; Mab: Mycobacterium abscessus strain ATCC 19977, NC_010397.1; Mt: Mycobacterium thermoresistible strain NCTC10409, NZ_LT906483.1; JLS: M. sp. JLS, NC_009077.1; Mn: Mycobacterium neoaurum strain VKM Ac‐1815D, NC_023036.2; Msm: Mycobacterium smegmatis strain mc2155, NC_018289.1; Mph: Mycobacterium phlei strain NCTC8151, NZ_LR134347.1; Mr: Mycobacterium rhodesiae strain NBB3, NC_016604.1; Mg: Mycobacterium gilvium strain PYR‐GCK, NC_009338.1; and Mv: Mycobacterium vanbaalenii strain PYR‐1, NC_008726.1
Figure A5.

Mycobacteriophage L5 integration attB site in Mycobacterium kansasii. Alignment of the 62‐bp attB site in Mycobacterium smegmatis strain mc2155 (Msm, NCBI reference sequence: NC_008596.1) and the predicted attB site in M. kansasii (Mk, NCBI reference sequence: NC_022663.1). Longer bar, 43‐bp attB common core. Shorter bar, 29‐bp necessary and sufficient for attB function. Chromosomal coordinates are indicated
Figure A6.
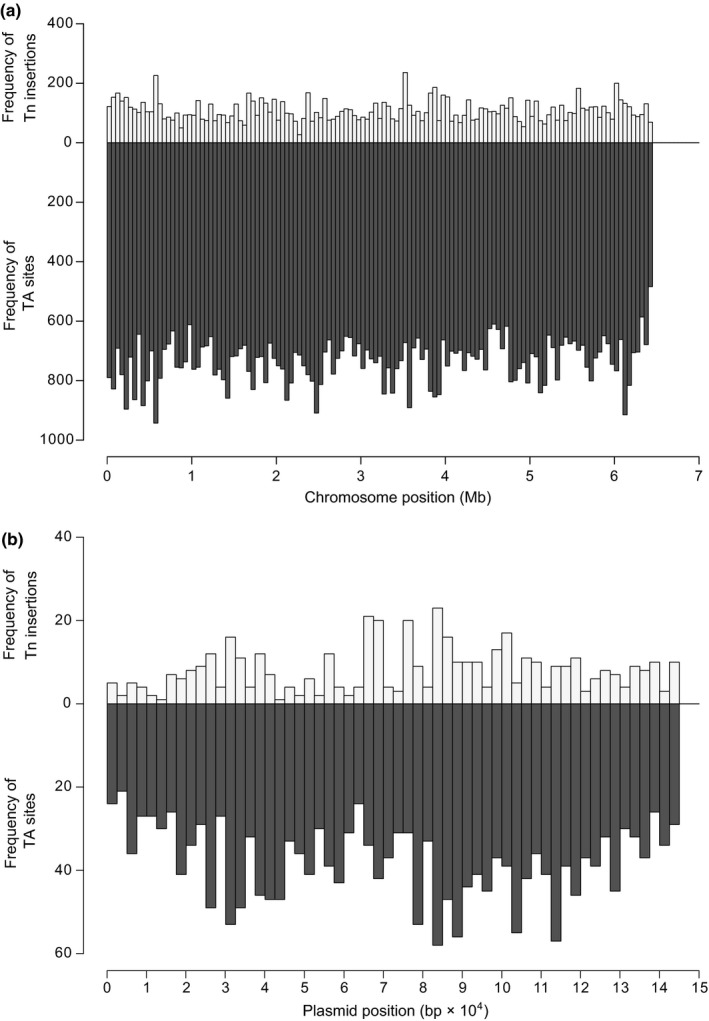
Histograms showing overviews of frequency distributions of Tn insertions and TA dinucleotide sites along the chromosome (a) and the plasmid pMK12478 (b) of Mycobacterium kansasii. The data of the Tn insertions for the chromosome and plasmid are derived from Tables S1 and S2, respectively. The data of TA dinucleotide sites for the chromosome and plasmid are derived from NCBI Reference Sequences NC_022663.1 and NC_022654.1, respectively. The data presented for the chromosome and plasmid are organized in bins of 50,000 and 2,500 bp, respectively.
APPENDIX 3.
Generation of fragment libraries for ϕMycoMarT7 transposon insertion sequencing using illumina next‐generation sequencing technology
A. Critical materials and reagents required
KAPA HyperPlus Kit (Cat. no.: KR1145, Kapa Biosystems)
Kapa Beads/SPRI (Cat. no.: KK8000, Kapa Biosystems)
Magnetic separation rack
OneTaq Hot Start DNA Polymerase (Cat. no.: M0481S, NEB)
Qubit dsDNA HS Assay Kit (Cat. no.: Q32851, Thermo Fisher Scientific)
Transposon specific primers: IS5; CB1; CB25.3_R; CCB44.3_R; barcodeseq; and SP2 (see Table A2 in Appendix 1)
Input DNA, 100–500 ng
B. Enzymatic fragmentation
-
1
Add the following components in the order noted. Keep tubes on ice.
| Component | Volume (µl) |
|---|---|
| Input DNA in water (if required to make the volume higher) | 11.7 |
| KAPA fragmentation buffer (10×) | 1.7 |
| KAPA fragmentation enzyme | 3.3 |
| Total volume | 16.7 |
-
2
Vortex gently and spin down briefly. Return the tubes to ice. Proceed immediately to the next step.
-
3
Incubate the tubes in a thermocycler for 4 min at 37°C for a DNA input of 10 ng or for 15 min at 37°C for a DNA input of 500 ng. The fragmentation target size is 350 bp.
C. End repair and A‐tailing
-
4
In the same tube in which enzymatic fragmentation was performed, assemble each end repair and A‐tailing reactions. Keep tubes on ice. (Same composition for 10 and 500 ng of DNA input.)
| Component | Volume (µl) |
|---|---|
| Fragmented DNA | 16.7 |
| End repair & A‐tailing buffer | 2.3 |
| End repair & A‐tailing enzyme mix | 1 |
| Total volume | 20 |
-
5
Vortex gently and spin down briefly. Return the reaction tubes to ice.
-
6
Incubate in a thermocycler at 65°C for 30 min. Hold at 4°C.
-
7
Proceed immediately to the next step.
D. Adapter ligation
-
8
Take 1.8 µl of a 25‐µM adapter stock tube and make the volume up with water such that the final volume is 5 µl.
-
9
In the same tube in which the end repair and A‐tailing were performed, add the following.
| Component | Volume (µl) |
|---|---|
| End repair and A‐tailing reaction product | 20 |
| Adapter stock | 5 |
| PCR‐grade water | 1.7 |
| Ligation buffer | 10 |
| DNA ligase | 3.3 |
| Total volume | 40 |
-
10
Mix thoroughly and centrifuge briefly.
-
11
Incubate at 20°C for 15 min. Proceed immediately to next step.
E. Post‐ligation cleanup
-
12
To the same tube, add the following.
| Component | Volume (µl) |
|---|---|
| Adapter ligated reaction product | 40 |
| KAPA beads | 32 |
-
13
Mix thoroughly by vortexing and pipetting up and down multiple times. Incubate for 5 min at room temperature.
-
14
Place the tube on a magnet rack and wait until the supernatant is clear. Carefully remove and discard the supernatant.
-
15
Keep the tube on the magnet rack and add 200 µl of 80% ethanol.
-
16
Carefully remove and discard the ethanol.
-
17
Repeat steps 15–16 for a total of 2 washes.
-
18
Dry the beads for 2 min to evaporate any residual ethanol.
-
19
Remove the tubes from the magnet rack and resuspend beads in 12 µl of nuclease‐free water.
-
20
Incubate the tube at room temperature for 2 min to elute DNA off the beads.
-
21
Place the tube on a magnet rack and wait for the supernatant to be clear.
-
22
Transfer the clear supernatant to a fresh tube.
F. First transposon‐specific PCR—PCR‐1
-
23
Set up and run PCR‐1 as follows.
| Reagent | Volume (µl) |
|---|---|
| OneTaq polymerase | 10 |
| PCR‐grade water | 3 |
| Primer mix: IS5 + CB1; 10 µM each | 2 |
| Library from step 22 | 5 |
| Temperature | Time | Cycles |
|---|---|---|
| 94˚C | 30 s | 1 |
| 94˚C | 15 s | 10 |
| 60˚C | 30 s | 10 |
| 68˚C | 45 s | 10 |
| 68˚C | 5 min | 1 |
| 4˚C | Hold | — |
-
24
Perform a post‐PCR cleanup. To the 20 µl PCR 1 reaction, add 14 µl of KAPA beads and mix well. Repeat steps 13–22, but elute in 15 µl of nuclease‐free water.
G. Second transposon‐specific PCR—hemi‐nested PCR‐2
-
25
Set up and run PCR‐2 as follows.
| Reagent | Volume (µl) |
|---|---|
| OneTaq polymerase | 10 |
| PCR‐grade water | 3 |
| Primer mix: IS5 + CB25.3_R or CB44.3_R; 10 µM each | 2 |
| Cleaned PCR‐1 product from step 24 | 5 |
| Temperature | Time | Cycles |
|---|---|---|
| 94˚C | 30 s | 1 |
| 94˚C | 15 s | 15 |
| 60˚C | 30 s | 15 |
| 68˚C | 45 s | 15 |
| 68˚C | 5 min | 1 |
| 4˚C | Hold | — |
H. Final library QC
-
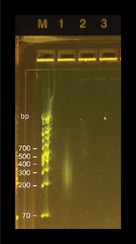
26
Analyze 3 µl of PCR‐2 reaction by agarose gel electrophoresis. When DNA of transposon mutant pools is used, a library‐like smear in the transposon enriched library should be seen. The smear should not be present for controls done with wild‐type DNA as input. See example image; lanes: M, GeneRuler 1 kb Plus DNA Ladder (Thermo Fisher Scientific); 1, sample with DNA of M. kansasii transposon mutant pool as input DNA; 2, sample with DNA of M. kansasii wild type as input DNA; 3, no DNA template PCR control.
-
27
Clean the final PCR‐2 reaction. Repeat step 24.
-
28
Using 1 µl from cleaned PCR‐2 and Qubit dsDNA HS Assay Kit, check the concentration of the library.
-
29
Use another 1 µl from cleaned PCR‐2 to verify for the library size on the Agilent Bioanalyzer.
-
30
The final library is then sequenced as described in the Materials and Methods section of the manuscript proper.
Budell WC, Germain GA, Janisch N, et al. Transposon mutagenesis in Mycobacterium kansasii links a small RNA gene to colony morphology and biofilm formation and identifies 9,885 intragenic insertions that do not compromise colony outgrowth. MicrobiologyOpen. 2020;9:e988 10.1002/mbo3.988
DATA AVAILABILITY STATEMENT
All data are provided in full in this paper with the exception of the data in Table S1 (Location of intragenic and intergenic transposon insertion sites in the chromosome of M. kansasii) and Table S2 (Location of intragenic and intergenic transposon insertion sites in the plasmid pMK12478 of M. kansasii), which are available in the Zenodo repository at https://doi.org/10.5281/zenodo.3561175.
REFERENCES
- Aldridge, B. B. , Keren, I. , & Fortune, S. M. (2014). The spectrum of drug susceptibility in mycobacteria. Microbiology Spectrum, 2(5), MGM2-0031-2013. 10.1128/microbiolspec.MGM2-0031-2013 [DOI] [PubMed] [Google Scholar]
- Arnvig, K. B. , Cortes, T. , & Young, D. B. (2014). Noncoding RNA in mycobacteria. Microbiology Spectrum, 2(2), MGM2-0029-2013. 10.1128/microbiolspec.MGM2-0029-2013 [DOI] [PubMed] [Google Scholar]
- Arnvig, K. B. , & Young, D. B. (2009). Identification of small RNAs in Mycobacterium tuberculosis . Molecular Microbiology, 73(3), 397–408. 10.1111/j.1365-2958.2009.06777.x [DOI] [PMC free article] [PubMed] [Google Scholar]
- Bakula, Z. , Safianowska, A. , Nowacka‐Mazurek, M. , Bielecki, J. , & Jagielski, T. (2013). Short communication: Subtyping of Mycobacterium kansasii by PCR‐restriction enzyme analysis of the hsp65 gene. BioMed Research International, 2013, 178725 10.1155/2013/178725 [DOI] [PMC free article] [PubMed] [Google Scholar]
- Bardarov, S. , Kriakov, J. , Carriere, C. , Yu, S. , Vaamonde, C. , McAdam, R. A. , … Jacobs, W. R. (1997). Conditionally replicating mycobacteriophages: A system for transposon delivery to Mycobacterium tuberculosis . Proceedings of the National Academy of Sciences of the United States of America, 94(20), 10961–10966. 10.1073/pnas.94.20.10961 [DOI] [PMC free article] [PubMed] [Google Scholar]
- Belisle, J. T. , & Brennan, P. J. (1989). Chemical basis of rough and smooth variation in mycobacteria. Journal of Bacteriology, 171(6), 3465–3470. 10.1128/jb.171.6.3465-3470.1989 [DOI] [PMC free article] [PubMed] [Google Scholar]
- Brown‐Elliott, B. A. , Nash, K. A. , & Wallace, R. J. Jr (2012). Antimicrobial susceptibility testing, drug resistance mechanisms, and therapy of infections with nontuberculous mycobacteria. Clinical Microbiology Reviews, 25(3), 545–582. 10.1128/CMR.05030-11 [DOI] [PMC free article] [PubMed] [Google Scholar]
- Chakraborty, P. , & Kumar, A. (2019). The extracellular matrix of mycobacterial biofilms: Could we shorten the treatment of mycobacterial infections? Microbial Cell, 6(2), 105–122. 10.15698/mic2019.02.667 [DOI] [PMC free article] [PubMed] [Google Scholar]
- Chapelais‐Baron, M. , Goubet, I. , Peteri, R. , Pereira, M. F. , Mignot, T. , Jabveneau, A. , & Rosenfeld, E. (2018). Colony analysis and deep learning uncover 5‐hydroxyindole as an inhibitor of gliding motility and iridescence in Cellulophaga lytica . Microbiology, 164(3), 308–321. 10.1099/mic.0.000617 [DOI] [PubMed] [Google Scholar]
- Chavadi, S. S. , Edupuganti, U. R. , Vergnolle, O. , Fatima, I. , Singh, S. M. , Soll, C. E. , & Quadri, L. E. (2011). Inactivation of tesA reduces cell‐wall lipid production and increases drug susceptibility in mycobacteria. Journal of Biological Chemistry, 286, 24616–24625. [DOI] [PMC free article] [PubMed] [Google Scholar]
- Chavadi, S. S. , Stirrett, K. L. , Edupuganti, U. R. , Vergnolle, O. , Sadhanandan, G. , Marchiano, E. , … Quadri, L. E. N. (2011). Mutational and phylogenetic analyses of the mycobacterial mbt gene cluster. Journal of Bacteriology, 193(21), 5905–5913. 10.1128/JB.05811-11 [DOI] [PMC free article] [PubMed] [Google Scholar]
- Cole, S. T. , Brosch, R. , Parkhill, J. , Garnier, T. , Churcher, C. , Harris, D. , … Barrell, B. G. (1998). Deciphering the biology of Mycobacterium tuberculosis from the complete genome sequence. Nature, 393(6685), 537–544. 10.1038/31159 [DOI] [PubMed] [Google Scholar]
- Daley, C. L. , & Griffith, D. E. (2010). Pulmonary non‐tuberculous mycobacterial infections. International Journal of Tuberculosis and Lung Disease, 14(6), 665–671. [PubMed] [Google Scholar]
- Dalton, J. P. , Uy, B. , Swift, S. , & Wiles, S. (2017). A novel restraint device for injection of Galleria mellonella larvae that minimizes the risk of accidental operator needle stick injury. Frontiers in Cellular and Infection Microbiology, 7, 99 10.3389/fcimb.2017.00099 [DOI] [PMC free article] [PubMed] [Google Scholar]
- Davies, B. S. , Roberts, C. H. , Kaul, S. , Klein, J. L. , & Milburn, H. J. (2012). Non‐tuberculous slow‐growing mycobacterial pulmonary infections in non‐HIV‐infected patients in south London. Scandinavian Journal of Infectious Diseases, 44(11), 815–819. 10.3109/00365548.2012.694469 [DOI] [PubMed] [Google Scholar]
- DeJesus, M. A. , Ambadipudi, C. , Baker, R. , Sassetti, C. , & Ioerger, T. R. (2015). TRANSIT – A software tool for Himar1 TnSeq analysis. PLoS Computational Biology, 11(10), e1004401 10.1371/journal.pcbi.1004401 [DOI] [PMC free article] [PubMed] [Google Scholar]
- DeJesus, M. A. , Gerrick, E. R. , Xu, W. , Park, S. W. , Long, J. E. , Boutte, C. C. , … Ioerger, T. R. (2017). Comprehensive essentiality analysis of the Mycobacterium tuberculosis genome via saturating transposon mutagenesis. Mbio, 8(1), e02133-16 10.1128/mBio.02133-16 [DOI] [PMC free article] [PubMed] [Google Scholar]
- DeJesus, M. A. , & Ioerger, T. R. (2013). A Hidden Markov Model for identifying essential and growth‐defect regions in bacterial genomes from transposon insertion sequencing data. BMC Bioinformatics, 14, 303 10.1186/1471-2105-14-303 [DOI] [PMC free article] [PubMed] [Google Scholar]
- DeJesus, M. A. , Zhang, Y. J. , Sassetti, C. M. , Rubin, E. J. , Sacchettini, J. C. , & Ioerger, T. R. (2013). Bayesian analysis of gene essentiality based on sequencing of transposon insertion libraries. Bioinformatics, 29, 695–703. 10.1093/bioinformatics/btt043 [DOI] [PMC free article] [PubMed] [Google Scholar]
- DiChiara, J. M. , Contreras‐Martinez, L. M. , Livny, J. , Smith, D. , McDonough, K. A. , & Belfort, M. (2010). Multiple small RNAs identified in Mycobacterium bovis BCG are also expressed in Mycobacterium tuberculosis and Mycobacterium smegmatis . Nucleic Acids Research, 38(12), 4067–4078. 10.1093/nar/gkq101 [DOI] [PMC free article] [PubMed] [Google Scholar]
- Driessen, N. N. , Stoop, E. J. M. , Ummels, R. , Gurcha, S. S. , Mishra, A. K. , Larrouy‐Maumus, G. , … Appelmelk, B. J. (2010). Mycobacterium marinum MMAR_2380, a predicted transmembrane acyltransferase, is essential for the presence of the mannose cap on lipoarabinomannan. Microbiology, 156(Pt 11), 3492–3502. 10.1099/mic.0.037507-0 [DOI] [PMC free article] [PubMed] [Google Scholar]
- Dubnau, E. , Fontan, P. , Manganelli, R. , Soares‐Appel, S. , & Smith, I. (2002). Mycobacterium tuberculosis genes induced during infection of human macrophages. Infection and Immunity, 70(6), 2787–2795. [DOI] [PMC free article] [PubMed] [Google Scholar]
- Ehsani, L. , Reddy, S. C. , Mosunjac, M. , Kraft, C. S. , & Guarner, J. (2015). Fatal aortic pseudoaneurysm from disseminated Mycobacterium kansasii infection: Case report. Human Pathology, 46(3), 467–470. 10.1016/j.humpath.2014.11.005 [DOI] [PubMed] [Google Scholar]
- Entwistle, F. M. , & Coote, P. J. (2018). Evaluation of greater wax moth larvae, Galleria mellonella, as a novel in vivo model for non‐tuberculosis mycobacteria infections and antibiotic treatments. Journal of Medical Microbiology, 67(4), 585–597. 10.1099/jmm.0.000696 [DOI] [PubMed] [Google Scholar]
- Evans, A. J. , Crisp, A. J. , Hubbard, R. B. , Colville, A. , Evans, S. A. , & Johnston, I. D. (1996). Pulmonary Mycobacterium kansasii infection: Comparison of radiological appearances with pulmonary tuberculosis. Thorax, 51(12), 1243–1247. 10.1136/thx.51.12.1243 [DOI] [PMC free article] [PubMed] [Google Scholar]
- Fan, P. D. , Narzisi, G. , Jayaprakash, A. D. , Venturini, E. , Robine, N. , Smibert, P. , … Ladanyi, M. (2018). YES1 amplification is a mechanism of acquired resistance to EGFR inhibitors identified by transposon mutagenesis and clinical genomics. Proceedings of the National Academy of Sciences of the United States of America, 115(26), E6030–E6038. 10.1073/pnas.1717782115 [DOI] [PMC free article] [PubMed] [Google Scholar]
- Flor, A. , Capdevila, J. A. , Martin, N. , Gavalda, J. , & Pahissa, A. (1996). Nontuberculous mycobacterial meningitis: Report of two cases and review. Clinical Infectious Diseases, 23(6), 1266–1273. 10.1093/clinids/23.6.1266 [DOI] [PubMed] [Google Scholar]
- Griffin, J. E. , Gawronski, J. D. , Dejesus, M. A. , Ioerger, T. R. , Akerley, B. J. , & Sassetti, C. M. (2011). High‐resolution phenotypic profiling defines genes essential for mycobacterial growth and cholesterol catabolism. PLoS Pathogens, 7(9), e1002251 10.1371/journal.ppat.1002251 [DOI] [PMC free article] [PubMed] [Google Scholar]
- Griffith, D. E. , Aksamit, T. , Brown‐Elliott, B. A. , Catanzaro, A. , Daley, C. , Gordin, F. , … Winthrop, K. (2007). An official ATS/IDSA statement: Diagnosis, treatment, and prevention of nontuberculous mycobacterial diseases. American Journal of Respiratory and Critical Care Medicine, 175(4), 367–416. 10.1164/rccm.200604-571ST [DOI] [PubMed] [Google Scholar]
- Henkle, E. , & Winthrop, K. L. (2015). Nontuberculous mycobacteria infections in immunosuppressed hosts. Clinics in Chest Medicine, 36(1), 91–99. 10.1016/j.ccm.2014.11.002 [DOI] [PMC free article] [PubMed] [Google Scholar]
- Hirashima, T. , Nagai, T. , Shigeoka, H. , Tamura, Y. , Yoshida, H. , Kawahara, K. , … Kawase, I. (2014). Comparison of the clinical courses and chemotherapy outcomes in metastatic colorectal cancer patients with and without active Mycobacterium tuberculosis or Mycobacterium kansasii infection: A retrospective study. BMC Cancer, 14, 770 10.1186/1471-2407-14-770 [DOI] [PMC free article] [PubMed] [Google Scholar]
- Hoefsloot, W. , van Ingen, J. , Andrejak, C. , Ängeby, K. , Bauriaud, R. , Bemer, P. , … Wagner, D. (2013). The geographic diversity of nontuberculous mycobacteria isolated from pulmonary samples: An NTM‐NET collaborative study. European Respiratory Journal, 42(6), 1604–1613. 10.1183/09031936.00149212 [DOI] [PubMed] [Google Scholar]
- Huff, J. , Czyz, A. , Landick, R. , & Niederweis, M. (2010). Taking phage integration to the next level as a genetic tool for mycobacteria. Gene, 468(1–2), 8–19. 10.1016/j.gene.2010.07.012 [DOI] [PMC free article] [PubMed] [Google Scholar]
- Johnston, J. C. , & Elwood, K. (2011). Mycobacterium kansasii In Schlossberg D. (Ed.), Tuberculosis and nontuberculous mycobacterial infections (6th ed., pp. 578–585). Washington, DC: ASM Press. [Google Scholar]
- Kempes, C. P. , Okegbe, C. , Mears‐Clarke, Z. , Follows, M. J. , & Dietrich, L. E. (2014). Morphological optimization for access to dual oxidants in biofilms. Proceedings of the National Academy of Sciences of the United States of America, 111(1), 208–213. 10.1073/pnas.1315521110 [DOI] [PMC free article] [PubMed] [Google Scholar]
- Kendall, B. A. , & Winthrop, K. L. (2013). Update on the epidemiology of pulmonary nontuberculous mycobacterial infections. Seminars in Respiratory and Critical Care Medicine, 34(1), 87–94. 10.1055/s-0033-1333567 [DOI] [PubMed] [Google Scholar]
- Klein, J. L. , Brown, T. J. , & French, G. L. (2001). Rifampin resistance in Mycobacterium kansasii is associated with rpoB mutations. Antimicrobial Agents and Chemotherapy, 45(11), 3056–3058. 10.1128/AAC.45.11.3056-3058.2001 [DOI] [PMC free article] [PubMed] [Google Scholar]
- Kwenda, G. , Churchyard, G. J. , Thorrold, C. , Heron, I. , Stevenson, K. , Duse, A. G. , & Marais, E. (2015). Molecular characterisation of clinical and environmental isolates of Mycobacterium kansasii isolates from South African gold mines. Journal of Water and Health, 13(1), 190–202. 10.2166/wh.2014.161 [DOI] [PubMed] [Google Scholar]
- Lamichhane, G. , Arnvig, K. B. , & McDonough, K. A. (2013). Definition and annotation of (myco)bacterial non‐coding RNA. Tuberculosis (Edinburgh, Scotland), 93(1), 26–29. 10.1016/j.tube.2012.11.010 [DOI] [PubMed] [Google Scholar]
- Langridge, G. C. , Phan, M.‐D. , Turner, D. J. , Perkins, T. T. , Parts, L. , Haase, J. , … Turner, A. K. (2009). Simultaneous assay of every Salmonella Typhi gene using one million transposon mutants. Genome Research, 19(12), 2308–2316. 10.1101/gr.097097.109 [DOI] [PMC free article] [PubMed] [Google Scholar]
- Lee, M. H. , Pascopella, L. , Jacobs, W. R. Jr , & Hatfull, G. F. (1991). Site‐specific integration of mycobacteriophage L5: Integration‐proficient vectors for Mycobacterium smegmatis, Mycobacterium tuberculosis, and bacille Calmette‐Guérin. Proceedings of the National Academy of Sciences of the United States of America, 88(8), 3111–3115. 10.1073/pnas.88.8.3111 [DOI] [PMC free article] [PubMed] [Google Scholar]
- Li, Y. , Spiropoulos, J. , Cooley, W. , Khara, J. S. , Gladstone, C. A. , Asai, M. , … Langford, P. R. (2018). Galleria mellonella – A novel infection model for the Mycobacterium tuberculosis complex. Virulence, 9(1), 1126–1137. 10.1080/21505594.2018.1491255 [DOI] [PMC free article] [PubMed] [Google Scholar]
- Livak, K. J. , & Schmittgen, T. D. (2001). Analysis of relative gene expression data using real‐time quantitative PCR and the 2(‐Delta Delta C(T)) Method. Methods, 25(4), 402–408. 10.1006/meth.2001.1262 [DOI] [PubMed] [Google Scholar]
- Long, J. E. , DeJesus, M. , Ward, D. , Baker, R. E. , Ioerger, T. , & Sassetti, C. M. (2015). Identifying essential genes in Mycobacterium tuberculosis by global phenotypic profiling. Methods in Molecular Biology, 1279, 79–95. 10.1007/978-1-4939-2398-4_6 [DOI] [PubMed] [Google Scholar]
- Lyons, J. , Vandenberghe, E. , Fahy, R. , McDonnell, C. , Keane, J. , & McLaughlin, A. M. (2014). An unusual lung mass post stem cell transplantation. Transplant Infectious Disease, 16(4), 672–675. 10.1111/tid.12257 [DOI] [PubMed] [Google Scholar]
- Mai, J. , Rao, C. , Watt, J. , Sun, X. , Lin, C. , Zhang, L. , & Liu, J. (2019). Mycobacterium tuberculosis 6C sRNA binds multiple mRNA targets via C‐rich loops independent of RNA chaperones. Nucleic Acids Research, 47(8), 4292–4307. 10.1093/nar/gkz149 [DOI] [PMC free article] [PubMed] [Google Scholar]
- Maliwan, N. , & Zvetina, J. R. (2005). Clinical features and follow up of 302 patients with Mycobacterium kansasii pulmonary infection: A 50 year experience. Postgraduate Medical Journal, 81(958), 530–533. 10.1136/pgmj.2004.026229 [DOI] [PMC free article] [PubMed] [Google Scholar]
- Meir, M. , Grosfeld, T. , & Barkan, D. (2018). Establishment and validation of Galleria mellonella as a novel model organism to study Mycobacterium abscessus Infection, pathogenesis, and treatment. Antimicrobial Agents and Chemotherapy, 62(4), e2539-17 10.1128/AAC.02539-17 [DOI] [PMC free article] [PubMed] [Google Scholar]
- Minnikin, D. E. , Lee, O. Y. , Wu, H. H. , Besra, G. S. , Bhatt, A. , Nataraj, V. , … Donoghue, H. D. (2015). Ancient mycobacterial lipids: Key reference biomarkers in charting the evolution of tuberculosis. Tuberculosis (Edinburgh, Scotland), 95(Suppl 1), S133–S139. 10.1016/j.tube.2015.02.009 [DOI] [PubMed] [Google Scholar]
- Mirsaeidi, M. , Farshidpour, M. , Allen, M. B. , Ebrahimi, G. , & Falkinham, J. O. (2014). Highlight on advances in nontuberculous mycobacterial disease in North America. BioMed Research International, 2014, 1–10. 10.1155/2014/919474 [DOI] [PMC free article] [PubMed] [Google Scholar]
- Mohandas, P. , Budell, W. C. , Mueller, E. , Au, A. , Bythrow, G. V. , & Quadri, L. E. (2016). Pleiotropic consequences of gene knockouts in the phthiocerol dimycocerosate and phenolic glycolipid biosynthetic gene cluster of the opportunistic human pathogen Mycobacterium marinum . FEMS Microbiology Letters, 363, fnw016 10.1093/femsle/fnw016 [DOI] [PMC free article] [PubMed] [Google Scholar]
- Nataraj, V. , Pang, P.‐C. , Haslam, S. M. , Veerapen, N. , Minnikin, D. E. , Dell, A. , … Bhatt, A. (2015). MKAN27435 is required for the biosynthesis of higher subclasses of lipooligosaccharides in Mycobacterium kansasii . PLoS ONE, 10(3), e0122804 10.1371/journal.pone.0122804 [DOI] [PMC free article] [PubMed] [Google Scholar]
- Onwueme, K. C. , Vos, C. J. , Zurita, J. , Soll, C. E. , & Quadri, L. E. (2005). Identification of phthiodiolone ketoreductase, an enzyme required for production of mycobacterial diacyl phthiocerol virulence factors. Journal of Bacteriology, 187(14), 4760–4766. 10.1128/jb.187.14.4760-4766.2005 [DOI] [PMC free article] [PubMed] [Google Scholar]
- Philley, J. V. , & Griffith, D. E. (2015). Treatment of slowly growing mycobacteria. Clinics in Chest Medicine, 36(1), 79–90. 10.1016/j.ccm.2014.10.005 [DOI] [PubMed] [Google Scholar]
- Picardeau, M. , Prod'Hom, G. , Raskine, L. , LePennec, M. P. , & Vincent, V. (1997). Genotypic characterization of five subspecies of Mycobacterium kansasii . Journal of Clinical Microbiology, 35(1), 25–32. [DOI] [PMC free article] [PubMed] [Google Scholar]
- Prevots, D. R. , & Marras, T. K. (2015). Epidemiology of human pulmonary infection with nontuberculous mycobacteria: A review. Clinics in Chest Medicine, 36(1), 13–34. 10.1016/j.ccm.2014.10.002 [DOI] [PMC free article] [PubMed] [Google Scholar]
- Quadri, L. E. , Sailer, M. , Roy, K. L. , Vederas, J. C. , & Stiles, M. E. (1994). Chemical and genetic characterization of bacteriocins produced by Carnobacterium piscicola LV17B. Journal of Biological Chemistry, 269(16), 12204–12211. [PubMed] [Google Scholar]
- Ren, H. , Dover, L. G. , Islam, S. T. , Alexander, D. C. , Chen, J. M. , Besra, G. S. , & Liu, J. (2007). Identification of the lipooligosaccharide biosynthetic gene cluster from Mycobacterium marinum . Molecular Microbiology, 63(5), 1345–1359. 10.1111/j.1365-2958.2007.05603.x [DOI] [PubMed] [Google Scholar]
- Ricketts, W. M. , O'Shaughnessy, T. C. , & van Ingen, J. (2014). Human‐to‐human transmission of Mycobacterium kansasii or victims of a shared source? European Respiratory Journal, 44(4), 1085–1087. 10.1183/09031936.00066614 [DOI] [PubMed] [Google Scholar]
- Rubin, E. J. , Akerley, B. J. , Novik, V. N. , Lampe, D. J. , Husson, R. N. , & Mekalanos, J. J. (1999). In vivo transposition of mariner‐based elements in enteric bacteria and mycobacteria. Proceedings of the National Academy of Sciences of the United States of America, 96(4), 1645–1650. 10.1073/pnas.96.4.1645 [DOI] [PMC free article] [PubMed] [Google Scholar]
- Rwegasila, E. , Mubofu, E. B. , Nyandoro, S. S. , Erasto, P. , & Munissi, J. J. (2016). Preparation, characterization and in vivo antimycobacterial studies of panchovillin‐chitosan nanocomposites. International Journal of Molecular Sciences, 17(10), 1559 10.3390/ijms17101559 [DOI] [PMC free article] [PubMed] [Google Scholar]
- Rybniker, J. , Kramme, S. , & Small, P. L. (2006). Host range of 14 mycobacteriophages in Mycobacterium ulcerans and seven other mycobacteria including Mycobacterium tuberculosis – Application for identification and susceptibility testing. Journal of Medical Microbiology, 55(Pt 1), 37–42. 10.1099/jmm.0.46238-0 [DOI] [PubMed] [Google Scholar]
- Sambrook, J. F. , & Russell, D. W. (2001). Molecular cloning: A laboratory manual (3rd ed.). Cold Spring Harbour, NY: Cold Spring Harbour Laboratory Press. [Google Scholar]
- Santin, M. , Dorca, J. , Alcaide, F. , Gonzalez, L. , Casas, S. , Lopez, M. , & Guerra, M. R. (2009). Long‐term relapses after 12‐month treatment for Mycobacterium kansasii lung disease. European Respiratory Journal, 33(1), 148–152. 10.1183/09031936.00024008 [DOI] [PubMed] [Google Scholar]
- Sassetti, C. M. , Boyd, D. H. , & Rubin, E. J. (2001). Comprehensive identification of conditionally essential genes in mycobacteria. Proceedings of the National Academy of Sciences of the United States of America, 98(22), 12712–12717. 10.1073/pnas.231275498 [DOI] [PMC free article] [PubMed] [Google Scholar]
- Siegrist, M. S. , & Rubin, E. J. (2009). Phage transposon mutagenesis. Methods in Molecular Biology, 465, 311–323. 10.1007/978-1-59745-207-6_21 [DOI] [PubMed] [Google Scholar]
- Sun, Z. , & Zhang, Y. (1999). Reduced pyrazinamidase activity and the natural resistance of Mycobacterium kansasii to the antituberculosis drug pyrazinamide. Antimicrobial Agents and Chemotherapy, 43(3), 537–542. [DOI] [PMC free article] [PubMed] [Google Scholar]
- Taillard, C. , Greub, G. , Weber, R. , Pfyffer, G. E. , Bodmer, T. , Zimmerli, S. , … Prod'hom, G. (2003). Clinical implications of Mycobacterium kansasii species heterogeneity: Swiss National Survey. Journal of Clinical Microbiology, 41(3), 1240–1244. 10.1128/JCM.41.3.1240-1244.2003 [DOI] [PMC free article] [PubMed] [Google Scholar]
- Tatham, E. , Chavadi, S. , Mohandas, P. , Edupuganti, U. , Angala, S. , Chatterjee, D. , & Quadri, L. E. (2012). Production of mycobacterial cell wall glycopeptidolipids requires a member of the MbtH‐like protein family. BMC Microbiology, 12(1), 118 10.1186/1471-2180-12-118 [DOI] [PMC free article] [PubMed] [Google Scholar]
- Tortoli, E. (2003). Mycobacterium kansasii, species or complex? Biomolecular and epidemiological insights. Kekkaku, 78(11), 705–709. [PubMed] [Google Scholar]
- Tsai, C. J. , Loh, J. M. , & Proft, T. (2016). Galleria mellonella infection models for the study of bacterial diseases and for antimicrobial drug testing. Virulence, 7(3), 214–229. 10.1080/21505594.2015.1135289 [DOI] [PMC free article] [PubMed] [Google Scholar]
- Vaerewijck, M. J. , Huys, G. , Palomino, J. C. , Swings, J. , & Portaels, F. (2005). Mycobacteria in drinking water distribution systems: Ecology and significance for human health. FEMS Microbiology Reviews, 29(5), 911–934. 10.1016/j.femsre.2005.02.001 [DOI] [PubMed] [Google Scholar]
- van Opijnen, T. , & Camilli, A. (2013). Transposon insertion sequencing: A new tool for systems‐level analysis of microorganisms. Nature Reviews Microbiology, 11(7), 435–442. 10.1038/nrmicro3033 [DOI] [PMC free article] [PubMed] [Google Scholar]
- Veyrier, F. , Pletzer, D. , Turenne, C. , & Behr, M. A. (2009). Phylogenetic detection of horizontal gene transfer during the step‐wise genesis of Mycobacterium tuberculosis . BMC Evolutionary Biology, 9, 196 10.1186/1471-2148-9-196 [DOI] [PMC free article] [PubMed] [Google Scholar]
- Wang, H. X. , Yue, J. , Han, M. , Yang, J. H. , Gao, R. L. , Jing, L. J. , … Zhao, Y. L. (2010). Nontuberculous mycobacteria: Susceptibility pattern and prevalence rate in Shanghai from 2005 to 2008. Chinese Medical Journal, 123(2), 184–187. [PubMed] [Google Scholar]
- Wang, J. , McIntosh, F. , Radomski, N. , Dewar, K. , Simeone, R. , Enninga, J. , … Behr, M. A. (2015). Insights on the emergence of Mycobacterium tuberculosis from the analysis of Mycobacterium kansasii . Genome Biology and Evolution, 7(3), 856–870. 10.1093/gbe/evv035 [DOI] [PMC free article] [PubMed] [Google Scholar]
- Wang, J. , Pritchard, J. R. , Kreitmann, L. , Montpetit, A. , & Behr, M. A. (2014). Disruption of Mycobacterium avium subsp. paratuberculosis‐specific genes impairs in vivo fitness. BMC Genomics, 15, 415 10.1186/1471-2164-15-415 [DOI] [PMC free article] [PubMed] [Google Scholar]
- Weinberg, Z. , Barrick, J. E. , Yao, Z. , Roth, A. , Kim, J. N. , Gore, J. , … Breaker, R. R. (2007). Identification of 22 candidate structured RNAs in bacteria using the CMfinder comparative genomics pipeline. Nucleic Acids Research, 35(14), 4809–4819. 10.1093/nar/gkm487 [DOI] [PMC free article] [PubMed] [Google Scholar]
- Wu, T.‐S. , Leu, H.‐S. , Chiu, C.‐H. , Lee, M.‐H. , Chiang, P.‐C. , Wu, T.‐L. , … Lai, H.‐C. (2009). Clinical manifestations, antibiotic susceptibility and molecular analysis of Mycobacterium kansasii isolates from a university hospital in Taiwan. Journal of Antimicrobial Chemotherapy, 64(3), 511–514. 10.1093/jac/dkp238 [DOI] [PubMed] [Google Scholar]
- Yamada, H. , Kohyama, T. , Terashi, K. , Mori, H. , Yamaguchi, A. , Arima, N. , & Tanaka, H. (1997). Fatal pulmonary infection due to multidrug‐resistant Mycobacterium kansasii which developed in an immunocompetent young man. Internal Medicine, 36(4), 298–300. 10.2169/internalmedicine.36.298 [DOI] [PubMed] [Google Scholar]
- Yu, J. , Tran, V. , Li, M. , Huang, X. , Niu, C. , Wang, D. , … Liu, J. (2012). Both phthiocerol dimycocerosates and phenolic glycolipids are required for virulence of Mycobacterium marinum . Infection and Immunity, 80(4), 1381–1389. 10.1128/iai.06370-11 [DOI] [PMC free article] [PubMed] [Google Scholar]
- Zhang, Y. J. , Ioerger, T. R. , Huttenhower, C. , Long, J. E. , Sassetti, C. M. , Sacchettini, J. C. , & Rubin, E. J. (2012). Global assessment of genomic regions required for growth in Mycobacterium tuberculosis . PLoS Pathogens, 8(9), e1002946 10.1371/journal.ppat.1002946 [DOI] [PMC free article] [PubMed] [Google Scholar]
- Zuker, M. (2003). Mfold web server for nucleic acid folding and hybridization prediction. Nucleic Acids Research, 31(13), 3406–3415. 10.1093/nar/gkg595 [DOI] [PMC free article] [PubMed] [Google Scholar]
Associated Data
This section collects any data citations, data availability statements, or supplementary materials included in this article.
Data Availability Statement
All data are provided in full in this paper with the exception of the data in Table S1 (Location of intragenic and intergenic transposon insertion sites in the chromosome of M. kansasii) and Table S2 (Location of intragenic and intergenic transposon insertion sites in the plasmid pMK12478 of M. kansasii), which are available in the Zenodo repository at https://doi.org/10.5281/zenodo.3561175.