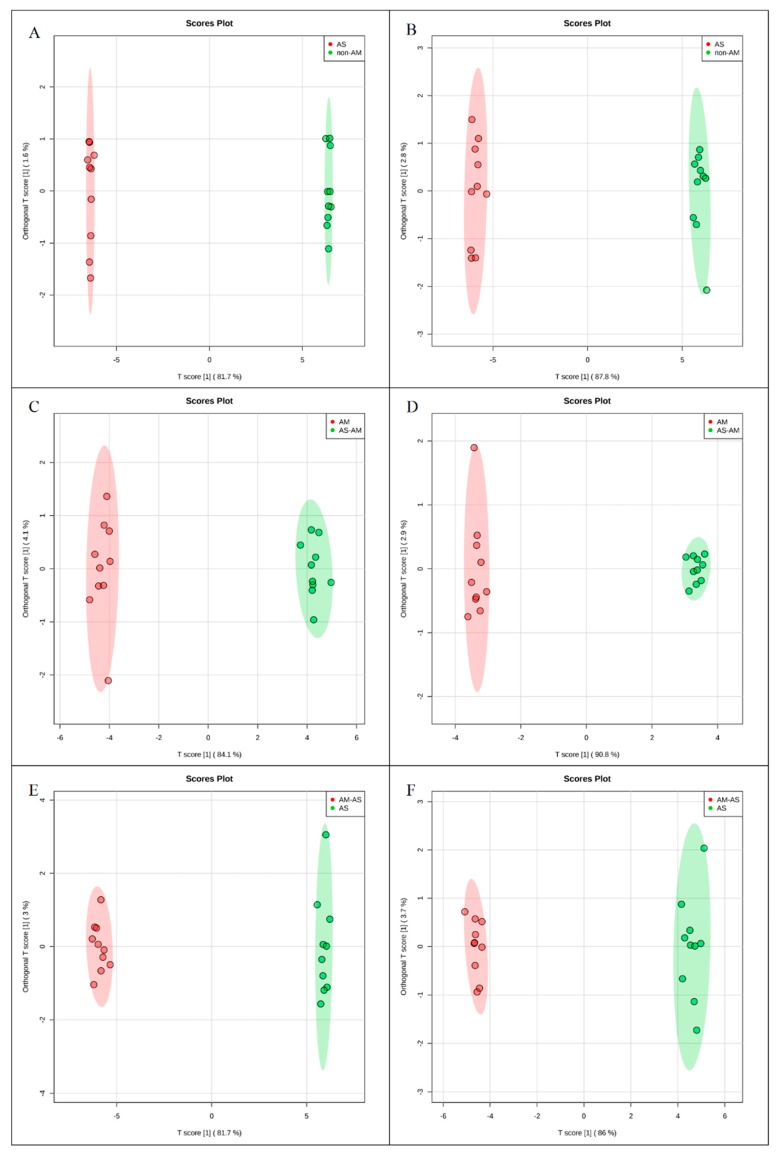
Figure 3.
Orthogonal projections to latent structures-discriminate analysis (OPLS-DA) score plots of metabolic profiles in non-AM seedlings in response to alkali stress (A,B), AM seedlings in response to alkali stress (C,D) and comparison in non-AM seedlings and AM seedlings under alkali stress (E,F) in positive (A,C,E) and negative modes (B,D,F).

