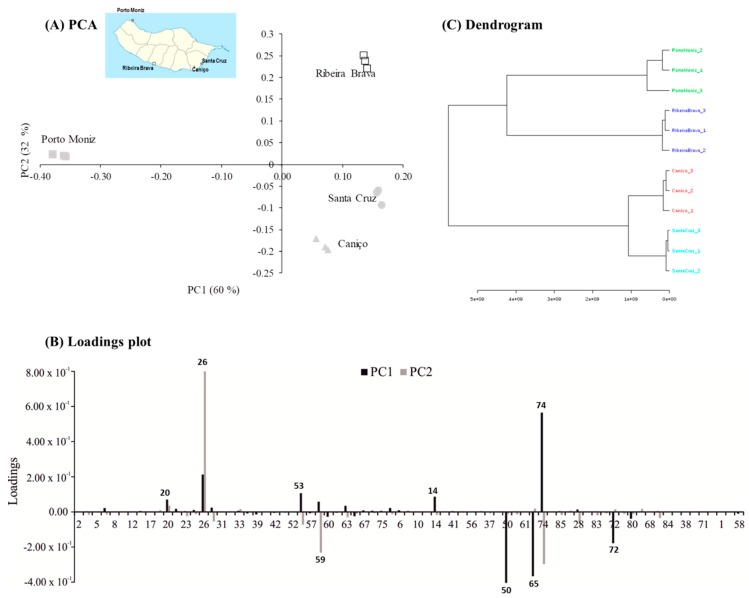
Figure 3.
(A) Principal Component Analysis (PCA). First principal component (PC1) × second principal component (PC2) of scores scatter plot of Allium cepa L. according to geographical regions; (B) loading plot of the main source of variability between volatile profile and Allium cepa L. (attribution of the peak number shown in Table 2); (C) dendrogram of a cluster analysis in onions from four regions of Madeira Island (distance measure using Euclidean and clustering algorithm using ward).

