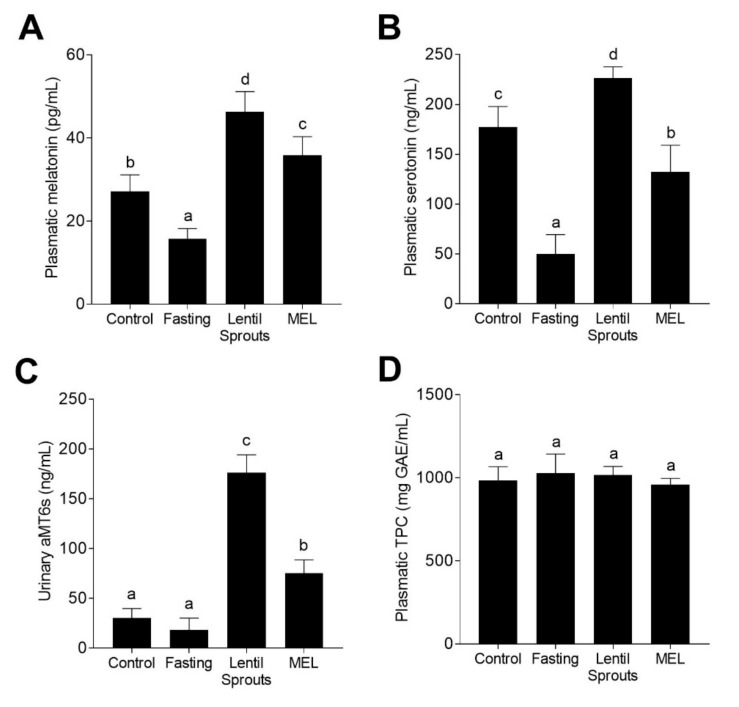
Figure 4.
The concentration of melatonin (A), serotonin (B), 6-sulfatoxymelatonin (aMT6s) (C), and TPC (D) in the plasma and urine samples followed the four experimental conditions (Control, Fasting, Lentil Sprouts, and MEL). The results are expressed as mean ± SD (n = 10). Bars with different letters significantly (p < 0.05) differ according to ANOVA and Tukey’s multiple range test.

