Abstract
The micro-arc oxidation/graphene oxide (MAO/GO) composite coatings were successfully prepared on the surface of magnesium alloys by the MAO and electrodeposition technologies. The morphology and composition of the MAO/GO composite coatings were characterized by scanning electron microscopy, energy-dispersive spectrometry, X-ray diffraction, X-ray photoelectron spectroscopy, UV–vis spectroscopy, Raman spectroscopy, roughness test, and binding test. The electrochemical impedance spectroscopy, polarization curve, and immersion test were used to evaluate the protection performance of MAO/GO composite coatings provided to a substrate. The test results showed that GO covered the surface of the MAO film and had a multilayer structure in the composite coatings. The composite coatings performed the function of sealing the micropores of the MAO film. The elements in the surface of the composite coatings were evenly distributed and the C element content was high. We find that the composite coatings were smoother than the MAO film. The bonding force of the composite coating needs to be enhanced. The corrosion resistance of the MAO/GO composite coatings was obviously better than that of a single MAO film.
1. Introduction
Magnesium alloys have wide application prospects in the aerospace, automobile, electronics, and military industries because of their low density, high specific strength, and good casting property.1−3 However, the poor corrosion resistance of magnesium alloys is a barrier for the application of magnesium alloys in various fields.4,5 Therefore, it is particularly important to improve the corrosion resistance of magnesium alloys.
Surface treatment plays an important role to improve the corrosion resistance of magnesium alloys.6,7 Micro-arc oxidation (MAO) technology is a promising surface treatment method, and it is based on the traditional anodic oxidization process.8−10 The MAO film can slow down the corrosion rate of magnesium alloys.11,12 However, MAO films are prone to micropores and microcracks because of strong spark discharge.13 These porous structures make corrosive ions accelerate the corrosion of the substrate, which is not conducive to the corrosion protection of the magnesium alloy substrate.14,15 In order to improve the corrosion resistance of magnesium alloys and improve the surface properties of the MAO coatings simultaneously, it is very important to study the corrosion resistance of MAO composite coatings on magnesium alloys.
Graphene is a new type of carbon material with a thickness of only a single atomic layer. It has a unique structure and excellent physicochemical properties.16−18 Because of its large surface area, excellent permeability, high thermal stability, and chemical stability, it has great potential as a metal protective coating.19 Because of the high electron density of the graphene nanosheets, the graphene coatings have excellent corrosion resistance.20 Graphene oxide (GO) is an intermediate product of the preparation of graphene by graphite oxidation.21,22 It is also a two-dimensional material, which is similar to graphene. GO is usually used in the experiment because it is easy to chemically attach graphene sheets onto a bulk substrate surface. GO is hydrophilic, and the presence of oxygenated functional groups (such as hydroxyl, epoxide, and carboxyl groups) makes its use more widespread.23−26 Aliyu et al27 reported that the addition of GO to HEA coatings enhances the coating’s corrosion resistance. Jin et al28 reported that acrylamide and acrylic acid were grafted on graphene to prepare a composite coating on magnesium alloys. GO sheet has physical barrier properties and fills the pinholes of the coating. Tong et al.21 studied the silane/GO coatings on the surface of the Mg–Zn–Ca alloy and concluded that a high hardness of the GO coating can improve the wear resistance of magnesium alloys.
At present, most reports were on the preparation of composite coatings by combining organic reagents with GO to improve the corrosion resistance of magnesium alloys, and the preparation of composite coatings of GO films and MAO films has rarely been reported. In this paper, GO was deposited on the MAO film of a magnesium alloy by electrodeposition, which can form MAO/GO composite coatings. Electrodeposition was simple and environmentally friendly when preparing composite coatings. GO completely sealed the microcracks and micropores of the MAO film, blocking the entry of the corrosive medium. Consequently, the MAO/GO composite coatings showed much better corrosion resistance than the single MAO film.
In this paper, GO was deposited on the MAO film of a magnesium alloy by electrodeposition, which can form MAO/GO composite coatings. GO completely sealed the microcracks and micropores of the MAO film. Consequently, the MAO/GO composite coatings showed much better corrosion resistance than the single MAO film.
2. Materials and Methods
2.1. Materials and Preparation of the Film
The AZ91 magnesium alloy whose composition (wt %) was Al 9.4, Zn 0.82, Mn 0.23, Cu 0.02, Si 0.01, Fe 0.005, Ni 0.002, and Mg balance was used in the experiment. Its size was 35 mm × 25 mm × 3 mm. The magnesium alloy substrate was smoothed with sandpaper of 180 #, 600 #, 800 #, 1000 #, 1200 #, and 1500 #. The magnesium alloy was degreased using an alkaline degreasing solution at 60° C for 60 s. The solution composition was as follows: 40 g L–1 Na2CO3, 20 g L–1 Na3PO4, and 20 g L–1 NaOH; it was rinsed with distilled water. After this, the magnesium alloy was ultrasonically washed with absolute ethanol and distilled water for 10 min and then dried at 50° C.
JHMAO-380/20A-type power supply was used for MAO. Turning on the power, the pulse frequency was set at 50 Hz, and the duty cycle was 30%. The anode was the magnesium alloy and the cathode was stainless steel. The electrolyte was the silicate solution (3–5 g L–1 Na2SiO3, 7–9 g L–1 NaF, and 9–11 g L–1 NaOH). The final voltage was set at 190–230 V or so. Finally, the samples were rinsed with distilled water and dried at 40 °C.
In the experiment, GO which was prepared according to the method of modified Hummers was employed.29−31 The GO solution was formed by a small amount of GO that was ultrasonically dispersed in ethanol for 30 min. The magnesium alloy, which had been treated by MAO as the positive electrode, and the pure magnesium alloy substrate as the negative electrode were put in the GO solution to electrodeposit. The electrodeposition parameters were the deposition voltage of 5 V and the deposition time of 10 min. Subsequently, the sample was dried at 80 °C to obtain the MAO/GO composite coatings.
2.2. Surface Performance Analysis
2.2.1. Surface Characterization
The surface morphology and the cross-sectional structure of the MAO film and the MAO/GO composite coatings were observed by an SU-5000 field launch scanning electron microscope. An X’Pert3 powder X-ray diffractometer (40 kV) and a Renishaw InVia Raman microscope was used for X-ray diffraction (XRD) and Raman spectroscopy analysis of the MAO/GO composite coatings. A TR200 surface roughness tester was employed to test the roughness of the samples.
2.2.2. Composition Analysis
The elemental distribution of different samples was characterized by energy-dispersive spectrometry (EDS), and an EDS system was attached to the SU-4800 field launch scanning electron microscope. X-ray photoelectron spectroscopy was performed with an ESCALAB 250xi XPS test system whose excitation source was Al Kα X-rays (photoelectron energy was 1486.6 eV). The UV–vis absorption spectra were obtained by a Lambda 750 UV/vis/near-infrared spectrometer of 200–800 nm.
2.3. Binding Test
The binding force of the composite coatings was detected by a scratch test. A knife was used to draw multiple parallel lines on the surface of the sample, and the surface of the sample was observed after scratching.
2.4. Electrochemical Performance Test
In this experiment, the polarization curve and the electrochemical impedance of each magnesium alloy sample were tested by the CHI760 electrochemical workstation. All the testing processes were carried out at room temperature. The test used a three-electrode system. The reference electrode was a saturated calomel electrode, the counter electrode was a platinum electrode, and the working electrode was a magnesium alloy. The effective exposed area of each test sample was 1 cm2 and the electrolyte was a 3.5 wt % NaCl solution. At the beginning of the test of the ac impedance and the polarization curve, the open-circuit potential of the sample was scanned until it was stable. The parameters of the electrochemical impedance spectroscopy (EIS) test were the scan frequency range of 100 kHz to 0.1 Hz and the sinusoidal applied perturbation voltage of 10 mV. The scanning range was from EOCP −300 mV to EOCP +300 mV, and the scanning rate was 1 mV·s–1 in the polarization curve test.
2.5. Immersion Test
Immersion test was employed to further study the corrosion of the MAO/GO composite coatings in 3.5 wt % NaCl solution. The total time of soaking was 120 h, and samples were taken every 24 h. The samples which were taken out every day were tested for electrochemical performance to study the corrosion process of the MAO/GO composite coatings in the corrosive medium. The test was performed following the method in Section 2.3, but the scanning range of polarization curves was from −1.75 to −1.15 V in the test.
3. Results and Discussion
3.1. Surface Characterization
3.1.1. Surface Morphology
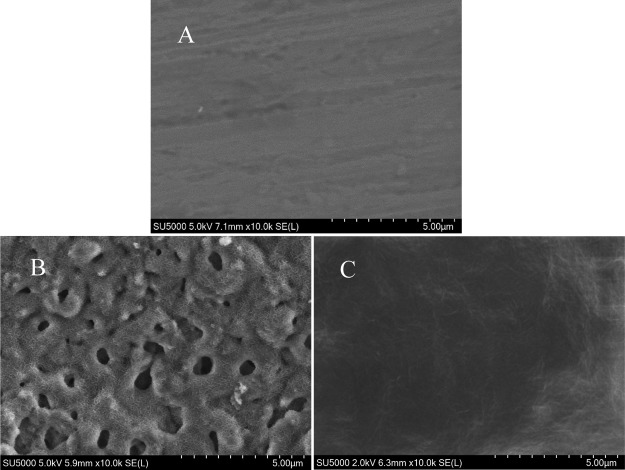
Figure 1 shows the scanning electron microscopy (SEM) image of two samples; (A–C) shows Mg, MAO film, and the MAO/GO composite coating. It could be seen from Figure 1A that the surface of Mg was smooth, and Figure 1B shows that the MAO film had many micropores and microcracks caused by spark discharge GO was uniformly deposited on the MAO film, as shown in Figure 1C. The MAO/GO composite coating showed a layered wrinkle structure and seals the micropores and microcracks of the MAO film without defects.
Figure 1.
SEM morphologies of (A) Mg, (B) MAO film, and (C) MAO/GO composite coating on a magnesium alloy.
3.1.2. Cross-Sectional Morphology
Figure 2 shows the cross-sectional SEM image of the MAO/GO composite coating. There is a significant difference between the MAO/GO composite coating and magnesium alloy substrate in this figure. The outermost film was GO and the inner film was MAO. The micropores of the MAO layer had been filled and completely covered by GO.
Figure 2.
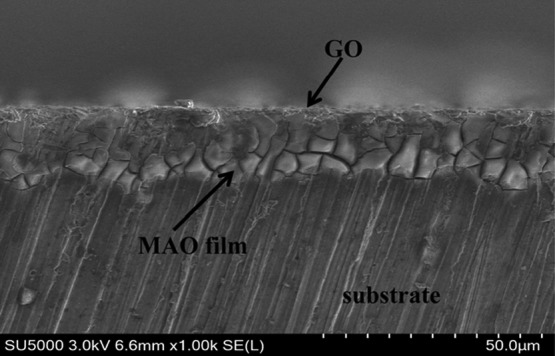
Cross-sectional morphology of the MAO/GO composite coating on a magnesium alloy.
3.1.3. X-ray Diffraction Analysis
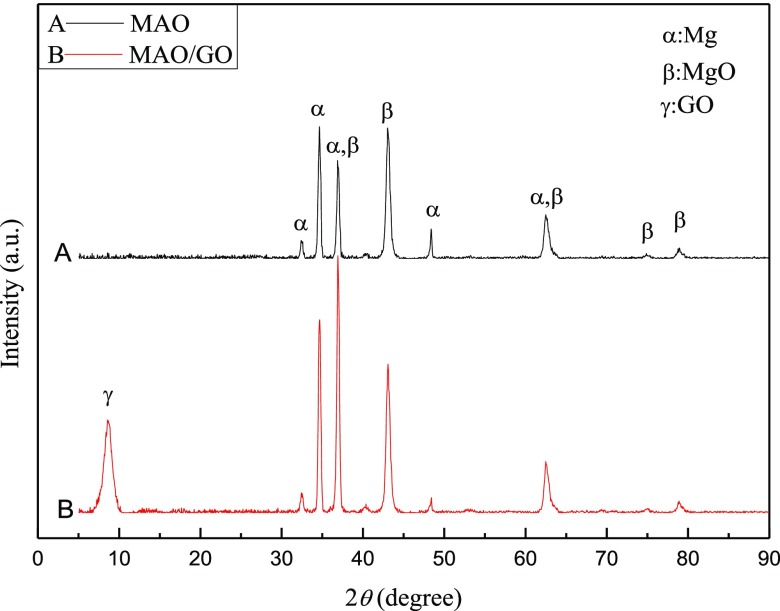
The XRD spectra of the MAO film and the MAO/GO composite coating are shown in Figure 3. The peak positions in the XRD spectra of the composite coatings and the MAO film were basically the same. However, it could be seen that the MAO/GO composite coatings had one more peak that appeared at the position of 9° compared to the MAO film. This peak was the XRD characteristic peak of GO, indicating that GO was relatively ordered deposited on the MAO film to form the MAO/GO composite coating.
Figure 3.
XRD spectra of the MAO film and MAO/GO composite coatings on a magnesium alloy.
3.1.4. Raman Spectroscopy Test
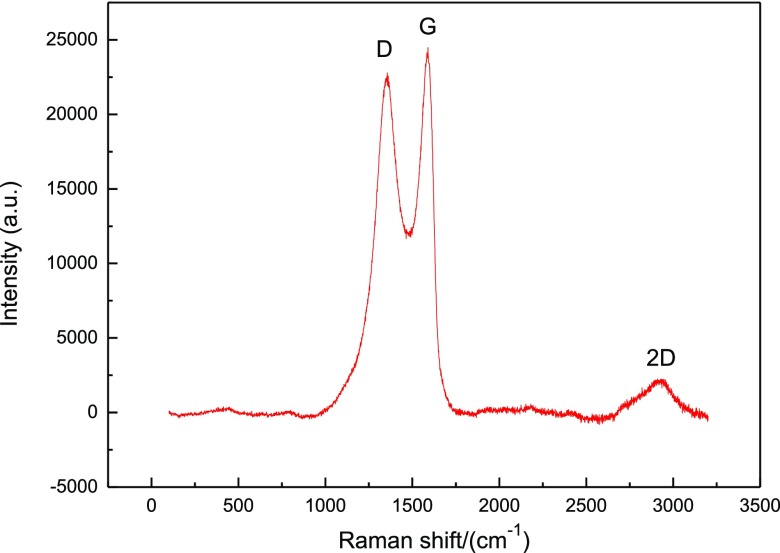
The characteristic absorption peak of GO could usually be represented by Raman spectroscopy. The Raman spectrum of the MAO/GO composite coating on a magnesium alloy is shown in Figure 4. The three characteristic peaks of GO were respectively the D peak at about 1367 cm–1, the G peak at about 1597 cm–1, and the 2D peak at about 2900 cm–1.32,33 This indicated that GO had been deposited on the MAO film. The parameters ID/IG intensity ratio and I2D/IG intensity ratio were used to evaluate the structure performance and quality of the MAO/GO composite coatings. The strength ratio of ID/IG was often used to evaluate the orderliness of the material structure. The ID/IG value was 0.92, which indicated that the prepared MAO/GO composite coatings had a relatively small defect. The I2D/IG intensity ratio was closely related to the number of GO layers. The I2D/IG value was 0.64. It was smaller than 1, which indicated that GO was multilayered in the MAO/GO composite coatings.
Figure 4.
Raman spectroscopy of the MAO/GO composite coatings on a magnesium alloy.
3.1.5. Roughness Test
Surface roughness was generally recognized as the most commonly used roughness evaluation parameter, which also was called the centerline average roughness. It is represented by Ra, and its unit is μm. The smaller the surface roughness, the smoother was the surface. If the surface was rough, it easily resulted in surface corrosion because of the penetration of corrosive gas or liquid through the surface of the microscopic valley into the inner metal film. The results from the test were that Ra of the MAO film was 0.453 μm and Ra of the MAO/GO composite coatings was 0.355 μm. The surface roughness of the MAO/GO composite coatings was smaller than that of the MAO film. Therefore, the MAO/GO composite coatings were more favorable to corrosion protection of magnesium alloy than the MAO film.
3.2. Composition Analysis
3.2.1. Energy-Dispersive Spectrometry
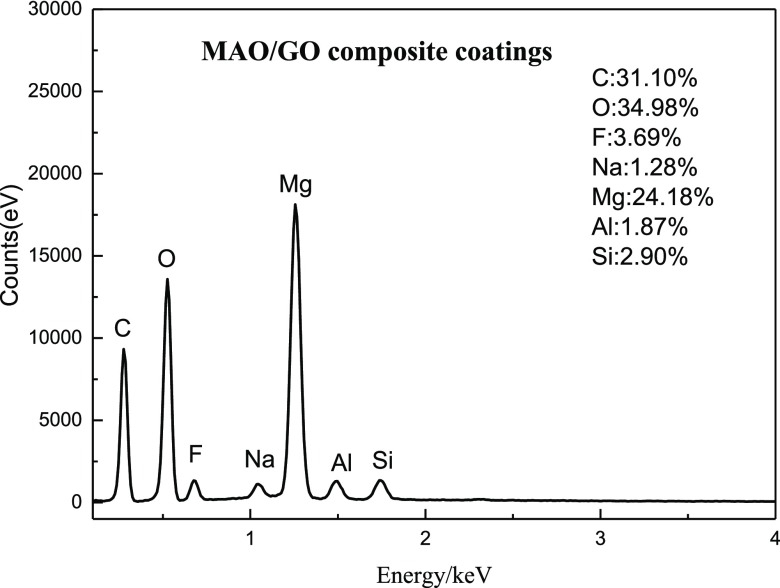
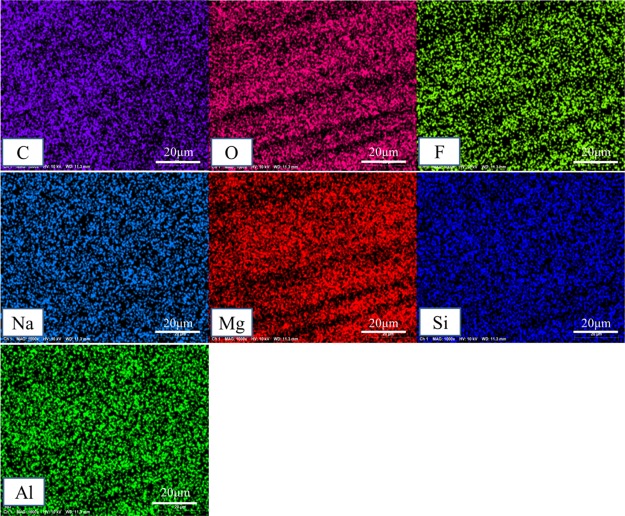
Figures 5 and 6 show the EDS chart and the elemental distribution pictures of the MAO/GO composite coatings on a Mg alloy, respectively. As could be seen from the two figures, there were C, O, F, Na, Si, and other elements in addition to the main elements, Mg and Al, of the magnesium alloy substrate. The reason for the appearance of O, F, Na, and Si elements was the presence of sodium silicate and sodium fluoride in the electrolyte forming the MAO film, whereas the C element was derived from GO. In Figure 6, these elements were evenly distributed. Further, it could be seen from Figure 5 that the content of carbon element was higher than that of other elements. It proved that GO had been uniformly deposited on the MAO film.
Figure 5.
EDS of MAO/GO composite coatings on a magnesium alloy.
Figure 6.
Elemental distribution of the MAO/GO composite coating surface.
3.2.2. X-ray Photoelectron Spectroscopy
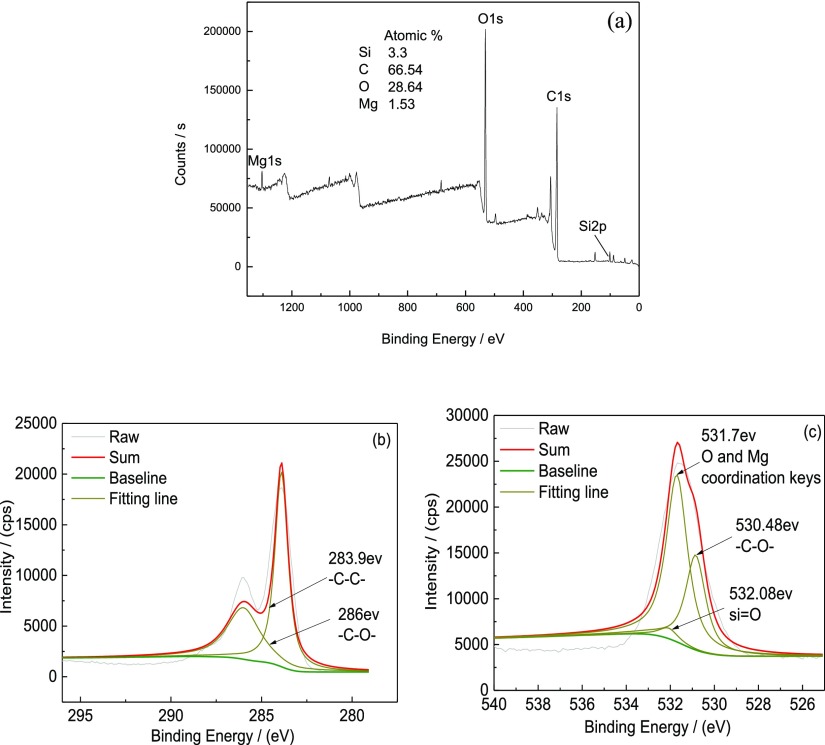
The X-ray photoelectron spectroscopy (XPS) plots of the MAO/GO composite coatings are shown in Figure 7. The surface chemical compositions of the MAO/GO composite coatings were characterized by XPS. Figure 7a shows the total XPS spectrum of the coatings on the magnesium alloy. The Mg, C, O, and Si elements were found on the surface of the MAO/GO composite coatings, and the contents of carbon and oxygen were relatively high.
Figure 7.
XPS plots of MAO/GO composite coatings on magnesium alloys, where (a) is the full spectrum, (b) is the high-resolution spectrum of C 1s, and (c) is the high-resolution spectrum of O 1s.
Figure 7b,c shows the high-resolution XPS spectra of the detected elements C 1s and O 1s, respectively. The data were processed using the XPSPEAK41 software. Further, the composition of the valence structure of each element was determined by comparing with the database. The two peaks that appeared are shown in Figure 7b. The first peak was at the position of 283.9 eV. It was the characteristic peak of −C–C–. The second one was at the position of 286 eV. It should be the characteristic peak of −C–O–. In addition, three peaks are shown in Figure 7c: at 530.48 eV appeared the characteristic peak of −C–O–; at 531.7 eV appeared the characteristic peak of the coordination bond between O and Mg; the characteristic peak of Si=O appeared at the position of 532.08 eV. The above analysis indicated that the GO film existed on the surface of the magnesium alloy.
3.2.3. UV–Vis Absorption Spectrum
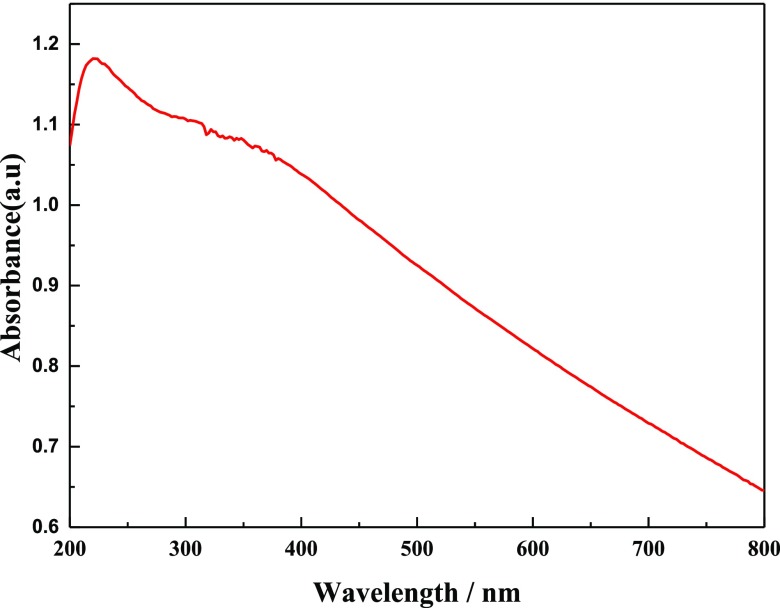
The UV–vis absorption spectrum of the MAO/GO composite coatings on a magnesium alloy is shown in Figure 8. The absorption peak at 230 nm in the UV–visible region was a characteristic peak of GO and could be used as an important indicator of the existence of GO. In Figure 8, a strong absorption peak appeared at 230 nm because of the π–π* transition of C=C, which demonstrated that GO had been deposited on the surface of the MAO film.
Figure 8.
UV–vis absorption spectrum of the MAO/GO composite coatings on a magnesium alloy.
3.3. Binding Test
Figure 9 shows the results of the bonding force test. A small knife was used to draw parallel grids on the surface of the magnesium alloy MAO/GO composite coatings. It could be seen that there was no peeling of the film at the scratches, but the bonding force still needs to be improved.
Figure 9.
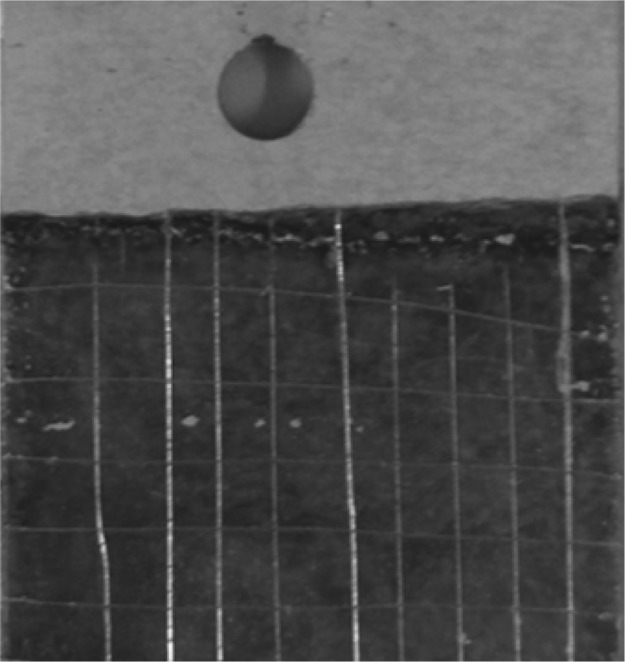
Scratch test of MAO/GO composite coatings on the magnesium alloy surface.
3.4. Electrochemical Performance Test
3.4.1. Electrochemical Impedance Spectroscopy
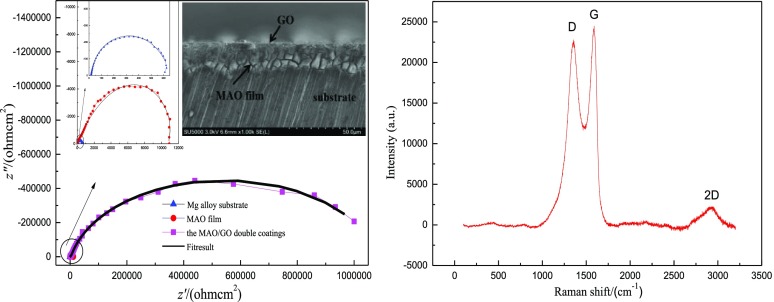
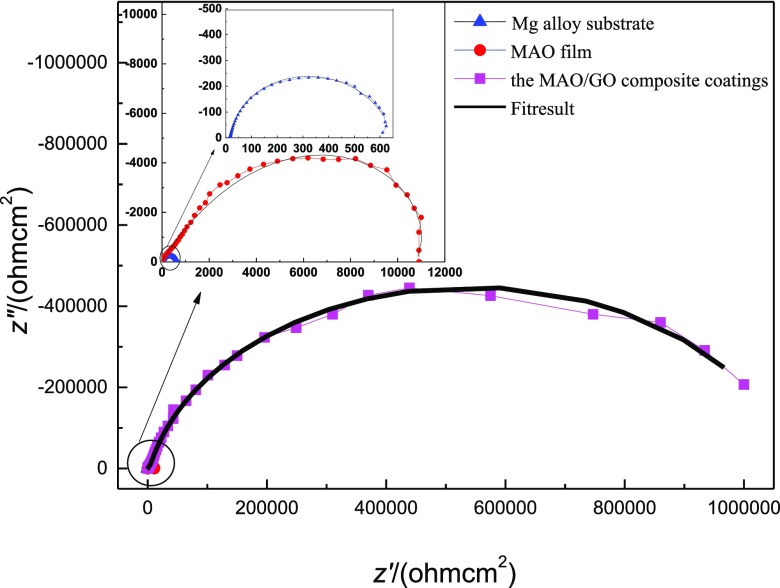
Figure 10 shows the Nyquist plot of the electrochemical impedance of the magnesium alloy substrate, the MAO film, and the MAO/GO composite coatings. From all the impedance diagrams shown in Figure 10, it is observed that the magnesium alloy substrate and the MAO film exhibited relatively complete small-diameter semicircular arcs, and the MAO/GO composite coatings exhibited an incomplete large-diameter capacitive arc. It could be proved that the MAO/GO composite coatings could prevent the corrosive medium penetrating into the film and entering the interface between the substrate and the film, thereby effectively avoiding the occurrence of corrosion.
Figure 10.
Nyquist impedance spectra of the three magnesium alloy samples.
Figure 11 shows the equivalent circuit which is built from the impedance diagram in Figure 10. From Figure 11, we could see that (a) was used for the magnesium alloy substrate and (b) was used for the MAO film and the MAO/GO composite coatings. Rs represents the solution resistance between the research electrode and the reference electrode, whose size was mainly related to the shape of the electrolytic cell and the electrolyte used for testing, and it also called the interliquid resistance. Rcoat is the film resistance and Qcoat is the film capacitance. Qdl is the double-layer capacitance at the interface between the working electrode and the solution. Rct is the charge-transfer resistance of the interface double-layer that could be used to evaluate the corrosion performance of materials. The larger its value, the better the electrochemical stability and corrosion resistance about the material were.
Figure 11.
Equivalent circuit diagram: (a) Mg alloy substrate; (b) MAO film and the MAO/GO composite coatings.
Because of the inhomogeneity of the sample surface and the influence of diffusion factors, the constant phase angle element Q was often used in place of the capacitor C in the equivalent circuit.34 The regular phase element impedance (ZCPE) was usually expressed as35−39
where ω, j, and A represent the angular frequency, polarization current density, and constant phase element, respectively, in units of rad s–1, A cm–2, and Ω–1 sn cm–2. Further, n is the dispersion coefficient which is a dimensionless index. The value of n was directly affected by the roughness of the film surface, the magnitude of which was between 0 and 1. When n was equal to 1, Q represented the ideal capacitance C; when n was equal to 0, it was a pure resistance; when n is equal to 0.5, it was the Weber impedance. The smaller the value of n, the larger was the constant phase angle element Qdl, and the surface of the sample was rough. On the contrary, the larger the value of n, the smaller was the constant phase angle element Qdl, and the surface of the sample was smooth. The rougher the surface of the electrode was, the easier it was for pitting. The smoother and more uniform surface of the electrode would reduce the chance of pitting corrosion.40,41
The ac impedance spectrum was fitted under the proposed equivalent circuit, and the experimentally measured ac impedance spectrum could be well matched. The fitting curve is shown in Figure 10. The obtained data are shown in Table 1.
Table 1. Data of the Nyquist Impedance Spectra in Figure 10.
| sample | Rs (Ω cm2) | Qcoat (μF cm–2) | n1 | Rcoat (Ω cm2) | Qdl (μF cm–2) | n2 | Rct (Ω cm2) |
|---|---|---|---|---|---|---|---|
| Mg alloy substrate | 15.26 | 2.477 × 10⁻⁵ | 0.827 | 661 | |||
| MAO film | 35.16 | 1.787 × 10⁻³ | 0.666 | 16828 | 4.098 × 10⁻⁶ | 0.617 | 10267 |
| double coatings | 6.335 | 8.637 × 10⁻⁸ | 0.865 | 1.069 × 10⁶ | 8.073 × 10⁻⁸ | 0.895 | 15265 |
The Rct value of the Mg alloy substrate was 661Ω cm2, the Rct value of the MAO film was 1.0267 × 10⁴ Ω cm2, and the MAO/GO composite coating value was 1.5625 × 10⁴ Ω cm2, which was the maximum of the three samples in Table 1. The Rcoat value of the MAO film was 1.6828 × 10⁴ Ω cm2, whereas that of the MAO/GO composite coatings could reach 1.0690 × 10⁶ Ω cm2, increasing by 2 orders of magnitude. This indicated that the corrosion resistance and electrochemical stability of the MAO/GO composite coatings prepared by electrodeposition were significantly better than those of the MAO film.
The interfacial capacitance of the magnesium alloy substrate was 2.477 × 10⁻⁵ F cm–2 and that of the MAO film was 4.098 × 10⁻⁶ F cm–2, and the interfacial capacitance of the MAO/GO composite coatings was 8.073 × 10⁻⁸ F cm–2. The interface capacitance of the Mg alloy substrate was 1 order of magnitude higher than that of the MAO film and 3 orders of magnitude higher than that of the MAO/GO composite coatings. The capacitance of the MAO film was 1.787 × 10⁻³ F cm–2. The film capacitance value of the MAO/GO composite coatings was 8.637 × 10⁻⁸ F cm–2, which was 5 orders of magnitude lower than that of the MAO film. The n values of the magnesium alloy substrate, the MAO film, and the MAO/GO composite coatings were 0.827, 0.617, and 0.895, respectively. The n value of the MAO layer was the smallest among the three samples. It resulted from the fact that there were many micropores and microcracks on the MAO film; so, the surface was relatively rough. The n value of the MAO/GO composite coatings was the largest among the three samples; so, the surface was the smoothest of the three.
3.4.2. Polarization Curve Test
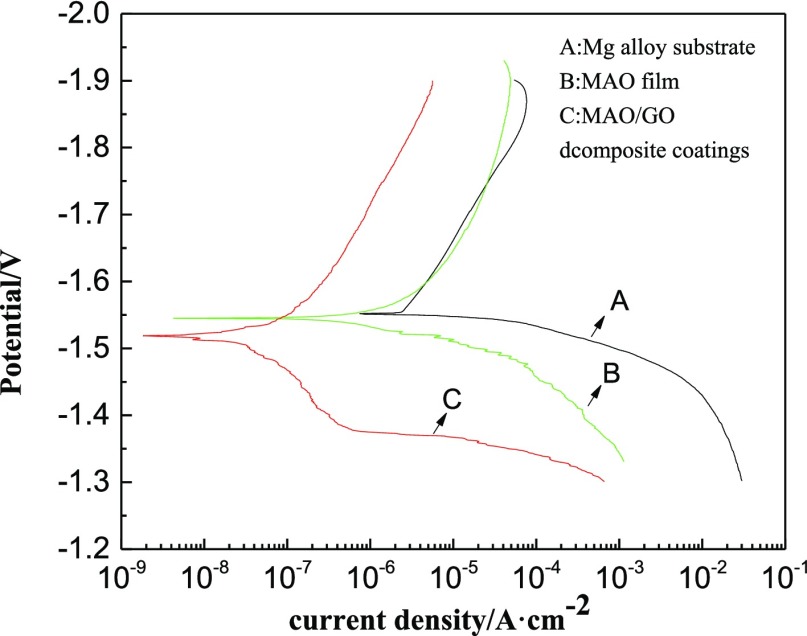
Figure 12 shows the polarization curves of three samples. Table 2 shows the data obtained from Figure 12. The corrosion potentials (Ecorr) of the magnesium alloy substrate, the MAO film, and the MAO/GO composite coatings were −1.552, −1.545, and −1.519 V, respectively, indicating that the MAO film and MAO/GO composite coatings could protect the substrate by slowing the corrosion rate. In addition, the corrosion current density (icorr) of the MAO/GO composite coatings was 8.115 × 10⁻⁸ A cm–2; the value of the MAO film was 2.136 × 10⁻⁶ A cm–2, and the value of the magnesium alloy was 3.902 × 10⁻⁵ A cm–2. Therefore, it is observed that MAO/GO composite coatings had the best corrosion resistance among the three.
Figure 12.
Polarization curves of three samples.
Table 2. Parameters from the Polarization Curves of Figure 11.
| number | corrosion potential (V) | anode slope (mV/decade) | cathode slope (mV/decade) | corrosion current density (A cm–2) |
|---|---|---|---|---|
| A | –1.552 | 13.910 | –4.909 | 3.902 × 10⁻⁵ |
| B | –1.545 | 10.898 | –5.939 | 2.136 × 10⁻⁶ |
| C | –1.519 | 11.314 | –7.053 | 8.115 × 10⁻⁸ |
3.5. Corrosion Expansion Analysis
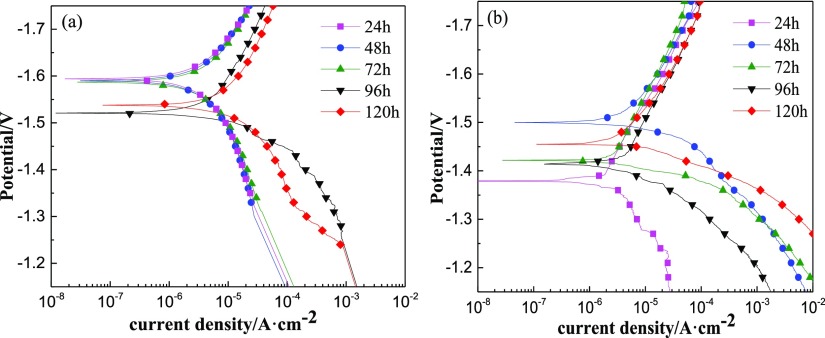
Figure 13 shows the polarization curves of the MAO film and the MAO/GO composite coatings at different immersion times, where (a) and (b) represented the MAO film and the MAO/GO composite coatings, respectively. Table 3 shows the corrosion potential and corrosion current density obtained from Figure 13. Compared with the data in Table 2, icorr of the MAO film and the MAO/GO composite coatings increased after immersion for 24 h, but there is an increase of 2 orders of magnitude for the MAO/GO composite coatings. From Figure 13 and Table 3, the icorr value of the MAO film and the MAO/GO composite coatings had a certain trend, which increased with the increase in the immersion time. For the MAO/GO composite coatings, on the 4th day of the immersion process, the corrosion current density slightly decreased because of the formation of corrosion products to block the contact between the magnesium alloy substrate and corrosive media. The corrosion resistance of the MAO/GO composite coatings showed a tendency to deteriorate as the soaking time increased in the NaCl solution. The possible reason was that the MAO/GO composite coatings were destroyed by corrosive ions such as Cl– or the like, causing the MAO/GO composite coatings to crack and dissolve, which then lead to an increase of the corrosion area. At the same immersion time, the corrosion potential of the MAO/GO composite coatings was more positive than that of the MAO film, indicating that the MAO/GO composite coatings were less likely to be corroded.
Figure 13.
Polarization curves of the different samples at different immersion times: (a) MAO film and (b) MAO/GO composite coatings.
Table 3. Parameters from the Polarization Curves of Figure 13.
| sample | immersion time/h | corrosion potential/V | corrosion current density/A cm–2 |
|---|---|---|---|
| MAO film | 24 | –1.594 | 4.289 × 10⁻⁶ |
| 48 | –1.590 | 4.361 × 10⁻⁶ | |
| 72 | –1.587 | 4.473 × 10⁻⁶ | |
| 96 | –1.521 | 7.726 × 10⁻⁶ | |
| 120 | –1.538 | 1.359 × 10⁻⁵ | |
| MAO/GO composite coatings | 24 | –1.379 | 4.530 × 10⁻⁶ |
| 48 | –1.500 | 4.878 × 10⁻⁶ | |
| 72 | –1.422 | 9.247 × 10⁻⁶ | |
| 96 | –1.414 | 6.847 × 10⁻⁶ | |
| 120 | –1.455 | 1.388 × 10⁻⁵ |
4. Conclusions
In this study, MAO/GO composite coatings were successfully prepared on the surface of a magnesium alloy. The GO film better sealed the micropores and microcracks of the MAO film and hindered the aggregation of corrosion media, and the corrosion resistance of the magnesium alloy substrate was improved.
-
(1)
The surface of the MAO/GO composite coatings was uniform and compact. The MAO/GO composite coatings performed the function of sealing the micropores of the MAO film. The cross-sectional picture clearly shows the structures of the MAO/GO composite coatings, namely the MAO film and the GO layer.
-
(2)
The characteristic peak of GO was found in the XRD pattern and the UV–vis absorption spectrum of the MAO/GO composite coating sample. According to the results of EDS and XPS tests, the content of C in the MAO/GO composite coatings was high, and the elements in the MAO/GO composite coatings were evenly distributed, which indicated that GO covered the MAO film. GO had a multilayer structure in the MAO/GO composite coatings, as observed from the results of the Raman spectroscopy test. The roughness test showed that the MAO/GO composite coatings were smoother than a single MAO film.
-
(3)
The resistance of the MAO/GO composite coating was much larger, but the corrosion current density was smaller, than that of the MAO film and the magnesium alloy substrate. In the immersion experiment, the corrosion current densities of both the MAO film and the MAO/GO composite coatings were increased with the increase in the immersion time, but on the 4th day of the immersion process, the value of the MAO/GO composite coatings slightly decreased. The corrosion potential of the MAO/GO composite coatings was more positive that the Mg alloys were not easily corroded. It showed that the MAO/GO composite coatings played an important role in the protection of magnesium alloys.
Acknowledgments
This work was financially supported by the National Natural Science Foundation of China (nos. 51664011 and 51665010).
The authors declare no competing financial interest.
References
- Zhang X.; Yi J.; Zhao G.; Huang L.; Yan G.; Chen Y.; Liu P. Layer-by-layer assembly of silver nanoparticles embedded polyelectrolyte multilayer on magnesium alloy with enhanced antibacterial property. Surf. Coat. Technol. 2016, 286, 103–112. 10.1016/j.surfcoat.2015.12.018. [DOI] [Google Scholar]
- Cui X.-J.; Li M.-T.; Yang R.-S.; Yu Z.-X. Structure and properties of a duplex coating combining micro-arc oxidation and baking layer on AZ91D Mg alloy. Appl. Surf. Sci. 2016, 363, 91–100. 10.1016/j.apsusc.2015.10.236. [DOI] [Google Scholar]
- Zhang Z.-Q.; Zeng R.-C.; Lin C.-G.; Wang L.; Chen X.-B.; Chen D.-C. Corrosion resistance of self-cleaning silane/polypropylene composite coatings on magnesium alloy AZ31. J. Mater. Sci. Technol. 2020, 41, 43–55. 10.1016/j.jmst.2019.08.056. [DOI] [Google Scholar]
- Song G. L.; Atrens A. Corrosion Mechanisms of Magnesium Alloys. Adv. Eng. Mater. 1999, 1, 11–33. . [DOI] [Google Scholar]
- Liu P.; Pan X.; Yang W.; Cai K.; Chen Y. Improved anticorrosion of magnesium alloy via layer-by-layer self-assembly technique combined with micro-arc oxidation. Mater. Lett. 2012, 75, 118–121. 10.1016/j.matlet.2012.02.016. [DOI] [Google Scholar]
- Umehara H.; Takaya M.; Terauchi S. Chrome-free surface treatments for magnesium alloy. Surf. Coat. Technol. 2003, 169–170, 666–669. 10.1016/s0257-8972(03)00052-5. [DOI] [Google Scholar]
- Saberi F.; Boroujeny B. S.; Doostmohamdi A.; Baboukani A. R.; Asadikiya M. Electrophoretic deposition kinetics and properties of ZrO 2 nano coatings. Mater. Chem. Phys. 2018, 213, 444–454. 10.1016/j.matchemphys.2018.04.050. [DOI] [Google Scholar]
- Sabaghi Joni M.; Fattah-alhosseini A. Effect of KOH concentration on the electrochemical behavior of coatings formed by pulsed DC micro-arc oxidation (MAO) on AZ31B Mg alloy. J. Alloys Compd. 2016, 661, 237–244. 10.1016/j.jallcom.2015.11.169. [DOI] [Google Scholar]
- Han J.; Wan P.; Sun Y.; Liu Z.; Fan X.; Tan L.; Yang K. Fabrication and Evaluation of a Bioactive Sr–Ca–P Contained Micro-Arc Oxidation Coating on Magnesium Strontium Alloy for Bone Repair Application. J. Mater. Sci. Technol. 2016, 32, 233–244. 10.1016/j.jmst.2015.11.012. [DOI] [Google Scholar]
- Qiu T.; Wu X. L.; Jin F. Y.; Huang A. P.; Chu P. K. Self-assembled growth of MgO nanosheet arrays via a micro-arc oxidation technique. Appl. Surf. Sci. 2007, 253, 3987–3990. 10.1016/j.apsusc.2006.08.034. [DOI] [Google Scholar]
- Dehnavi V.; Binns W. J.; Noël J. J.; Shoesmith D. W.; Luan B. L. Growth behaviour of low-energy plasma electrolytic oxidation coatings on a magnesium alloy. J. Magnesium Alloys 2018, 6, 229–237. 10.1016/j.jma.2018.05.008. [DOI] [Google Scholar]
- Ur Rehman Z.; Choi D. Investigation of ZrO2 nanoparticles concentration and processing time effect on the localized PEO coatings formed on AZ91 alloy. J. Magnesium Alloys 2019, 7, 555–565. 10.1016/j.jma.2019.10.001. [DOI] [Google Scholar]
- Cui X.-j.; Yang R.-s.; Liu C.-h.; Yu Z.-x.; Lin X.-z. Structure and corrosion resistance of modified micro-arc oxidation coating on AZ31B magnesium alloy. Trans. Nonferrous Met. Soc. China 2016, 26, 814–821. 10.1016/s1003-6326(16)64172-9. [DOI] [Google Scholar]
- Li C.-Y.; Feng X.-L.; Fan X.-L.; Yu X.-T.; Yin Z.-Z.; Kannan M. B.; Chen X.-B.; Guan S.-K.; Zhang J.; Zeng R.-C. Corrosion and Wear Resistance of Micro-Arc Oxidation Composite Coatings on Magnesium Alloy AZ31—The Influence of Inclusions of Carbon Spheres. Adv. Eng. Mater. 2019, 21, 1900446. 10.1002/adem.201900446. [DOI] [Google Scholar]
- Li C.-Y.; Yu C.; Zeng R.-C.; Zhang B.-C.; Cui L.-Y.; Wan J.; Xia Y. In vitro corrosion resistance of a Ta2O5 nanofilm on MAO coated magnesium alloy AZ31 by atomic layer deposition. Bioact. Mater. 2020, 5, 34–43. 10.1016/j.bioactmat.2019.12.001. [DOI] [PMC free article] [PubMed] [Google Scholar]
- Kirkland N. T.; Schiller T.; Medhekar N.; Birbilis N. Exploring graphene as a corrosion protection barrier. Corros. Sci. 2012, 56, 1–4. 10.1016/j.corsci.2011.12.003. [DOI] [Google Scholar]
- Toh S. Y.; Loh K. S.; Kamarudin S. K.; Daud W. R. W. Graphene production via electrochemical reduction of graphene oxide: Synthesis and characterisation. Chem. Eng. J. 2014, 251, 422–434. 10.1016/j.cej.2014.04.004. [DOI] [Google Scholar]
- Ye X.; Lin Z.; Zhang H.; Zhu H.; Liu Z.; Zhong M. Protecting carbon steel from corrosion by laser in situ grown graphene films. Carbon 2015, 94, 326–334. 10.1016/j.carbon.2015.06.080. [DOI] [Google Scholar]
- Huang X.; Yin Z.; Wu S.; Qi X.; He Q.; Zhang Q.; Yan Q.; Boey F.; Zhang H. Graphene-based materials: synthesis, characterization, properties, and applications. Small 2011, 7, 1876–1902. 10.1002/smll.201002009. [DOI] [PubMed] [Google Scholar]
- Munir K.; Wen C.; Li Y. Graphene nanoplatelets-reinforced magnesium metal matrix nanocomposites with superior mechanical and corrosion performance for biomedical applications. J. Magnesium Alloys 2020, 10.1016/j.jma.2019.12.002. [DOI] [Google Scholar]
- Tong L. B.; Zhang J. B.; Xu C.; Wang X.; Song S. Y.; Jiang Z. H.; Kamado S.; Cheng L. R.; Zhang H. J. Enhanced corrosion and wear resistances by graphene oxide coating on the surface of Mg-Zn-Ca alloy. Carbon 2016, 109, 340–351. 10.1016/j.carbon.2016.08.032. [DOI] [Google Scholar]
- Pandey R. P.; Shukla G.; Manohar M.; Shahi V. K. Graphene oxide based nanohybrid proton exchange membranes for fuel cell applications: An overview. Adv. Colloid Interface Sci. 2017, 240, 15–30. 10.1016/j.cis.2016.12.003. [DOI] [PubMed] [Google Scholar]
- Lee W.; Oh Y.; Lee K. E.; Lee J. U. Contrast enhancement for quantitative image analysis of graphene oxide using optical microscopy for Si-based field effect transistors. Mater. Sci. Semicond. Process. 2015, 39, 521–529. 10.1016/j.mssp.2015.05.057. [DOI] [Google Scholar]
- He W.; Zhu L.; Chen H.; Nan H.; Li W.; Liu H.; Wang Y. Electrophoretic deposition of graphene oxide as a corrosion inhibitor for sintered NdFeB. Appl. Surf. Sci. 2013, 279, 416–423. 10.1016/j.apsusc.2013.04.130. [DOI] [Google Scholar]
- Chaudhry A. U.; Mittal V.; Mishra B. Effect of graphene oxide nanoplatelets on electrochemical properties of steel substrate in saline media. Mater. Chem. Phys. 2015, 163, 130–137. 10.1016/j.matchemphys.2015.07.023. [DOI] [Google Scholar]
- Zhao Y. C.; Tang Y.; Zhao M. C.; Liu L.; Gao C.; Shuai C.; Zeng R. C.; Atrens A.; Lin Y. Graphene Oxide Reinforced Iron Matrix Composite With Enhanced Biodegradation Rate Prepared by Selective Laser Melting. Adv. Eng. Mater. 2019, 21, 1900314. 10.1002/adem.201900314. [DOI] [Google Scholar]
- Aliyu A.; Rekha M. Y.; Srivastava C. Microstructure-electrochemical property correlation in electrodeposited CuFeNiCoCr high-entropy alloy-graphene oxide composite coatings. Philos. Mag. 2018, 99, 718–735. 10.1080/14786435.2018.1554915. [DOI] [Google Scholar]
- Jin T.; Xie Z.; Fullston D.; Huang C.; Zeng R.; Bai R. Corrosion resistance of copolymerization of acrylamide and acrylic acid grafted graphene oxide composite coating on magnesium alloy. Prog. Org. Coat. 2019, 136, 105222. 10.1016/j.porgcoat.2019.105222. [DOI] [Google Scholar]
- Huang L.-j.; Wang Y.-x.; Tang J.-g.; Wang Y.; Liu J.-x.; Huang Z.; Jiao J.-q.; Wang W.; Kipper M. J.; Belfiroe L. A. A new graphene nanocomposite to improve the electrochemical properties of magnesium-based amorphous alloy. Mater. Lett. 2015, 160, 104–108. 10.1016/j.matlet.2015.07.080. [DOI] [Google Scholar]
- Hummers W. S.; Offeman R. E. Preparation of Graphitic Oxide. J. Am. Chem. Soc. 1958, 80, 1339. 10.1021/ja01539a017. [DOI] [Google Scholar]
- Talyzin A. V.; Mercier G.; Klechikov A.; Hedenström M.; Johnels D.; Wei D.; Cotton D.; Opitz A.; Moons E. Brodie vs Hummers graphite oxides for preparation of multi-layered materials. Carbon 2017, 115, 430–440. 10.1016/j.carbon.2016.12.097. [DOI] [Google Scholar]
- Santos C.; Piedade C.; Uggowitzer P. J.; Montemor M. F.; Carmezim M. J. Parallel nano-assembling of a multifunctional GO/HapNP coating on ultrahigh-purity magnesium for biodegradable implants. Appl. Surf. Sci. 2015, 345, 387–393. 10.1016/j.apsusc.2015.03.182. [DOI] [Google Scholar]
- Zhang J.-J.; Liu X.; Ye T.; Zheng G.-P.; Zheng X.-C.; Liu P.; Guan X.-X. Novel assembly of homogeneous reduced graphene oxide-doped mesoporous TiO 2 hybrids for elimination of Rhodamine-B dye under visible light irradiation. J. Alloys Compd. 2017, 698, 819–827. 10.1016/j.jallcom.2016.12.279. [DOI] [Google Scholar]
- Khorsand S.; Raeissi K.; Ashrafizadeh F. Corrosion resistance and long-term durability of super-hydrophobic nickel film prepared by electrodeposition process. Appl. Surf. Sci. 2014, 305, 498–505. 10.1016/j.apsusc.2014.03.123. [DOI] [Google Scholar]
- Guo X.; An M. Experimental study of electrochemical corrosion behaviour of bilayer on AZ31B Mg alloy. Corros. Sci. 2010, 52, 4017–4027. 10.1016/j.corsci.2010.08.017. [DOI] [Google Scholar]
- Li Z.; Yuan Y. Preparation and characterization of superhydrophobic composite coatings on a magnesium–lithium alloy. RSC Adv. 2016, 6, 90587–90596. 10.1039/c6ra13194h. [DOI] [Google Scholar]
- Veys-Renaux D.; Rocca E.; Martin J.; Henrion G. Initial stages of AZ91 Mg alloy micro-arc anodizing: Growth mechanisms and effect on the corrosion resistance. Electrochim. Acta 2014, 124, 36–45. 10.1016/j.electacta.2013.08.023. [DOI] [Google Scholar]
- Yüce A. O.; Kardaş G. Adsorption and inhibition effect of 2-thiohydantoin on mild steel corrosion in 0.1M HCl. Corros. Sci. 2012, 58, 86–94. 10.1016/j.corsci.2012.01.013. [DOI] [Google Scholar]
- Wang Y.; Huang Z.; Yan Q.; Liu C.; Liu P.; Zhang Y.; Guo C.; Jiang G.; Shen D. Corrosion behaviors and effects of corrosion products of plasma electrolytic oxidation coated AZ31 magnesium alloy under the salt spray corrosion test. Appl. Surf. Sci. 2016, 378, 435–442. 10.1016/j.apsusc.2016.04.011. [DOI] [Google Scholar]
- Song G.-L.; Shi Z. Corrosion mechanism and evaluation of anodized magnesium alloys. Corros. Sci. 2014, 85, 126–140. 10.1016/j.corsci.2014.04.008. [DOI] [Google Scholar]
- Song L.; Chen Z. The role of UV illumination on the NaCl-induced atmospheric corrosion of Q235 carbon steel. Corros. Sci. 2014, 86, 318–325. 10.1016/j.corsci.2014.06.013. [DOI] [Google Scholar]


