Abstract
Surface-enhanced Raman scattering (SERS) substrates were prepared by depositing Ag atoms on liquid surfaces via thermal evaporation at room temperature. These free-sustained substrates result in the formation of uniform Ag films, in which ramified Ag aggregates consist of substantial Ag nanoclusters with narrow gaps of several nanometers in between. SERS spectra of rhodamine 6G were investigated for this substrate to evaluate the SERS performance of this characteristic film morphology, and the results indicated that the SERS intensity from the closely-packed Ag nanostructures and small intervals were significantly enhanced. The dependence of SERS enhancement on the film thickness, nanoparticle size, and gap width was studied. An analytical model was proposed to simulate the electric field distribution during SERS detection, and the results validated the experimental observations.
1. Introduction
Surface-enhanced Raman scattering (SERS) as a high-resolution, nondestructive, and ultrasensitive spectroscopic technique has aroused increasing interest over the past few decades.1−5 In general, traditional Raman spectroscopy has a relatively low detection sensitivity caused by weak signals and interference noise.6 With the assistance of various characteristic SERS substrates, the spectrum can receive a dramatic enhancement compared with traditional Raman scattering, and the detection limit can be even increased to the single-molecule level.7−9 As a result, SERS has been widely applied to chemical detection and biological diagnosis.10−12 Although the precise mechanism of enhancement is still controversial, it is generally accepted that the SERS effect is due to the electromagnetic enhancement arising from localized surface plasma resonance and chemical enhancement based on charge transfer.2,13,14 Various processes for the preparation of SERS substrates have been investigated, such as wet chemical synthesis,15,16 self-assembly,17,18 template method,19,20 and etching.21,22 However, the SERS substrates with high sensitivity, simple preparation process, and low cost are still the advanced topics in current SERS studies.
Metallic thin films deposited on liquid surfaces have been intensively investigated for decades because of the unique properties and potential applications in optical, electronic, and other interdisciplinary fields.23−26 Compared with solid substrates, liquid surfaces possess smaller tangential stress and larger capability of flowing, and thus can be regarded as quasi free-standing substrates.23 The growth of metallic films on liquid surfaces can be generally described according to the two-stage growth model: in stage I, metallic atoms nucleate over the liquid surfaces to form disk-shaped clusters; in stage II, the clusters diffuse continuously on the liquid surface and finally aggregate.25 This two-stage growth results in a distinctive morphology and structure of thin films, which are quite different from those deposited directly on solid substrates.
According to the specific characteristics of metallic films grown on liquid surfaces, we here try to validate the feasibility of Ag films deposited on the liquid surface serving as SERS substrates. Moreover, we optimize the SERS effect of our substrates by adjusting the deposition time and film thickness during the growth process, thus further investigating the mechanism of the SERS effect caused by this characteristic film morphology. In this work, Ag films with different nominal thicknesses are prepared on silicone surfaces by thermal evaporation at room temperature. Optical microscopy and scanning electron microscopy (SEM) are employed to obtain high-resolution images to confirm the Ag film morphology, and the SERS performance of the prepared films is evaluated by the detection of rhodamine 6G (R6G) molecules with various concentrations.
2. Results and Discussion
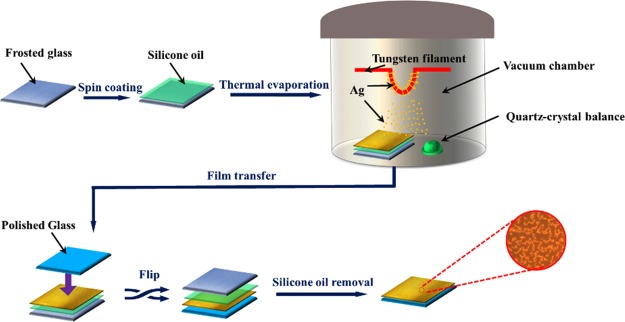
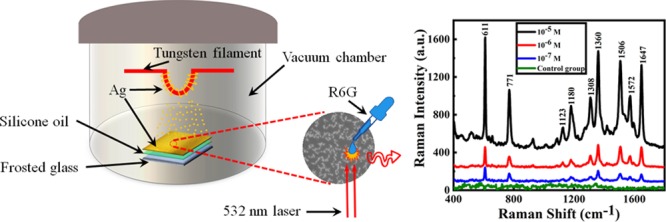
In this work, SERS substrates were prepared by depositing Ag atoms on liquid surfaces by thermal evaporation at room temperature, and the illustration of the whole process is shown in Figure 1.
Figure 1.
Schematic illustration of the ramified Ag film grown on the silicone oil surface.
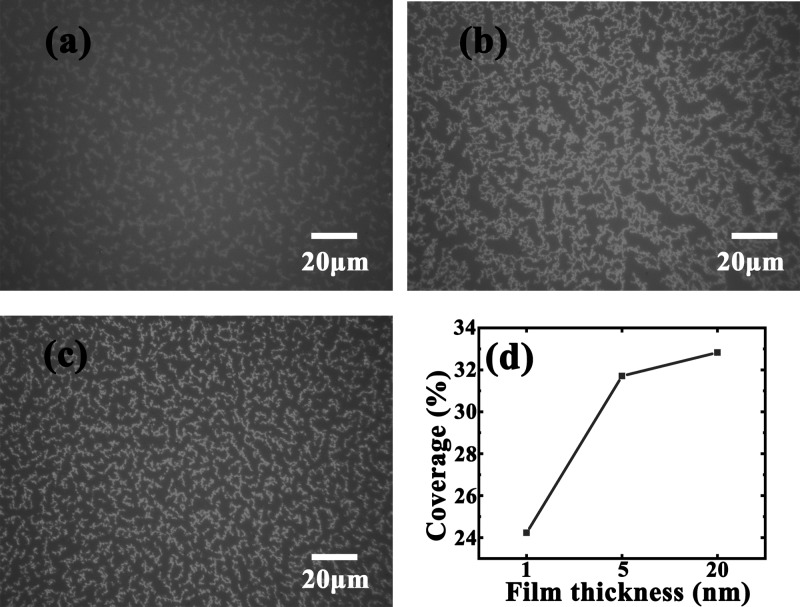
To obtain an overview morphology of the Ag films deposited on silicone oil, we compare the optical micrographs of the Ag films with different thicknesses in Figure 2, in which Figure 2a–c correspond to Ag films deposited on the silicone oil surface with nominal thicknesses of 1, 5, and 20 nm, respectively. From Figure 2, we can see that as the film thickness increases, compact structures can be formed on silicone oil surfaces and the ramified film morphology tends to be more evident and widely distributed. Moreover, the uniformity of the film is greatly improved by comparing the Ag film morphology with different thicknesses in Figure 2a–c; these three figures describe the evolution of Ag atoms from discrete aggregates to continuous thin films. Figure 2d shows the dependence between the surface coverage and film thicknesses of the deposited Ag films. When the nominal thickness of deposition increases from 1 to 5 nm, the film coverage increases dramatically from 24.2 to 31.7%. However, as the nominal thickness further increases from 5 to 20 nm, the corresponding coverage increased by only 1.1%, which indicates the saturation of the Ag film coverage on the silicone oil surface. This phenomenon may be due to the internal condensation of Ag films during the growth process;20 when the film thickness increased from 1 to 5 nm, silver islands gradually formed and the number of islands continued to increase and thus the surface coverage increased significantly. As the thickness of the silver films further increased, silver islands tended to grow higher rather than wider, resulting in the almost unchanged film coverage.24,27
Figure 2.
Optical images of ramified Ag films deposited on silicone oil surfaces with thicknesses of (a) 1, (b) 5, and (c) 20 nm; (d) dependence between the surface coverage and Ag film thicknesses.
To compare the detailed morphology of the as-prepared Ag films with the typical morphology of Ag films grown on liquid surfaces in our previous work,24 SEM images of Ag films with various magnifications are shown in Figure 3a–c. As we can see, the Ag film is constituted of the micrometer-sized ramified aggregates, and aggregates are arranged with closely packed Ag nanoparticles. Figure 3d demonstrates the diameter distribution of Ag nanoparticles, which shows that the diameter generally ranged in 40–100 nm, with a mean size of ∼60 nm. The overall structure can be confirmed to be consistent with the typical morphology of thin metallic films grown on liquid surfaces, which is mainly attributed to the quasi-isotropic characteristics of the free-sustained substrates.21 As shown in Figure 3a–c, large amounts of narrow gaps are widely distributed between adjacent particles, which can behave as SERS “hot spots” where Raman signals are significantly amplified. Considering that the film uniformity is a crucial factor for enhancement efficiency of the Raman signal, we choose the Ag film with the nominal thickness of 20 nm as the SERS substrate to investigate the Raman enhancement effect.
Figure 3.
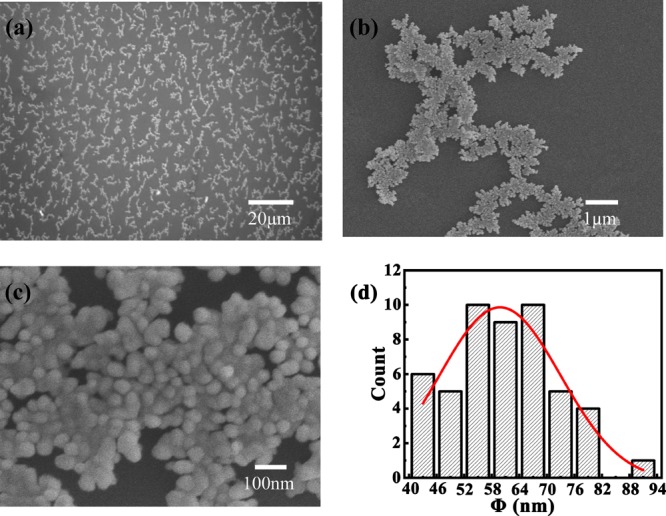
(a–c) SEM images of a Ag film with various magnifications; (d) statistical distribution of dimensions of 50 Ag nanoparticles. The solid curve is the Gaussian distribution fitting to the experimental data.
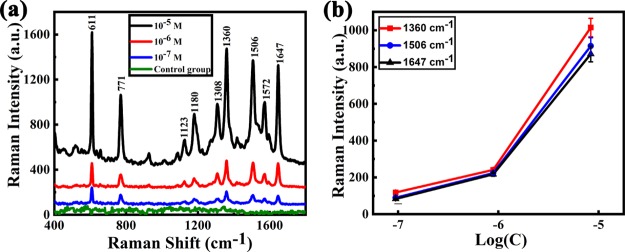
The as-prepared 20 nm Ag film was chosen as the SERS substrate for the probe molecule detection. For each sample, 50 μL of R6G solution in de-ionized water was dropped onto the center of the prepared Ag film via a pipette. After the drying of the substrates naturally at room temperature, Raman spectra of R6G with different concentrations were measured, and the results are shown in Figure 4a, and the control group in Figure 4a represents the Raman spectra of 10–7 M R6G dropped on the Ag film directly deposited on the glass substrate. For each sample, the Raman signals of five random positions in the as-prepared Ag films were measured. Figure 4a clearly indicates that the Ag films fabricated on liquid surfaces showed significant Raman signal enhancement for all three different concentrations of R6G, while the control sample fabricated on the solid surface shows no obvious Raman signal enhancement. These spectra demonstrate that Ag films prepared on the liquid surface serve as an effective SERS substrate; the limit of detection28−30 of R6G can reach 10–7 M and the enhancement factor is about 106.
Figure 4.
Raman spectra of R6G with different concentrations. (a) Raman spectra of R6G with different concentrations of 10–5, 10–6, and 10–7 M respectively; (b) plots of Raman intensities of R6G solutions at 1360, 1506, and 1647 cm–1 vs the logarithmic R6G concentration.
The characteristic bands of the Raman spectra are corresponding to the different vibration modes of R6G:31−33 the band at 611 cm–1 is assigned to the C–C–C ring in-plane vibration mode. The band at 771 cm–1 corresponds to the C–H out-of-plane bending mode. Those at 1123 and 1180 cm–1 are assigned to the C–H in-plane bending mode, and the peaks at 1308 and 1572 cm–1 are due to the in-plane N–H vibration mode; the pronounced peaks at 1360, 1506, and 1647 cm–1 are assigned to the aromatic stretching vibrations. Figure 4b shows the dependence between the Raman signal intensity and R6G concentration at the characteristic bands of 1360, 1506, and 1647 cm–1, which clearly shows that the peak intensity of the Raman spectrum increases as the R6G concentration increases.
In order to further investigate the enhancement mechanism of the Ag film theoretically, the finite difference time domain (FDTD) method is used to construct a model of the Ag film nanostructure and analyze the enhancement effect of the closely arranged silver nanoparticles on the incident electric field. During the numerical simulation, we select Ag (silver)-CRC as the material in the setting of the simulation parameters. The excitation wavelength of the incident light is 532 nm with the incident direction perpendicular to the film plane. In addition, the FDTD simulation time is set to 100 fs and the simulation temperature is 300 K. The boundary condition is selected as the perfectly matched layer.
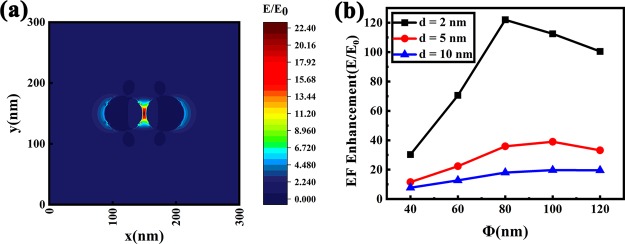
First, a dimer model was established to explore the dependence between the electric field enhancement and the morphology of nanoparticles, especially the size and separation of nanoparticles, and the obtained results are shown in Figure 5. Figure 5a shows the electric field distribution of two Ag nanoparticles, each with a size of 60 nm and an interval of 5 nm. From the simulation result, we can see that the electric field is significantly enhanced at the gap between the two Ag nanoparticles, with the highest electric field enhancement (E/E0) of ∼22.4. Theoretically, the Raman enhancement factor is proportional to (E/E0);4 therefore, in this model of the dimer system, the enhancement factor can be raised up to five orders of magnitude. Figure 5b shows the influence of the gap width and the size of Ag nanoparticles on the electric field enhancement, which indicates that the smaller the separation between Ag nanoparticles, the larger the electric field enhancement stimulated. When the separation distance is fixed, the electric field enhancement first increases and then decreases with increasing size of nanoparticles. These simulation results can be regarded as a reference for the effectiveness of the widely distributed narrow gaps that exist in our SERS substrates and indicate that the morphology of SERS substrates can be further optimized to increase the enhancement, with small gap widths and appropriate mean diameters of nanoparticles in Ag films.
Figure 5.
(a) Electric field distribution in a Ag dimer model; (b) dependence of the electric field enhancement on the Ag particle size and separation distance.
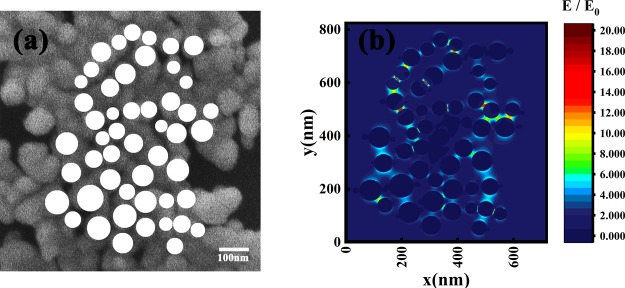
To further investigate the detailed mechanism of our SERS substrates, the mapping morphology of Ag films prepared on liquid surfaces are obtained, and the subsequent FDTD model is built based on the SEM figures, as shown in Figure 6a. Figure 6b shows that the maximum local electric field intensity can reach ∼71.8, which is much larger than the incident electric field intensity. The SERS enhancement factor can be up to 107. The simulation results demonstrate that there is a significant enhancement of the electric field at the gap within Ag nanoparticles, thus validating the experimental results of the SERS measurement.
Figure 6.
(a) FDTD model built according to the SEM morphology of the Ag film prepared on liquid substrates; (b) mapping results of the simulation of electric field distribution, E0 represents the incident electric field, E represents the exciting electric field, the color bar represents the E/E0, which indicates the enhancement of the electric field.
From both the experimental results and analytical simulation, we can obtain the general relationship between the SERS performance and film thickness of the prepared substrates, which may be mainly attributed to the various morphologies caused by the film thickness. During the growth process, as the deposited Ag atoms on silicone oil surfaces aggregate according to the two-stage growth model, quasi-continuous thin films were obtained because of the isotropic characteristics of liquid surfaces. The widely distributed ramified aggregates, which constitute substantial Ag nanoparticles and narrow intervals served as large amounts of “hot spots” to significantly enhance Raman signals. It should be noticed that, although the mean diameter of Ag nanoparticles would not change dramatically with the film thickness, the increase of film thickness can largely improve the uniformity and decrease the gap width among Ag nanoparticles, which should be preferable for the SERS measurement. It should be mentioned that it has been verified that the diameter distribution of nanoparticles is dependent on both the film thickness and the deposition rate. Therefore, SERS substrates with various morphologies can be prepared by this method, and further investigation can be carried out in the next stage to systematically study the relationship between the Raman enhancement and the film morphology to optimize the SERS performance of these substrates.
3. Conclusions
In summary, this paper proposes an effective SERS substrate by the deposition of Ag films on liquid substrates, which exhibits a significant SERS enhancement on probe molecules R6G. Because of the quasi-isotropic and free-sustained characteristics of liquid surfaces, these Ag films grown on liquid surfaces possess specific morphology of ramified aggregates, which constitutes closely arranged Ag nanoparticles. The substantial Ag nanoparticles and narrow intervals in between can serve as the “hot spots” in SERS detection, which has been confirmed in the experimental SERS measurement of R6G molecules. Moreover, the dependence of the SERS enhancement on the film thickness, nanoparticle size, and gap width was systematically studied. The FDTD method is utilized to theoretically analyze the enhancement mechanism of the Raman signal and validate the effectiveness of these SERS substrates. These substrates developed a potential application of Ag films grown on liquid surfaces and presented an applicable method to prepare effective SERS substrates, which may be a promising candidate in environment pollutant detection and biological diagnosis.
4. Experimental Section
SERS substrates were prepared by Ag atom deposition on liquid surfaces by thermal evaporation at room temperature. First, a 10 × 10 mm2 frosted glass slide was ultrasonically cleaned using acetone, ethanol, and deionized water each for five min, respectively. After drying, silicone oil (Dow Corning 705 Diffusion Pump Fluid, saturated vapor pressure at room temperature <10–8 Pa) was uniformly spin-coated on the frosted glass slide with a thickness of ∼0.5 mm. Subsequently, Ag atoms were thermal-evaporated from a silver wire (99.99%, Sinopharm Chemical Reagent Co., Ltd) at room temperature (20 ± 3 °C), the whole deposition process was conducted in a vacuum chamber under pressure of 2.2 × 10⁻⁴ Pa. The deposition rate and nominal film thickness can be monitored by a quartz crystal microbalance (CRTM 8000) located near the samples and modified instantaneously during growth process, the nominal thickness of Ag films can be calculated by multiplying the deposition rate with deposition time. In our experiment, the deposition rate of Ag atoms was kept at 0.10 ± 0.03 Å/s, Ag films with different nominal thicknesses of 1, 5, and 20 nm were prepared by adjusting the deposition time of Ag atoms. After the deposition, the samples were kept stationary for 15 min before being removed from the vacuum chamber. Afterward, each sample was covered gently with a cleaned polished glass slide on the surface of the Ag film, was then immersed in an acetone solution to transfer the Ag film to the polished glass slide without the change of the morphology of the Ag film. The sample was then immersed in acetone and ethyl ethanol solution for 5 min each to further remove the residual silicone oil and then dried naturally.
After the stabilization of the as-prepared Ag substrates, the general morphologies of Ag films were observed under an optical microscope (Leica DMLM). Figure 2 shows the morphology of the ramified Ag films with different nominal thicknesses. The detailed structures of the nanostructures were further investigated under a scanning electron microscope (Hitachi SU8010); the typical morphology of a 20 nm Ag film deposited on the silicone oil surface has been verified with previous work in which the ramified structures in films consist of substantial nanoclusters. Figure 3 shows the SEM images of the 20 nm Ag film with different magnifications. To evaluate the SERS performance of this prepared substrate, we used R6G as the probe molecule. During the measurement of the Raman signal enhancement, 50 μL of R6G solutions with concentrations of 10–5, 10–6, and 10–7 M is dropped onto the Ag film surface via a pipette. Afterward, the Raman spectra were measured using a confocal Raman spectrometer (Renishaw) whose polarization was perpendicular to the film surface. The Raman spectrometer has an excitation laser wavelength of 532 nm and the laser power is 0.075 mW. The diameter of the laser spot is ∼1 μm and the signal integration time is 10 s.
Acknowledgments
The research was supported by the National Natural Science Foundation of China (grant no. 11604295, grant no. 61705197) and the Natural Science Foundation of Zhejiang Province (grant no. LQ17C100002).
The authors declare no competing financial interest.
References
- Kneipp K.; Wang Y.; Kneipp H.; Perelman L. T.; Itzkan I.; Dasari R. R.; Feld M. S. Single molecule detection using surface-enhanced Raman scattering (SERS). Phys. Rev. Lett. 1997, 78, 1667. 10.1103/physrevlett.78.1667. [DOI] [Google Scholar]
- Campion A.; Kambhampati P. Surface-Enhanced Raman Scattering. Chem. Soc. Rev. 1998, 27, 241–250. 10.1039/a827241z. [DOI] [Google Scholar]
- McNay G.; Eustace D.; Smith W. E.; Faulds K.; Graham D. Surface-enhanced Raman scattering (SERS) and surface-enhanced resonance Raman scattering (SERRS): a review of applications. Appl. Spectrosc. 2011, 65, 825–837. 10.1366/11-06365. [DOI] [PubMed] [Google Scholar]
- Fan M.; Andrade G. F. S.; Brolo A. G. A review on the fabrication of substrates for surface enhanced Raman spectroscopy and their applications in analytical chemistry. Anal. Chim. Acta 2011, 693, 7–25. 10.1016/j.aca.2011.03.002. [DOI] [PubMed] [Google Scholar]
- Wang A.; Kong X. Review of recent progress of plasmonic materials and nano-structures for surface-enhanced Raman scattering. Materials 2015, 8, 3024–3052. 10.3390/ma8063024. [DOI] [PMC free article] [PubMed] [Google Scholar]
- Moskovits M. Surface-enhanced spectroscopy. Rev. Mod. Phys. 1985, 57, 783. 10.1103/revmodphys.57.783. [DOI] [Google Scholar]
- Nie S.; Emory S. R. Probing single molecules and single nanoparticles by surface-enhanced Raman scattering. Science 1997, 275, 1102–1106. 10.1126/science.275.5303.1102. [DOI] [PubMed] [Google Scholar]
- Xu H.; Aizpurua J.; Käll M.; Apell P. Electromagnetic contributions to single-molecule sensitivity in surface-enhanced Raman scattering. Phys. Rev. E: Stat. Phys., Plasmas, Fluids, Relat. Interdiscip. Top. 2000, 62, 4318. 10.1103/physreve.62.4318. [DOI] [PubMed] [Google Scholar]
- Yang S.; Dai X.; Stogin B. B.; Wong T.-S. Ultrasensitive surface-enhanced Raman scattering detection in common fluids. Proc. Natl. Acad. Sci. U.S.A. 2016, 113, 268–273. 10.1073/pnas.1518980113. [DOI] [PMC free article] [PubMed] [Google Scholar]
- Ryder A. G. Surface enhanced Raman scattering for narcotic detection and applications to chemical biology. Curr. Opin. Chem. Biol. 2005, 9, 489–493. 10.1016/j.cbpa.2005.07.001. [DOI] [PubMed] [Google Scholar]
- Li X.; Chen G.; Yang L.; Jin Z.; Liu J. Multifunctional Au-coated TiO2 nanotube arrays as recyclable SERS substrates for multifold organic pollutants detection. Adv. Funct. Mater. 2010, 20, 2815–2824. 10.1002/adfm.201000792. [DOI] [Google Scholar]
- Alvarez-Puebla R. A.; Liz-Marzán L. M. SERS-based diagnosis and biodetection. Small 2010, 6, 604–610. 10.1002/smll.200901820. [DOI] [PubMed] [Google Scholar]
- Yamada H.; Nagata H.; Toba K.; Nakao Y. Charge-transfer band and SERS mechanism for the pyridine-Ag system. Surf. Sci. 1987, 182, 269–286. 10.1016/0039-6028(87)90101-4. [DOI] [Google Scholar]
- Schatz G. C.; Young M. A.; Van Duyne R. P.. Surface-Enhanced Raman scattering; Topics in Applied Physics; Springer, 2006; pp 19–45. [Google Scholar]
- Wang L.; Li H.; Tian J.; Sun X. Monodisperse, micrometer-scale, highly crystalline, nanotextured Ag dendrites: rapid, large-scale, wet-chemical synthesis and their application as SERS substrates. ACS Appl. Mater. Interfaces 2010, 2, 2987–2991. 10.1021/am100968j. [DOI] [PubMed] [Google Scholar]
- Jana N. R.; Gearheart L.; Murphy C. J. Wet chemical synthesis of high aspect ratio cylindrical gold nanorods. J. Phys. Chem. B 2001, 105, 4065–4067. 10.1021/jp0107964. [DOI] [Google Scholar]
- Freeman R. G.; Grabar K. C.; Allison K. J.; Bright R. M.; Davis J. A.; Guthrie A. P.; Hommer M. B.; Jackson M. A.; Smith P. C.; Walter D. G.; Natan M. J. Self-assembled metal colloid monolayers: an approach to SERS substrates. Science 1995, 267, 1629–1632. 10.1126/science.267.5204.1629. [DOI] [PubMed] [Google Scholar]
- Fan M.; Brolo A. G. Silver nanoparticles self-assembly as SERS substrates with near single molecule detection limit. Phys. Chem. Chem. Phys. 2009, 11, 7381–7389. 10.1039/b904744a. [DOI] [PubMed] [Google Scholar]
- Nuntawong N.; Horprathum M.; Eiamchai P.; Wong-Ek K.; Patthanasettakul V.; Chindaudom P. Surface-enhanced Raman scattering substrate of silver nanoparticles depositing on AAO template fabricated by magnetron sputtering. Vacuum 2010, 84, 1415–1418. 10.1016/j.vacuum.2009.12.020. [DOI] [Google Scholar]
- Mu C.; Zhang J.-P.; Xu D. Au nanoparticle arrays with tunable particle gaps by template-assisted electroless deposition for high performance surface-enhanced Raman scattering. Nanotechnology 2009, 21, 015604. 10.1088/0957-4484/21/1/015604. [DOI] [PubMed] [Google Scholar]
- Mulvihill M. J.; Ling X. Y.; Henzie J.; Yang P. Anisotropic etching of silver nanoparticles for plasmonic structures capable of single-particle SERS. J. Am. Chem. Soc. 2010, 132, 268–274. 10.1021/ja906954f. [DOI] [PubMed] [Google Scholar]
- Zoval J. V.; Biernacki P. R.; Penner R. M. Implementation of electrochemically synthesized silver nanocrystallites for the preferential SERS enhancement of defect modes on thermally etched graphite surfaces. Anal. Chem. 1996, 68, 1585–1592. 10.1021/ac951114+. [DOI] [PubMed] [Google Scholar]
- Lu C.; Cheng Y.; Pan Q.; Tao X.; Yang B.; Ye G. One-dimensional growth of zinc crystals on a liquid surface. Sci. Rep. 2016, 6, 19870. 10.1038/srep19870. [DOI] [PMC free article] [PubMed] [Google Scholar]
- Yang B.; Ma R. R.; Li D. M.; Xia A. G.; Tao X. M. Aggregation behavior and microstructure of silver thin films on ionic liquid substrates. Thin Solid Films 2012, 520, 2321–2325. 10.1016/j.tsf.2011.09.048. [DOI] [Google Scholar]
- Ye G.-X.; Michely T.; Weidenhof V.; Friedrich I.; Wuttig M. Nucleation, growth, and aggregation of Ag clusters on liquid surfaces. Phys. Rev. Lett. 1998, 81, 622. 10.1103/physrevlett.81.622. [DOI] [Google Scholar]
- Ye Z.; Sun G.; Sui C.; Yan B.; Gao F.; Cai P.; Lv B.; Li Y.; Chen N.; Xu F.; Wang K.; Ye G.; Yang S. Surface enhanced Raman scattering substrates prepared by thermal evaporation on liquid surfaces. Nanotechnology 2018, 29, 375502. 10.1088/1361-6528/aacede. [DOI] [PubMed] [Google Scholar]
- Zhang X.; Zhang C.; Yang B.; Lv N.; Pan Q.; Ye G. Aggregation mechanism of Ag atoms deposited on liquid surfaces. J. Phys. Soc. Jpn. 2011, 80, 104603. 10.1143/jpsj.80.104603. [DOI] [Google Scholar]
- Shrivastava A.; Gupta V. Methods for the determination of limit of detection and limit of quantitation of the analytical methods. Chron. Young Sci. 2011, 2, 21. 10.4103/2229-5186.79345. [DOI] [Google Scholar]
- Tian Y.; Liu H.; Chen Y.; Zhou C.; Jiang Y.; Gu C.; Jiang T.; Zhou J. Seedless one-spot synthesis of 3D and 2D Ag nanoflowers for multiple phase SERS-based molecule detection. Sens. Actuators, B 2019, 301, 127142. 10.1016/j.snb.2019.127142. [DOI] [Google Scholar]
- Yang Z.; Liu H.; Tian Y.; Chen Y.; Niu Z.; Zhou C.; Wang F.; Gu C.; Tang S.; Jiang T.; Zhou J. Synergistic effect of a “stellate” mesoporous SiO2@ Au nanoprobe and coffee-ring-free hydrophilic–hydrophobic substrate assembly in an ultrasensitive SERS-based immunoassay for a tumor marker. J. Mater. Chem. C 2020, 8, 2142–2154. 10.1039/c9tc05646g. [DOI] [Google Scholar]
- Liu F.; Cao Z.; Tang C.; Chen L.; Wang Z. Ultrathin diamond-like carbon film coated silver nanoparticles-based substrates for surface-enhanced Raman spectroscopy. ACS Nano 2010, 4, 2643–2648. 10.1021/nn100053s. [DOI] [PubMed] [Google Scholar]
- Liu Y.-C.; Yang K.-H.; Hsu T.-C. Improved Surface-Enhanced Raman Scattering Performances on Silver-Silica Nanocomposites. J. Phys. Chem. C 2009, 113, 8162–8168. 10.1021/jp810503z. [DOI] [Google Scholar]
- Sun Z.; Li Y.; Wang Y.; Chen X.; Zhang J.; Zhang K.; Wang Z.; Bao C.; Zeng J.; Zhao B.; Yang B. Three-dimensional colloidal crystal-assisted lithography for two-dimensional patterned arrays. Langmuir 2007, 23, 10725–10731. 10.1021/la7015935. [DOI] [PubMed] [Google Scholar]


